
Market Overview
| Study Period | 2020 - 2031 |
|---|---|
| Forecast Data Period | 2026 - 2031 |
| Base Year Market Size (2025) | USD 478.72 Billion |
| Market Size (2026) | USD 490.22 Billion |
| Market Size (2031) | USD 675.08 Billion |
| Growth Rate (2026 - 2031) | 6.61 % |
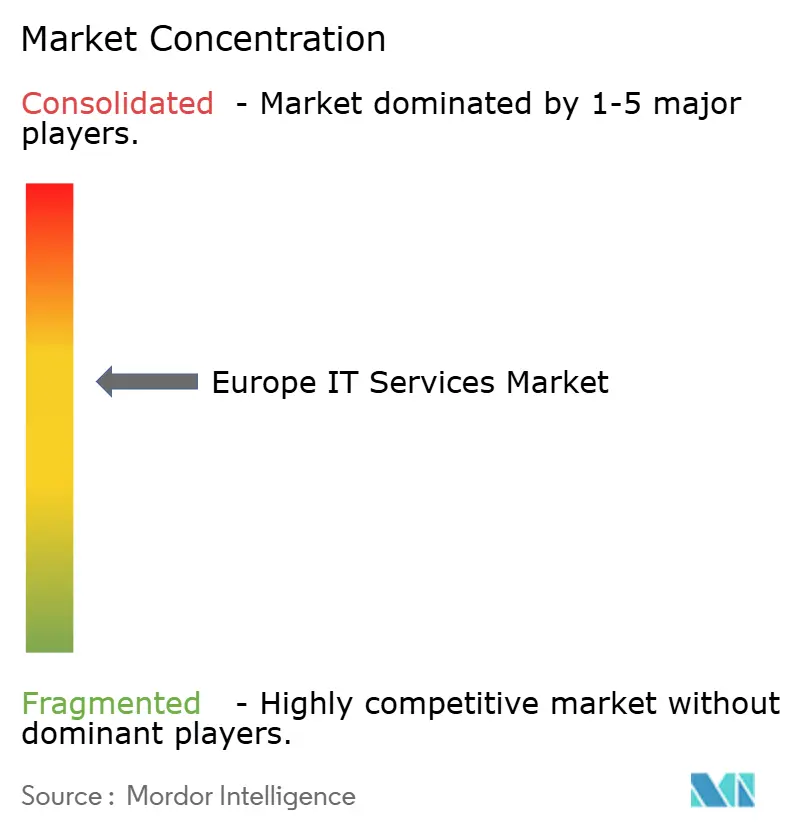
| Market Concentration | Medium |
Major Players *Disclaimer: Major Players sorted in no particular order Image © Mordor Intelligence. Reuse requires attribution under CC BY 4.0. | |
Europe IT Services Market Analysis by Mordor Intelligence
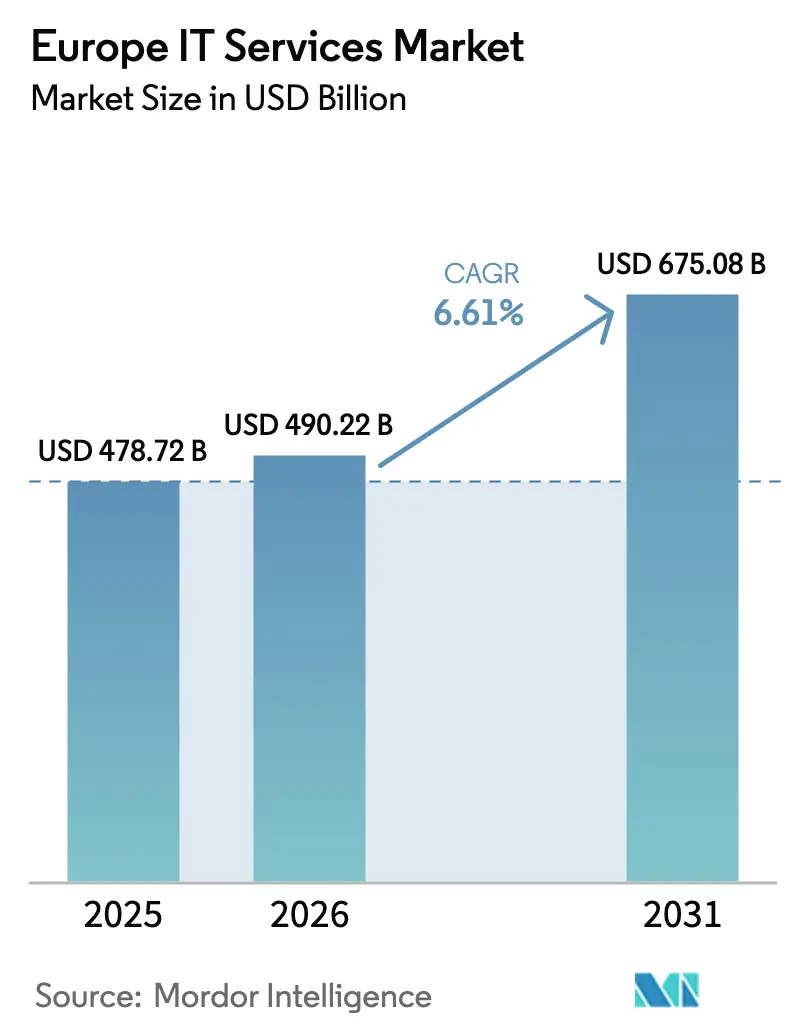
The Europe IT services market size is projected to be USD 478.72 billion in 2025, USD 490.22 billion in 2026 and reach USD 675.08 billion by 2031, growing at a CAGR of 6.61% from 2026 to 2031. Mandatory cybersecurity, sustainability reporting, and ERP modernization deadlines, rather than discretionary digital pilots, now set the rhythm for spending. Enterprises are reallocating budgets away from small proofs of concept toward large, compliance-driven outsourcing deals, especially in managed security and SAP S/4HANA migration. Delivery-model selection is fragmenting along data-sovereignty lines, giving cost-competitive nearshore hubs in Poland and Romania a pricing premium over India for sensitive workloads. At the same time, green-energy surcharges under the EU Emissions Trading System are pressuring hyperscalers to optimize data-center footprints rather than offer blanket price cuts. These structural shifts explain why the Europe IT services market trails faster-growing North American peers despite robust demand.
Key Report Takeaways
- By service type, Cloud and Platform Services led with 33.74% of Europe IT services market share in 2025, while Managed Security Services is advancing at a 6.72% CAGR through 2031.
- By enterprise size, Large Enterprises accounted for 60.36% of the Europe IT services market size in 2025; Small and Medium Enterprises are expanding at a 6.96% CAGR to 2031.
- By deployment model, Nearshore Delivery contributed 45.83% revenue in 2025, but Offshore Delivery is projected to climb at a 7.02% CAGR from 2026-2031.
- By end-user vertical, BFSI captured 20.93% share in 2025; Healthcare and Life-Sciences is forecast to post the fastest 6.88% CAGR to 2031.
- By Country, United Kingdom commanded a 26.64% share of the Europe IT services market in 2025, while Spain is expected to post a 7.11% CAGR to 2031.
Note: Market size and forecast figures in this report are generated using Mordor Intelligence’s proprietary estimation framework, updated with the latest available data and insights as of 2026.
Europe IT Services Market Trends and Insights
Drivers Impact Analysis*
| Driver | (~) % Impact on CAGR Forecast | Geographic Relevance | Impact Timeline |
|---|---|---|---|
| Surging enterprise-wide cloud migration | +1.2% | Global, with highest intensity in UK, Germany, Nordics | Medium term (2-4 years) |
| Demand for cost-optimized ITO and BPO contracts | +0.9% | Global, spill-over from UK and Germany to Southern Europe | Short term (≤ 2 years) |
| Shift to managed security amid EU-wide cyber-threat directives | +1.1% | EU-27, with early adoption in France, Netherlands, Belgium | Short term (≤ 2 years) |
| AI-driven vendor-selection platforms accelerating outsourcing | +0.7% | Global, early gains in UK, Germany, Nordics | Medium term (2-4 years) |
| Corporate urgency to modernize SAP and legacy ERP before 2027 support sunset | +1.0% | Germany, UK, France, Italy, Spain | Short term (≤ 2 years) |
| EU CSRD-linked ESG-reporting services boosting consulting demand | +0.8% | EU-27, strongest in Germany, France, Nordics | Medium term (2-4 years) |
| Source: Mordor Intelligence | |||
Surging Enterprise-Wide Cloud Migration
Cloud adoption jumped after the NIS2 Directive obliged essential entities to maintain alternate processing sites, making multi-cloud redundancy a legal necessity rather than a best practice.[1]European Commission, “NIS2 Directive,” EUROPA.EU German industrial firms are moving sensitive workloads to Gaia-X-aligned sovereign clouds while keeping non-critical data on global hyperscalers. The Digital Decade program targets 75% cloud usage among European companies by 2030, sustaining a pipeline of lift-and-shift and modernization projects. Vendors able to combine SAP expertise with container-based microservices are winning large transformation mandates. Multi-cloud complexity also unlocks follow-on demand for FinOps, observability, and inter-cloud security gateways, strengthening long-term managed-services revenues.
Shift to Managed Security Amid EU-Wide Cyber-Threat Directives
The NIS2 Directive expanded the scope of regulated entities from roughly 2,000 to more than 160,000 organizations in January 2025. Mandatory 24-hour breach reporting and supply-chain risk mapping overloaded in-house security teams, pushing buyers toward Managed Security Service Providers that can deliver round-the-clock SOC monitoring and zero-trust design. Sector guides from France’s ANSSI and Germany’s BSI standardized tender specifications, cutting procurement ambiguity and accelerating deal closure. Fixed-fee “compliance-as-a-service” bundles appeal to mid-market firms that lack chief information-security officers, converting ad-hoc audits into predictable subscriptions.
Corporate Urgency to Modernize SAP and Legacy ERP Before 2027 Support Sunset
SAP will end mainstream support for ECC 6.0 in December 2027, exposing nearly 15,000 European installations to security and compliance risks unless they migrate to S/4HANA. Brownfield conversions dominate in Germany’s manufacturing belt because custom ABAP code must be preserved to protect just-in-time production. Selective data-transition approaches, moving only high-value processes, promise license savings but heighten integration risk, driving demand for specialist integrators. Oracle and Microsoft are courting laggards with migration incentives, fragmenting the ERP services arena into vendor-specific skill pools and intensifying competition for scarce functional consultants.
EU CSRD-Linked ESG-Reporting Services Boosting Consulting Demand
The Corporate Sustainability Reporting Directive applies to all large undertakings by 2025 and to 50,000 companies by 2028, mandating double-materiality assessments and auditable Scope 3 emissions disclosures.[2]European Commission, “Corporate Sustainability Reporting Directive,” EUROPA.EU Most firms lack systems to aggregate supplier-level data, opening a sustained consulting revenue stream around ESG data platforms, IoT-enabled carbon metering and blockchain-based provenance tracking. Technology-plus-sustainability practices enjoy higher win rates than pure-play ESG advisories because they automate reporting and assurance in one stack, locking clients into multi-year managed-service extensions.
Restraints Impact Analysis*
| Restraint | (~) % Impact on CAGR Forecast | Geographic Relevance | Impact Timeline |
|---|---|---|---|
| Talent scarcity and wage inflation in key delivery hubs | -0.6% | Germany, UK, Nordics, Poland, Romania | Short term (≤ 2 years) |
| Geopolitical data-sovereignty barriers (Schrems II, AI Act) | -0.5% | EU-27, with acute impact on UK post-Brexit | Long term (≥ 4 years) |
| Prolonged client-decision cycles owing to macro-uncertainty | -0.4% | Global, highest in manufacturing-heavy Germany, Italy | Short term (≤ 2 years) |
| Rising carbon-footprint penalties on energy-intensive data centers | -0.3% | EU-27, particularly Germany, Netherlands, Nordics | Medium term (2-4 years) |
| Source: Mordor Intelligence | |||
Talent Scarcity and Wage Inflation in Key Delivery Hubs
Eurostat recorded 500,000 unfilled ICT posts in 2025 and median developer pay in Germany rose 8.2% year-on-year, eroding nearshore cost advantages.[3]Eurostat, “ICT Specialists—Hard-to-Fill Vacancies,” EUROSTAT.EC.EUROPA.EU Wage spikes of 9% in Poland and Romania squeezed vendors locked into fixed-price contracts signed during the low-inflation era. Brain drain toward North America compounds shortages, forcing providers to automate tier-1 support through generative-AI chatbots and prioritize high-margin advisory work. These stopgaps, however, only partly offset the structural talent gap, trimming Europe IT services market growth potential.
Geopolitical Data-Sovereignty Barriers (Schrems II, AI Act)
The Schrems II judgment voided the Privacy Shield and left trans-Atlantic data transfers exposed to future legal contests despite the 2023 adequacy decision. The AI Act’s extraterritorial rules require CE-marking and conformity assessments for high-risk systems delivered from offshore centers, pushing sensitive workloads to onshore or nearshore locations. Fragmented data-residency regimes prevent universal labor-arbitrage strategies and keep the Europe IT services market segmented into three non-fungible price tiers.
*Our forecasts treat driver/restraint impacts as directional, not additive. The impact forecasts reflect baseline growth, mix effects, and variable interactions.
Segment Analysis
By Service Type: Compliance Mandates Elevate Security Spend
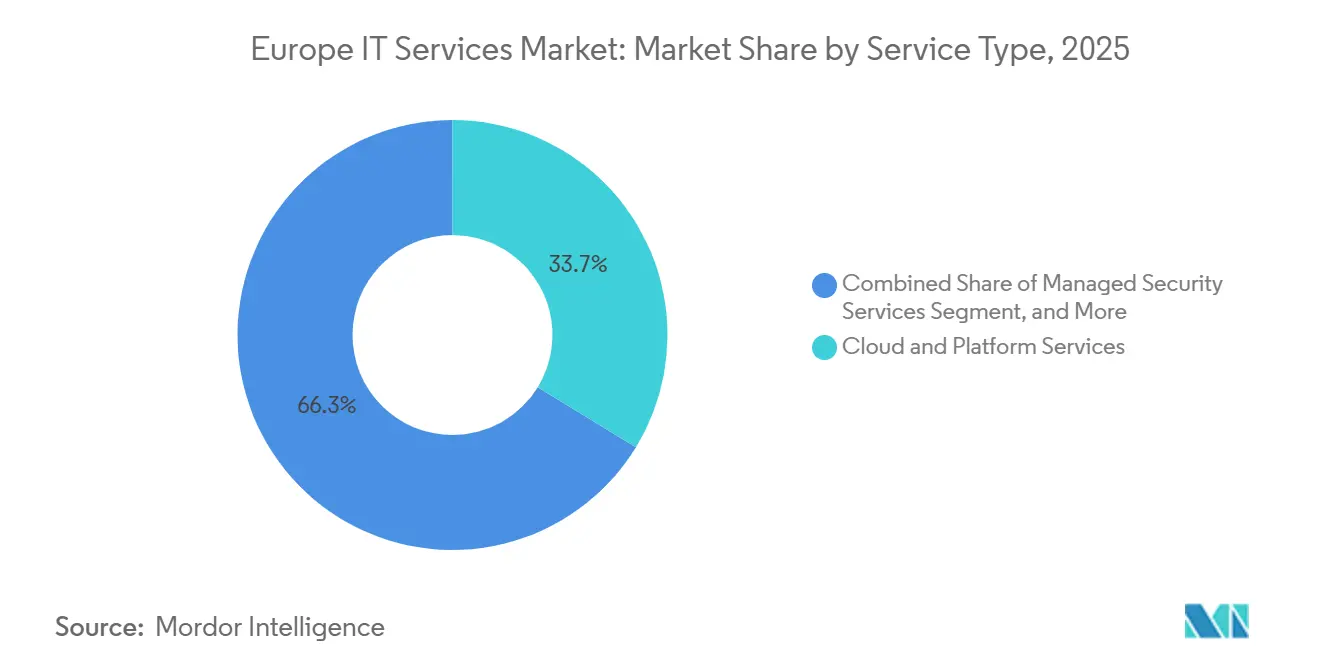
Managed Security Services sits atop growth rankings with a 6.72% CAGR to 2031 even though Cloud and Platform Services controlled a 33.74% Europe IT services market share in 2025. Mandatory threat-monitoring duties under NIS2 and DORA make 24x7 SOC coverage a board-level concern, converting discretionary security pilots into non-negotiable opex. Vendors that embed continuous compliance checks into ERP rollouts and cloud migrations capture incremental wallet share.
Consulting and Implementation revenue is buoyed by SAP S/4HANA conversions, CSRD-linked ESG platform buildouts, and European Health Data Space integrations. ITO and BPO lines are converging as robotic process automation and AI-driven document extraction reshape back-office deals, while Extended Detection and Response platforms push security spending from perimeter defense into predictive threat hunting.



By Enterprise Size: SME Digitalization Accelerates
Large Enterprises generated 60.36% of 2025 revenue thanks to multi-year global support deals, yet Small and Medium Enterprises are on course for a 6.96% CAGR through 2031. EU Digital Decade funds and Germany’s Digital Now grants cover up to 50% of eligible cloud costs, lowering adoption hurdles. Pre-configured SaaS bundles shorten deployment cycles, but integrations, data migration and cyber-posture assessments still require external expertise, expanding opportunity for modular service catalogs.
A secondary growth lever is consultancy-led “digital maturity” diagnostics, which unlock public subsidies and channel spend toward solution providers already accredited under national voucher schemes. This creates recurring advisory assignments alongside initial implementation work.
By Deployment Model: Offshore Gains Despite Data-Sovereignty Friction
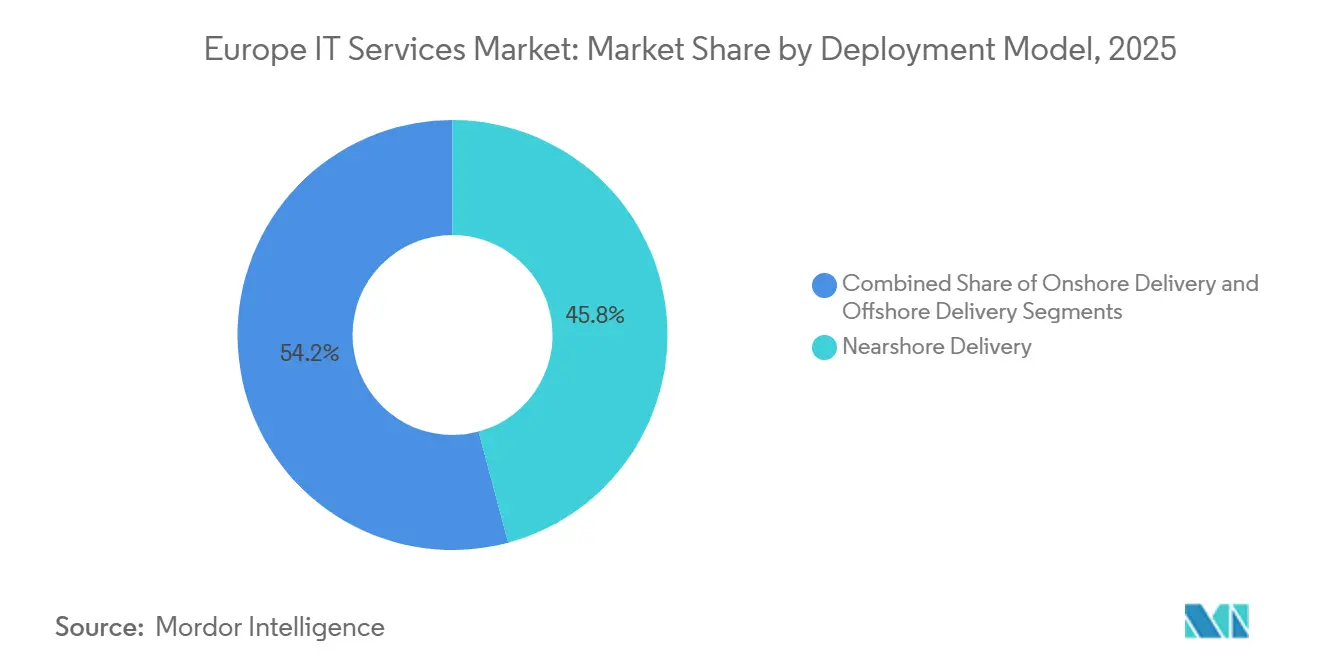
Nearshore Delivery retained 45.83% share in 2025 owing to GDPR-native Polish and Romanian centers that bridge cost and compliance. Offshore Delivery nevertheless leads growth at 7.02% because AI-fueled collaboration tools mitigate time-zone and communication barriers. Clients segment workloads, sensitive data resides onshore or nearshore, while commodity maintenance flows to India, with a three-tier tariff, onshore at 2× nearshore, nearshore at 1.5× offshore.
Follow-the-sun models rotate L1 support across geographies, freeing European experts for high-value tasks. However, Schrems II and AI Act restrictions inhibit wholesale workload re-location, ensuring demand persists for every tier.
By End-User Vertical: Healthcare Surges on EHDS Mandates
BFSI held 20.93% of 2025 revenue after the Digital Operational Resilience Act required banks to audit third-party ICT risk. Healthcare and Life Sciences is the fastest-growing vertical at 6.88% through 2031 because the European Health Data Space compels cross-border EHR interoperability. Manufacturing demand is tempered by interest-rate uncertainty, which delays Industry 4.0 capex, yet EU Recovery funds sustain baseline digital spending. Public-sector modernization benefits from the EUR 134 billion Recovery and Resilience Facility, although procurement cycles remain lengthy.
The EHDS regulation's requirement for a European Health Data Space infrastructure-enabling patients to access their health data across borders and researchers to access anonymized datasets for secondary use-is creating a multi-billion-euro opportunity in health IT services, spanning EHR system upgrades, consent-management platforms, and federated-learning architectures that preserve privacy while enabling AI model training
Geography Analysis
The United Kingdom maintained a 26.64% revenue share in 2025 but faces headwinds from Brexit-induced talent outflows and data-adequacy ambiguities that complicate cross-border contracting. Germany and France enjoy robust pipelines under the Digital Now and France 2030 programs, respectively, though wage inflation erodes margin headroom. Italy’s National Recovery and Resilience Plan allocates EUR 40.7 billion for digital transition yet is slowed by administrative bottlenecks.
Spain is the growth standout, with a 7.11% CAGR to 2031, powered by the Digital 2030 Agenda’s EUR 20 billion cloud and smart-city stimulus and a tax regime that courts nearshore centers. Elsewhere, the Nordics lead in AI and green-tech uptake, Benelux focuses on fintech and logistics digitalization, while Eastern Europe benefits from rising nearshore demand but wrestles with wage pressures.
Pricing spreads reflect regulatory friction, onshore UK and German rates average 2 × Polish nearshore tariffs, which in turn exceed Indian offshore by roughly 50%. Currency-hedging costs and energy-surcharge pass-throughs under the EU ETS introduce additional regional differentiation.
Regulatory Landscape
EU digital regulation is converging into a single compliance agenda that affects procurement patterns for European IT services, especially in managed security, data governance, and AI assurance. NIS2 expanded the regulated perimeter from roughly 2,000 to more than 160,000 organizations in January 2025, raising requirements around incident readiness and supply-chain controls and driving structured SOC and compliance-as-a-service procurements. In 2026, enforcement intensity increased under the Digital Services Act (DSA) via the European Commission and national Digital Services Coordinators, while the Commission also advanced the Digital Decade policy program as a coordinating framework for cloud, skills, and digital infrastructure targets.
Compliance timelines are also becoming contract triggers. The EU Data Act introduces core data-access and data-sharing obligations that become enforceable from September 12, 2026, which is set to expand integration and governance workloads across connected products and cloud platforms. Separately, the European Commission proposed updates to the EU Cybersecurity Act on January 20, 2026 to move toward a Union-wide ICT supply chain security framework, reinforcing third-party risk management, secure-by-design procurement language, and auditability requirements across delivery tiers (onshore, nearshore, and offshore).
Value Chain Analysis
The Europe IT services value chain starts with demand origination and compliance interpretation, covering regulatory gap assessments for NIS2, DSA, AI governance, and Data Act readiness. It then moves into solution design, implementation, and run operations, typically spanning cloud and platform engineering, application modernization (including SAP S/4HANA migrations), cybersecurity operations (SOC, XDR, zero trust), and process services (ITO/BPO with automation). A cross-stage layer increasingly covers data governance, observability, FinOps, and vendor risk controls to help clients manage performance alongside EU data-sovereignty and reporting requirements.
On the supply side, Europe-focused initiatives around technology sovereignty and supply chain security are shaping how providers assemble delivery teams. The European Commission highlighted an integrated technology stack approach (chips, infrastructure, software, cloud, and AI) in June 2026, aligning investment and industrial policy with digital infrastructure needs. EU and national bodies have also emphasized ICT supply chain risks across microchips, open-source libraries, and third-country subcontractors through security toolbox guidance. Together, these shifts are influencing prime contractor selection of hyperscalers, sovereign-cloud partners, and specialist subcontractors, and are increasing the weight given to standardized controls for software components, third-party dependencies, and delivery-center location decisions.
Competitive Landscape
The Europe IT services market remains moderately fragmented, the top five suppliers together hold only 28% share, leaving plentiful room for vertical specialists and delivery-model innovators. Accenture and Capgemini are expanding sovereign-cloud offerings to counter data-residency barriers, IBM Consulting opened a Warsaw SOC to capture NIS2-driven security spend, and Tata Consultancy Services won a five-year NHS deal that cements its European healthcare credentials. Atos divested non-core voice assets to fund cybersecurity expansion.
Indian integrators leverage AI-powered vendor-matching engines that halve RFP cycles, eroding incumbents’ relationship moat. Smaller contenders such as Reply, GFT Technologies, and Endava win on domain depth in fintech, healthtech, and AI Act compliance audits. Growing demand for outcome-based pricing compels legacy firms to tie fees to resilience metrics or carbon-emission reductions, shifting risk-reward profiles across contracts.
White-space opportunity clusters around sovereign-cloud orchestration and CSRD-compliant ESG automation, both of which are underserved by hyperscalers. Providers offering university upskilling pipelines and immigration sponsorship secure scarce talent faster, gaining a margin edge as wage inflation bites.
Europe IT Services Industry Leaders
Accenture plc
Capgemini SE
Tata Consultancy Services Limited
IBM Consulting
Atos SE
- *Disclaimer: Major Players sorted in no particular order

Market Opportunities and Future Outlook
Compliance-driven operating models are creating whitespace for providers that can industrialize trust layers across cloud and AI programs, including data-residency architecture, supply-chain security controls, and audit-ready governance for regulated buyers. A near-term catalyst is the EU Data Act becoming enforceable from September 12, 2026, which raises integration and data-sharing enablement work across IoT, platforms, and enterprise applications and increases demand for managed data governance and secure API ecosystems. The European Commission’s January 20, 2026 proposal to revise the EU Cybersecurity Act toward a Union-wide ICT supply chain security framework also pushes buyers to formalize third-party risk tooling, software component controls (including open-source dependencies), and evidence-based assurance in outsourcing contracts.
AI and sovereign cloud programs are translating into actionable service packages around platform build, operating models, and managed operations. Capgemini’s February 2026 sovereignty-oriented collaboration with Microsoft highlights demand for sovereignty by design managed service patterns for sensitive workloads. In parallel, a May 2026 Capgemini partnership tied to an OpenAI deployment capability points to enterprise interest in packaged AI engineering and governance delivered by large integrators. In public sector and supranational bodies, Accenture’s March 2026 work to scale AI across the European Commission’s DG INTPA operations provides a reference point for agentic AI adoption in government workflows, supporting demand for secure AI enablement, change management, and long-run managed services aligned with European procurement and compliance requirements.
Recent Industry Developments
- July 2026: Accenture: The NATO Communications and Information Agency awarded Accenture a contract for the Protected Business Network program to deliver cloud-enabled digital infrastructure. The defense sector IT services contract in Europe expands Accenture's sovereign-cloud and defense-digital capabilities in Europe.
- July 2026: Accenture: Accenture was selected to design and build an AI Assistant for EU DG INTPA. The EU-wide government AI enabled governance support initiative advances Accenture's footprint in European public-sector AI deployments.
- June 2026: Capgemini: Capgemini won a multi-year contract with HM Revenue & Customs to transform customer experience operations for UK taxpayers. The sovereign-cloud-enabled project adds a large UK public-sector pipeline to Capgemini’s European public-sector portfolio.


Research Methodology Framework and Report Scope
Market Definition and Coverage
For this methodology, the Europe IT services market covers paid services delivered by external providers that plan, build, run, secure, and support IT environments for enterprises and public sector users across Europe, and it is measured in revenue terms in USD.
Scope exclusions: We exclude in-house IT labor costs, resale-only hardware and packaged software sales, and telecom connectivity charges unless they are billed as part of a defined IT service contract.
Segmentation Overview
- By Service Type
- IT Consulting and Implementation
- IT Outsourcing (ITO)
- Business Process Outsourcing (BPO)
- Managed Security Services
- Cloud and Platform Services
- By Enterprise Size
- Small and Medium Enterprises (SMEs)
- Large Enterprises
- By Deployment Model
- Onshore Delivery
- Nearshore Delivery
- Offshore Delivery
- By End-User Vertical
- BFSI
- Manufacturing
- Government and Public Sector
- Healthcare and Life-Sciences
- Retail and Consumer Goods
- Telecom and Media
- Logistics and Transport
- Energy and Utilities
- Other End-User Verticals
- By Country
- United Kingdom
- Germany
- France
- Italy
- Spain
- Rest of Europe
Data Sources, Market Sizing, and Validation
Desk Research
Desk research started with public spend and macro indicators, and then the numbers were shaped into an IT services-only view. We referenced sources such as Eurostat national accounts and ICT usage series, the European Commission Digital Economy and Society indicators, OECD digital economy datasets, and the World Bank macro series to set the activity backdrop and to sense-check country splits.
To ground service demand, we also used management commentary from annual reports and investor decks of listed IT service providers, public procurement award portals for large outsourcing and systems integration tenders, and reputable press coverage on cloud and cybersecurity programs. Where available, we complemented this with paid subscriptions for company financials and a patent database to verify technology emphasis and investment direction. The desk sources listed above are illustrative only, and many other public and paid references were used to collect, validate, and clarify inputs.
Primary Interviews and Surveys
Primary work was used to test what the desk sources could not show clearly, especially how contracts are priced and how service scope is packaged across countries. We spoke with delivery leaders, sourcing managers, and program owners across major European markets, and then cross-checked points like managed services attach rates, cloud migration intensity, and cybersecurity compliance work that is being contracted out.
Distribution of primary research fieldwork respondents
| Company type | Respondent position |
|---|---|
| Top tier: 34% | CXOs: 19% |
| Mid tier: 44% | Functional/Unit leaders: 22% |
| Smaller Players: 22% | Managers: 59% |
Market-Sizing & Forecasting
Sizing was built using a top-down reconstruction, where national IT spend signals, outsourcing intensity, and service mix were used to arrive at an IT services revenue pool by country and then rolled up to Europe. To keep the totals realistic, we corroborated them with selective bottom-up checks such as sampling provider revenue exposure to Europe, typical contract values seen in public tenders, and ASP x headcount style estimates for common service lines when pricing signals were available.
Inputs that mattered in the model included IT services budget growth expectations, cloud migration and modernization deal volumes, managed services penetration by large enterprises, security and compliance program timing, and wage inflation in delivery hubs that affects run-rate pricing. Forecasts were developed using scenario analysis, where a base case was shaped by expert views on discretionary project recovery, regulatory-driven security work, and multi-year outsourcing renewals, and then stress-tested with a softer and a faster adoption case. When country-level gaps showed up, proxy indicators (such as procurement activity and enterprise digital intensity) were applied, and then adjusted during review so the final sum stayed consistent with observed market signals.
Data Validation & Update Cycle
Outputs were checked against independent signals like reported regional revenue trends, outsourcing contract announcements, and public IT spending forecasts, and then large variances were investigated before sign-off. If a number looked off, we re-opened the assumption behind it, revisited the source trail, and re-contacted selected experts to confirm the direction of change.
A second analyst review is completed to confirm arithmetic integrity, country roll-ups, and currency consistency, followed by a final editorial pass focused on internal consistency across charts and narratives. Reports are refreshed annually, and interim updates are made when material events shift spending patterns, such as major regulatory deadlines or sharp macro changes. Before delivery, the model is re-run with the latest available inputs so clients receive the most current view.
Mordor Intelligence's Europe IT Services Market Estimate Compared With Other Published Estimates
Published market sizes for Europe IT services can look far apart because the starting point is not always the same, and the definition of what counts as a service dollar changes from one study to another. Differences typically come from whether spending is tracked as end-user IT spend versus provider revenue, how cloud and telecom related charges are treated, and which countries are included in the Europe roll-up.
Some estimates are closer to a narrower provider-revenue view or a country subset focus, and others are closer to a broader IT services spending line that can be influenced by budget accounting choices. In Mordor Intelligence, the count is limited to externally delivered IT services revenue across the full Europe coverage shown in the report, and resale-only items and pure connectivity charges are kept out unless bundled into a service contract.
Benchmark comparison
| Source | Market Size | Gaps in Research Methodology |
|---|---|---|
| Mordor Intelligence | USD 478.72 B (2025) | |
| Trade Publication A | USD 489.80 B (2025) | Often presented as end-user IT services spending, which can include broader budget classifications and may not map cleanly to provider-recognized service revenues across countries. |
| Press Release B | USD 311.50 B (2023) | Uses a lower starting-year value that is likely shaped by a tighter country set emphasis and/or narrower service inclusions, and the time window and currency handling are not clearly explained in the public summary. |
The spread across the three figures is mainly explained by what is being counted as an IT service and how the Europe total is constructed. By keeping the scope tied to contracted IT services revenue and then cross-checking it with procurement signals and provider exposure, the final market size stays traceable to practical inputs and repeatable steps.


Key Questions Answered in the Report
What is the projected value of the Europe IT services market in 2031?
Forecasts indicate the market will reach USD 675.08 billion by 2031.
How fast is managed security spending growing in Europe?
Managed Security Services is projected to rise at a 6.72% CAGR from 2026-2031, outpacing all other service types.
Why are SMEs accelerating IT outsourcing adoption?
EU Digital Decade incentives subsidize up to half of qualified cloud costs, enabling SMEs to adopt SaaS and managed services without heavy upfront investment.
Which European country is expected to post the fastest IT services growth?
Spain is forecast to record a 7.11% CAGR through 2031, propelled by EUR 20 billion in public digital-infrastructure programs.
How will SAP’s 2027 support sunset affect service providers?
Roughly 15,000 European ECC 6.0 users must migrate to S/4HANA or risk compliance gaps, fueling multi-year consulting and implementation demand.
Page last updated on:


 Your data is secure and never sold or shared.


