Market Overview
| Study Period | 2017 - 2030 |
|---|---|
| Forecast Data Period | 2025 - 2030 |
| Historical Data Period | 2017 - 2023 |
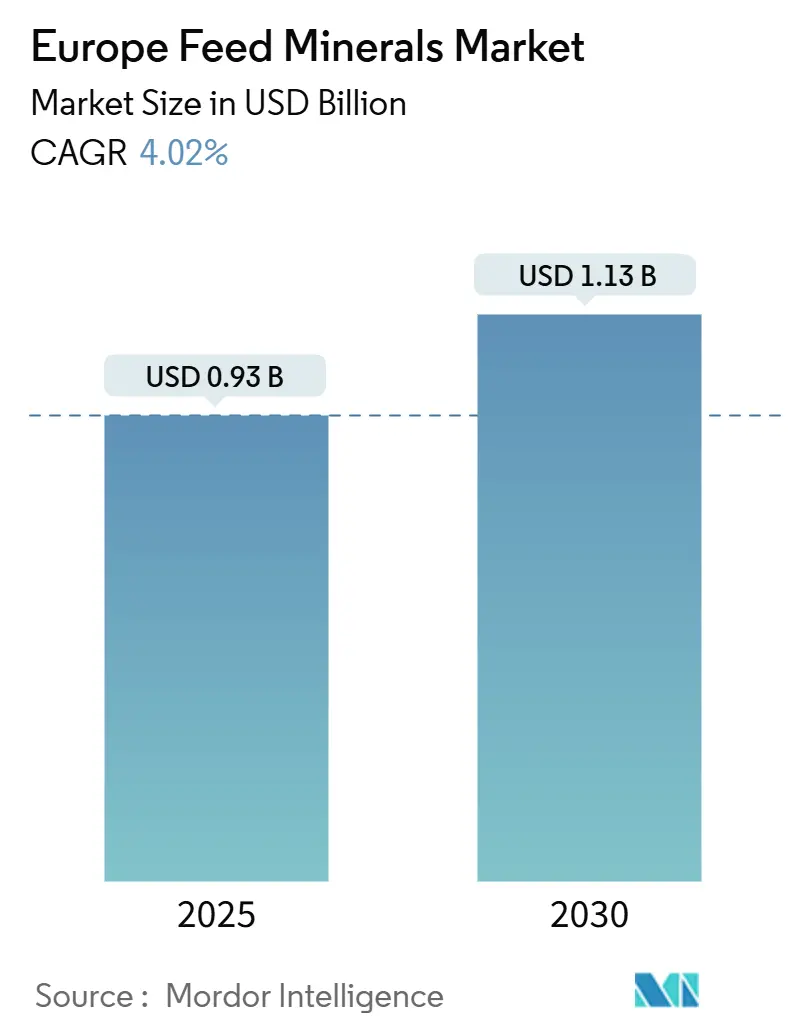
| Market Size (2025) | USD 0.93 Billion |
| Market Size (2030) | USD 1.13 Billion |
| Growth Rate (2025 - 2030) | 4.02% CAGR |
| Market Concentration | Medium |
Major Players *Disclaimer: Major Players sorted in no particular order Image © Mordor Intelligence. Reuse requires attribution under CC BY 4.0. | |
Europe Feed Minerals Market Analysis by Mordor Intelligence
The Europe feed minerals market size reached USD 0.93 billion in 2025 and is projected to grow at a 4.0% CAGR to USD 1.13 billion by 2030. This stable expansion owes much to the region’s recovery in compound feed output, the regulatory push toward lower antibiotic use, and strict environmental rules that encourage more bioavailable mineral solutions. Demand also benefits from the rebound in pork herds following African swine fever, sustained dairy herd numbers, and a wider consumer shift toward certified sustainable animal proteins. Producers increasingly look to chelated minerals and precision dosing to satisfy emission caps on zinc and copper while safeguarding animal performance. Competitive momentum centers on suppliers that can pair regulatory fluency with traceable high-efficiency formulations, giving them an edge in both tender processes and retailer sustainability scorecards.
Key Report Takeaways
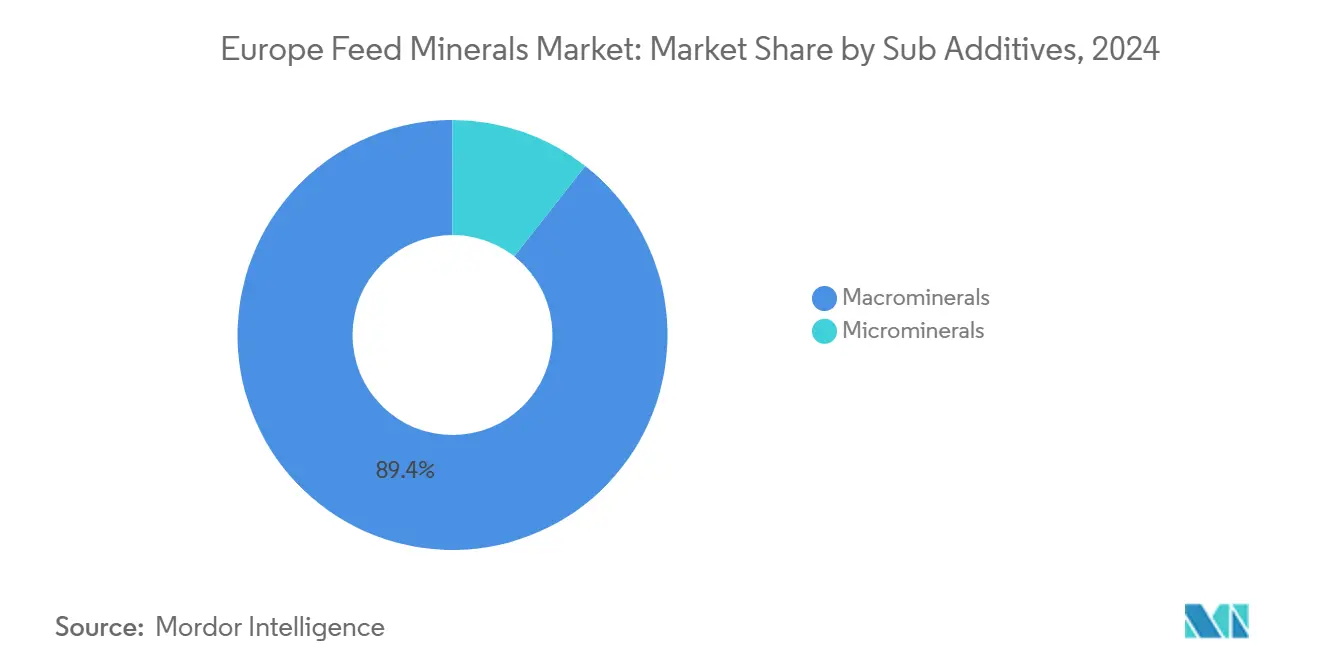
By sub-additive, macrominerals commanded an 89.4% Europe feed minerals market share in 2024, while microminerals are set to post the fastest 4.1% CAGR through 2030.
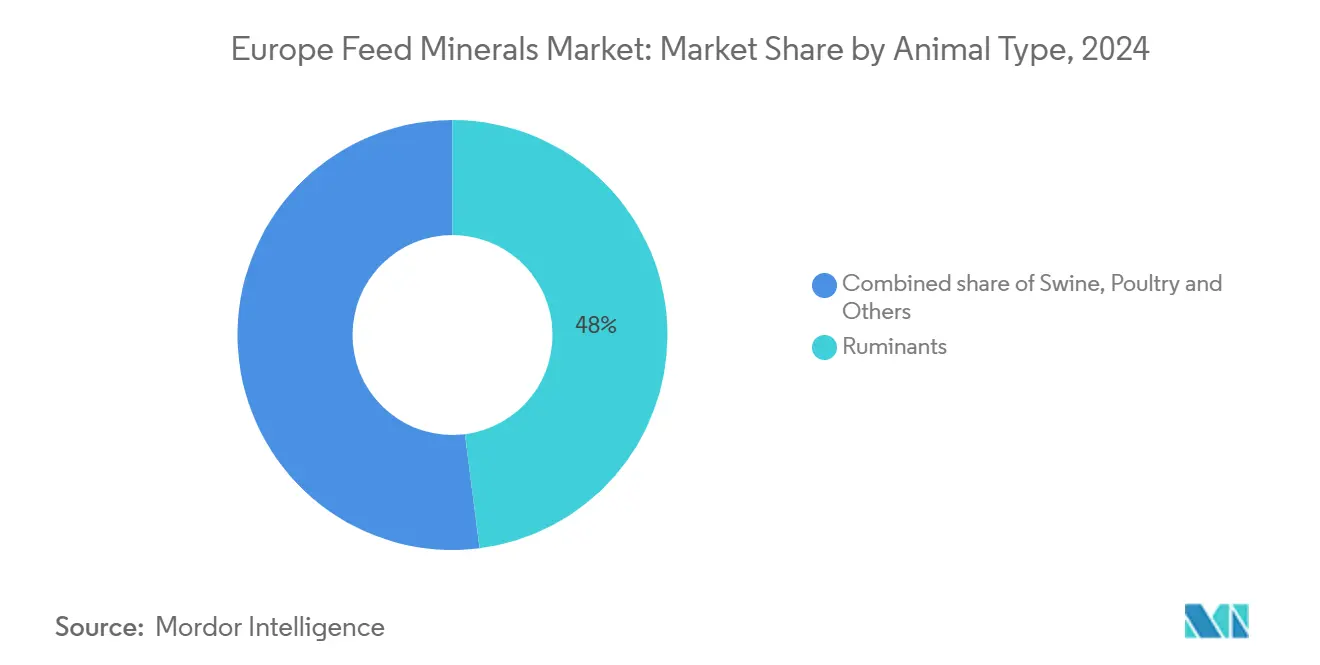
By animal, ruminants led with 48% of the Europe feed minerals market size in 2024; swine is forecast to expand at a 4.52% CAGR to 2030.
By geography, Spain captured 16% of the Europe feed minerals market size in 2024; the United Kingdom is advancing at the highest 4.8% CAGR through 2030.
Europe Feed Minerals Market Trends and Insights
Drivers Impact Analysis*
| Driver | ( ~ ) % Impact on CAGR Forecast | Geographic Relevance | Impact Timeline |
|---|---|---|---|
| Increasing demand for antibiotic-free animal nutrition | +1.20% | Germany and Netherlands lead | Medium term (2-4 years) |
| Rising consumer preference for sustainable livestock products | +0.80% | Western Europe widening eastward | Long term (≥ 4 years) |
| Stringent EU (European Union) environmental regulations and Green Deal targets | +1.00% | All EU states except UK and Russia | Short term (≤ 2 years) |
| Growing adoption of precision animal farming and animal nutrition | +0.60% | Northern and Western Europe | Medium term (2-4 years) |
| Enhanced focus on animal health and welfare standards | +0.70% | Region-wide, strongest in Nordics | Medium term (2-4 years) |
| Technological advances in mineral bioavailability and chelation | +0.90% | Germany, Netherlands, and France | Long term (≥ 4 years |
| Source: Mordor Intelligence | |||


Increasing Demand for Antibiotic-Free Animal Nutrition
European livestock producers are relying on mineral-based immunity and gut health programs because prophylactic antibiotics now face sweeping restrictions across member states[1]European Food Safety Authority, “Antimicrobial Resistance,” March, 2025, Efsa.europa.eu. The 2022 EU ban on antibiotic growth promoters catalyzed a significant opportunity for alternatives, and trace mineral premixes emerged as a principal pillar in these reformulations. Feed mills in Germany and the Netherlands have already lifted organic trace mineral inclusion by 15-20% since 2024, redirecting formulation budgets to zinc, copper, and selenium chelates with demonstrated immune benefits. FEFAC (The European Feed Manufacturers' Federation) guidance frames mineral nutrition as an essential first line of defense in herd health programs, which pushes demand beyond mere deficiency prevention toward proactive performance insurance. Suppliers capitalizing on this shift publish in-house trials showing reduced veterinary costs and tighter feed conversion ratios. The trend has moved from niche to norm within two years, cementing its medium-term positive impact on the Europe feed minerals market
Rising Consumer Preference for Sustainable Livestock Products
Rising willingness to pay for sustainability seals is causing producers to audit mineral footprints in tandem with carbon and water metrics. Retail studies reveal that 67% of shoppers scan packs for eco labels, which in turn pressures meat and dairy brands to document lower mineral excretion and verified sourcing. Chelated minerals that achieve equal performance with 30-50% lower inclusion often give processors a quantifiable emissions claim in supplier scorecards adopted by chains such as Carrefour and Tesco. This consumer pull extends to quick-service restaurants that now specify trace mineral efficiency in their protein procurement checklists. The premium captured at the shelf flows downstream to feed formulators, justifying price spreads of 20-40% over inorganic minerals. Over time, this preference is anticipated to ripple eastward as global retailers grow their presence in Poland, Romania, and the Baltics. The long-run effect reinforces higher-margin micromineral demand, which supports both volume and value growth for the Europe feed minerals market.
Stringent EU Environmental Regulations and Green Deal Targets
The Farm to Fork strategy stipulates a 50% nutrient-loss reduction by 2030 and sets 2026 discharge ceilings of 150 mg/kg for zinc and 25 mg/kg for copper[2]European Commission, Farm to Fork Strategy: For a Fair, Healthy and Environmentally-Friendly Food System, May 2023. https://ec.europa.eu .. Feed formulators therefore rush to substitute high-dose inorganic oxides with chelates that slash fecal mineral output yet retain growth performance. Compliance costs run USD 0.16-0.27 per metric ton of feed as mills retool premixes and documentation templates. Because non-conforming diets face fines and lost contracts, breeders now sign multiyear supply agreements with trace mineral specialists that guarantee dossier support. Early adopters signal improved emission metrics to local regulators, gaining smoother permitting and sometimes public subsidies for on-farm slurry treatment. The short-term timeline magnifies the driver’s urgency, making regulatory foresight a decisive commercial advantage inside the Europe feed minerals market.
Growing Adoption of Precision Animal Farming and Animal Nutrition
Digital feeders, inline sensors, and cloud dashboards are shifting minerals from blanket inclusion to dynamic micro-dosing[3]Wageningen University, “Livestock Research,” 2024, Wur.nl. Dairy barns installing precision systems report 8-12% feed conversion gains plus 15-20% mineral waste reductions within one lactation. Hardware investment ranging USD 26,750-80,250 per farm favors large herds, so adoption still clusters in the Netherlands, Denmark, and Germany. Yet regional demo projects funded by EU Digital Farming grants are now lowering the barrier for midsize operators. Mineral suppliers ride this wave by bundling IoT software, premix analytics, and field support into subscription models that move revenue from tonnage to services. As data protocols normalize across equipment brands, interoperability will speed uptake in Eastern Europe, reinforcing medium-term CAGR support for the Europe feed minerals market.
Restraints Impact Analysis*
| Restraint | ( ~ ) % Impact on CAGR Forecast | Geographic Relevance | Impact Timeline |
|---|---|---|---|
| High raw material price volatility and supply chain disruptions | −0.9% | Europe-wide, sharper in East | Short term (≤ 2 years) |
| Complex and costly EU regulatory compliance requirements | −0.6% | All EU states except UK | Medium term (2-4 years) |
| High cost of organic trace minerals | −0.4% | Price-sensitive users | Long term (≥ 4 years) |
| Environmental pressure and emission reduction mandates | −0.3% | Northern and Western Europe | Medium term (2-4 years) |
| Source: Mordor Intelligence | |||
High Raw Material Price Volatility and Supply Chain Disruptions
Copper sulfate swung between USD 2,800 and USD 4,200 per metric ton in 2024, while zinc oxide shifted from USD 2,100 to USD 3,400, eroding gross margins for mineral premixers. Smaller feed mills lacking hedging instruments were compelled either to shorten contracts or build expensive inventories, with carrying costs up 23%. The Russia-Ukraine conflict also trimmed phosphate intermediates, formerly 35% of regional supply, forcing buyers to source from Morocco at elevated freight tariffs. Energy-intensive roasting and granulation plants in Germany and the Netherlands faced 40-60% cost jumps when spot natural gas spiked, prompting temporary shutdowns that tightened availability. Because livestock integrators resist full pass-through of such volatility, suppliers sometimes postpone product launches or scale down R&D budgets, tempering top-line growth in the Europe feed minerals market over the next two years.
Complex and Costly EU Regulatory Compliance Requirements
Securing a new mineral form under REACH (Registration, Evaluation, Authorization, and Restriction of Chemicals) and EFSA (European Food Safety Authority) can cost significantly and stretch 18-24 months. Detailed toxicology dossiers, residue studies, and multi-species trials consume cash and specialist staff, hurdles that smaller innovators struggle to clear. Even post-approval, divergent national interpretations mean label and language tweaks for Germany, France, and Italy, multiplying administrative overhead. While such rigor protects food safety, it discourages newcomers and slows the turnover of more sustainable technologies. Market incumbents therefore maintain pricing power, but overall innovation velocity flattens, subtracting 0.6 percentage points from forecast CAGR in the Europe feed minerals market.
*Our forecasts treat driver/restraint impacts as directional, not additive. The impact forecasts reflect baseline growth, mix effects, and variable interactions.
Segment Analysis
By Sub Additive: Macrominerals Drive Volume While Microminerals Lead Innovation
Macrominerals held an 89.4% Europe feed minerals market share in 2024 because every commercial ration must meet baseline requirements for calcium, phosphorus, magnesium, and sodium. Volume reliance stems from inclusion rates of 0.5-2.0% of feed weight, guaranteeing steady tonnage even in modest livestock cycles. Macrominerals compete primarily on cost and logistics, limiting price leverage and innovation depth. In contrast, microminerals posted a projected 4.1% CAGR, outpacing the overall Europe feed minerals market, thanks to rising demand for chelated zinc, copper, and selenium that promise improved bioavailability. Feed formulators demonstrate 15-25% uptake gains when substituting amino acid chelates for oxides, which lowers required inclusion and cuts fecal output. Premium nutrition aligns with welfare metrics and emission caps, so buyers willingly pay a markup.
The micromineral space attracts specialized suppliers such as Zinpro, Novus International, and Alltech, whose portfolios center on organic trace elements with proprietary ligands and encapsulation technologies. Because EFSA maximum tolerable levels cap total zinc and copper, higher-efficiency sources are the only practicable route to maintain performance without breaching limits. As a result, microminerals increasingly underpin precision-feeding strategies tied to IoT systems, testing new service models that bundle sensors, software, and premixes. These dynamics boost the high-margin portion of the Europe feed minerals market size and expand its technological sophistication, even as macrominerals continue to anchor overall volume.


By Animal: Ruminants Dominate While Swine Rebounds Strongest
Ruminants represented 48% of the Europe feed minerals market size in 2024. Their complex rumen metabolism mandates balanced macro and micro profiles, creating enduring demand for premixes that safeguard milk yield and reproduction. Dairy integrators increasingly adopt rumen-protected zinc and manganese sources to curb lameness, tying mineral programs directly to welfare bonuses. In beef operations, protected phosphorus formulations support growth under pasture intensification while complying with phosphate runoff limits.
Swine recorded the quickest 4.52% CAGR through 2030 as herds recover from African swine fever setbacks in Eastern Europe. Producers renovating facilities embed precision feeding lines that regulate trace elements down to grams per ton, optimizing gain while trimming waste. Chelated copper now serves dual roles in gut health and performance, replacing banned antibiotic promoters. Poultry, with 27.4% of value in 2024, deploys stage-specific premixes that escalate manganese and zinc for skeletal strength in broilers. Aquaculture, although lower in tonnage, grows briskly in Norway and Mediterranean nations where salmon, trout, and sea bass diets rely on highly digestible iron, selenium, and iodine sources to limit water contamination.
Geography Analysis
Spain maintains leadership at 16% share because intensive pork and poultry clusters secure steady macromineral demand and create early pilot sites for chelated programs. Feed mill consolidation around Lerida and Zaragoza improves bargaining leverage, favoring suppliers that bundle macro bases with trace packets. Germany and France each hover modest share, leveraging robust dairy sectors and a mature premix industry that now allocates more R&D to organic trace innovations.
The United Kingdom’s 4.8% CAGR arises from combined tariff relief and retailer pressure for lower-emission proteins. Multisite integrators are renegotiating mineral contracts every 18 months, opening doors for continental players formerly priced out by duties. The UK additionally champions digital documentation, so feed additives offering blockchain traceability see faster acceptance. Eastern Europe’s Poland, the Czech Republic, and Hungary are channeling EU modernization funds into precision feed equipment, which in turn specifies trace minerals supplied in micro-granulate form to fit auger accuracy standards.
The Netherlands wields disproportionate influence because its high-resolution dairy data sets serve as reference benchmarks for EFSA risk assessment. Over 40% of Dutch dairies utilize precision feeding technology, making them prime customers for brand-new chelation molecules that validate bioavailability in commercial settings. Italy’s Emilia-Romagna dairy and Veneto poultry belts increasingly select mineral suppliers that offer integrated enzyme and acidifier packages, showing the trend toward bundled additive solutions. Scandinavian markets, notably Denmark, maintain strict copper and zinc discharge rules that spur fast adoption of lower-dose chelates. Collectively, the geographic mosaic underscores varied but converging demand patterns that reinforce the scaling potential of the Europe feed minerals market.
Competitive Landscape
The Europe feed minerals market exhibits moderate concentration: the top five firms secure significant share, leaving room for midsize innovators. Cargill leads the market, leveraging vertical integration from commodity trading to on-farm services. BASF follows, pairing organic trace minerals with functional ingredients like enzymes. ADM’s position rests on a strong feed additive network. While these giants enjoy sourcing and compliance economies, specialized outfits such as Zinpro, Novus International, Inc., and Alltech differentiate on chelation chemistry and technical service depth.
Strategic activity points to technology-focused acquisitions. BASF invests in ligand research centers in Ludwigshafen, while Cargill co-funds digital feed platforms that blend mineral inclusion forecasts with barn sensor data. Suppliers view EU Green Deal mandates not just as compliance hurdles but as revenue triggers for precision mineral packages marketed with emission reduction proof points.
Emerging players include sensor firms linking micronutrient release to real-time rumen pH and biotechnology startups encapsulating minerals in yeast cell walls for targeted intestinal uptake. Collaboration deals between ingredient majors and ag-tech startups illustrate the race to integrate hardware and software solutions that lock in customers. Price competition remains rational because approvals act as a moat; instead, vendors contest share through value-added analytics and on-farm audits. The resulting landscape supports steady, innovation-driven growth for the Europe feed minerals market.
Europe Feed Minerals Industry Leaders
Cargill, Incorporated.
BASF
ADM
Yara
SHV
- *Disclaimer: Major Players sorted in no particular order


Recent Industry Developments
- August 2025: SAM Nutrition introduced Nexus, a feed additive division, at IPPE 2025. This expansion builds on the company's established position in animal feed minerals, following the successful implementation of its NexTrace hydroxy trace mineral line, which focuses on livestock health and performance.
- October 2024: Phibro Animal Health Corporation acquired Zoetis's medicated feed additive and water-soluble product portfolio. This acquisition strengthens Phibro's position in the European feed additive market and creates opportunities for expansion into trace minerals through combined formulations.
- January 2023: Novus International acquired biotech company Agrivida Inc., gaining ownership of the proprietary INTERIUS technology. This technology embeds feed Minerals inside grain to improve bioavailability and sustainability, aligning with EU nutrient efficiency and Farm to Fork objectives.


Europe Feed Minerals Market Report Scope
Macrominerals, Microminerals are covered as segments by Sub Additive. Aquaculture, Poultry, Ruminants, Swine are covered as segments by Animal. France, Germany, Italy, Netherlands, Russia, Spain, Turkey, United Kingdom are covered as segments by Country.By Sub Additive
| Macrominerals |
| Microminerals |
By Animal
| Aquaculture | Fish |
| Shrimp | |
| Other Aquaculture Species | |
| Poultry | Broiler |
| Layer | |
| Other Poultry Birds | |
| Ruminants | Beef Cattle |
| Dairy Cattle | |
| Other Ruminants | |
| Swine | |
| Other Animals |
By Geography
| France |
| Germany |
| Italy |
| Netherlands |
| Russia |
| Spain |
| Turkey |
| United Kingdom |
| Rest of Europe |
| By Sub Additive | Macrominerals | |
| Microminerals | ||
| By Animal | Aquaculture | Fish |
| Shrimp | ||
| Other Aquaculture Species | ||
| Poultry | Broiler | |
| Layer | ||
| Other Poultry Birds | ||
| Ruminants | Beef Cattle | |
| Dairy Cattle | ||
| Other Ruminants | ||
| Swine | ||
| Other Animals | ||
| By Geography | France | |
| Germany | ||
| Italy | ||
| Netherlands | ||
| Russia | ||
| Spain | ||
| Turkey | ||
| United Kingdom | ||
| Rest of Europe | ||


Market Definition
- FUNCTIONS - For the study, feed additives are considered to be commercially manufactured products that are used to enhance characteristics such as weight gain, feed conversion ratio, and feed intake when fed in appropriate proportions.
- RESELLERS - Companies engaged in reselling feed additives without value addition have been excluded from the market scope, to avoid double counting.
- END CONSUMERS - Compound feed manufacturers are considered to be end-consumers in the market studied. The scope excludes farmers buying feed additives to be used directly as supplements or premixes.
- INTERNAL COMPANY CONSUMPTION - Companies engaged in the production of compound feed as well as the manufacturing of feed additives are part of the study. However, while estimating the market sizes, the internal consumption of feed additives by such companies has been excluded.
| Keyword | Definition |
|---|---|
| Feed additives | Feed additives are products used in animal nutrition for purposes of improving the quality of feed and the quality of food from animal origin, or to improve the animals’ performance and health. |
| Probiotics | Probiotics are microorganisms introduced into the body for their beneficial qualities. (It maintains or restores beneficial bacteria to the gut). |
| Antibiotics | Antibiotic is a drug that is specifically used to inhibit the growth of bacteria. |
| Prebiotics | A non-digestible food ingredient that promotes the growth of beneficial microorganisms in the intestines. |
| Antioxidants | Antioxidants are compounds that inhibit oxidation, a chemical reaction that produces free radicals. |
| Phytogenics | Phytogenics are a group of natural and non-antibiotic growth promoters derived from herbs, spices, essential oils, and oleoresins. |
| Vitamins | Vitamins are organic compounds, which are required for normal growth and maintenance of the body. |
| Metabolism | A chemical process that occurs within a living organism in order to maintain life. |
| Amino acids | Amino acids are the building blocks of proteins and play an important role in metabolic pathways. |
| Enzymes | Enzyme is a substance that acts as a catalyst to bring about a specific biochemical reaction. |
| Anti-microbial resistance | The ability of a microorganism to resist the effects of an antimicrobial agent. |
| Anti-microbial | Destroying or inhibiting the growth of microorganisms. |
| Osmotic balance | It is a process of maintaining salt and water balance across membranes within the body's fluids. |
| Bacteriocin | Bacteriocins are the toxins produced by bacteria to inhibit the growth of similar or closely related bacterial strains. |
| Biohydrogenation | It is a process that occurs in the rumen of an animal in which bacteria convert unsaturated fatty acids (USFA) to saturated fatty acids (SFA). |
| Oxidative rancidity | It is a reaction of fatty acids with oxygen, which generally causes unpleasant odors in animals. To prevent these, antioxidants were added. |
| Mycotoxicosis | Any condition or disease caused by fungal toxins, mainly due to contamination of animal feed with mycotoxins. |
| Mycotoxins | Mycotoxins are toxin compounds that are naturally produced by certain types of molds (fungi). |
| Feed Probiotics | Microbial feed supplements positively affect gastrointestinal microbial balance. |
| Probiotic yeast | Feed yeast (single-cell fungi) and other fungi used as probiotics. |
| Feed enzymes | They are used to supplement digestive enzymes in an animal’s stomach to break down food. Enzymes also ensure that meat and egg production is improved. |
| Mycotoxin detoxifiers | They are used to prevent fungal growth and to stop any harmful mold from being absorbed in the gut and blood. |
| Feed antibiotics | They are used both for the prevention and treatment of diseases but also for rapid growth and development. |
| Feed antioxidants | They are used to protect the deterioration of other feed nutrients in the feed such as fats, vitamins, pigments, and flavoring agents, thus providing nutrient security to the animals. |
| Feed phytogenics | Phytogenics are natural substances, added to livestock feed to promote growth, aid in digestion, and act as anti-microbial agents. |
| Feed vitamins | They are used to maintain the normal physiological function and normal growth and development of animals. |
| Feed flavors and sweetners | These flavors and sweeteners help to mask tastes and odors during changes in additives or medications and make them ideal for animal diets undergoing transition. |
| Feed acidifiers | Animal feed acidifiers are organic acids incorporated into the feed for nutritional or preservative purposes. Acidifiers enhance congestion and microbiological balance in the alimentary and digestive tracts of livestock. |
| Feed minerals | Feed minerals play an important role in the regular dietary requirements of animal feed. |
| Feed binders | Feed binders are the binding agents used in the manufacture of safe animal feed products. It enhances the taste of food and prolongs the storage period of the feed. |
| Key Terms | Abbreviation |
| LSDV | Lumpy Skin Disease Virus |
| ASF | African Swine Fever |
| GPA | Growth Promoter Antibiotics |
| NSP | Non-Starch Polysaccharides |
| PUFA | Polyunsaturated Fatty Acid |
| Afs | Aflatoxins |
| AGP | Antibiotic Growth Promoters |
| FAO | The Food And Agriculture Organization of the United Nations |
| USDA | The United States Department of Agriculture |


Research Methodology
Mordor Intelligence follows a four-step methodology in all our reports.
- Step-1: IDENTIFY KEY VARIABLES: In order to build a robust forecasting methodology, the variables and factors identified in Step-1 are tested against available historical market numbers. Through an iterative process, the variables required for market forecast are set and the model is built on the basis of these variables.
- Step-2: Build a Market Model: Market-size estimations for the forecast years are in nominal terms. Inflation is not a part of the pricing, and the average selling price (ASP) is kept constant throughout the forecast period.
- Step-3: Validate and Finalize: In this important step, all market numbers, variables and analyst calls are validated through an extensive network of primary research experts from the market studied. The respondents are selected across levels and functions to generate a holistic picture of the market studied.
- Step-4: Research Outputs: Syndicated Reports, Custom Consulting Assignments, Databases & Subscription Platforms


