Market Overview
| Study Period | 2018 - 2031 |
|---|---|
| Forecast Data Period | 2026 - 2031 |
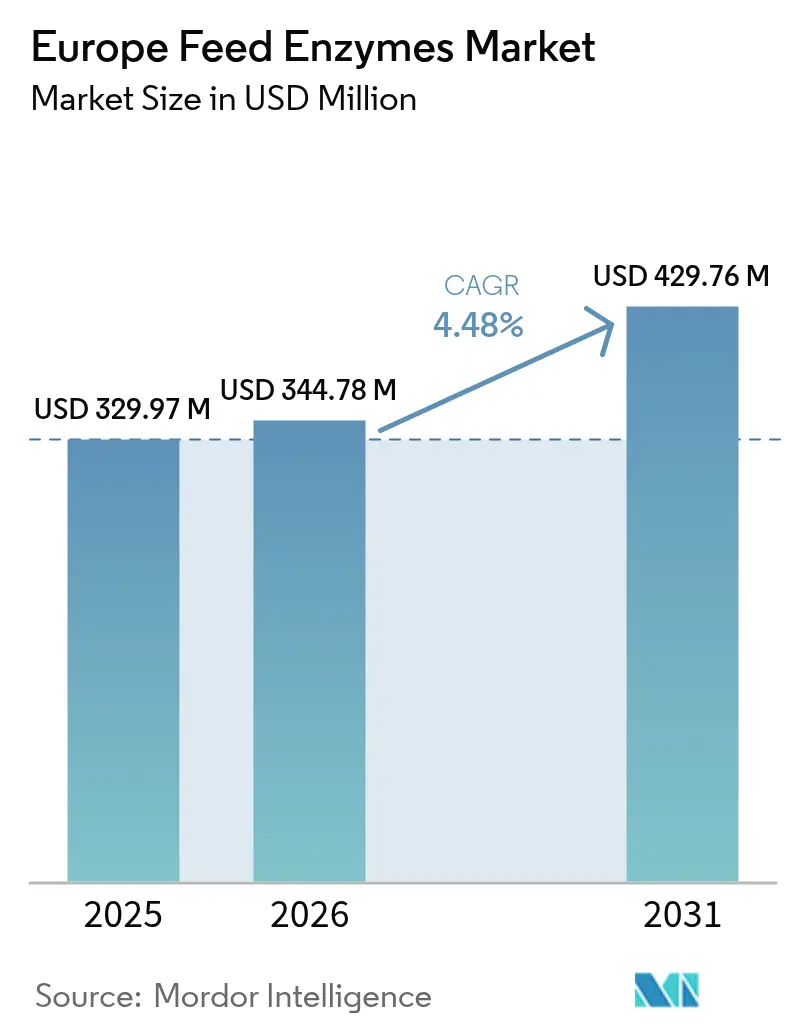
| Base Year Market Size (2025) | USD 329.97 Million |
| Market Size (2026) | USD 344.78 Million |
| Market Size (2031) | USD 429.76 Million |
| Growth Rate (2026 - 2031) | 4.48% CAGR |
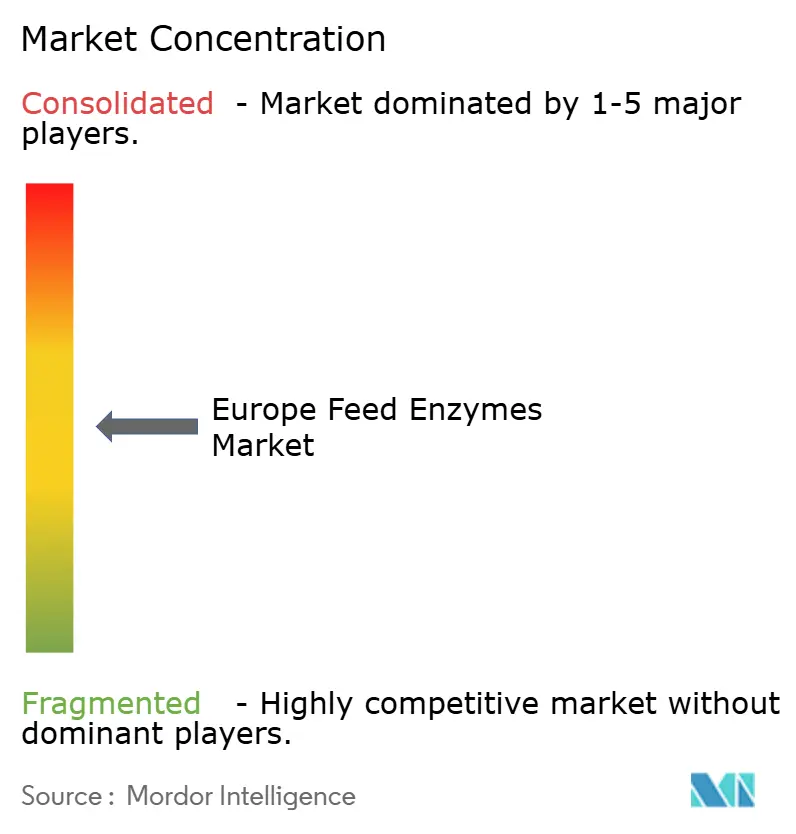
| Market Concentration | Medium |
Major Players
*Disclaimer: Major Players sorted in no particular order Image © Mordor Intelligence. Reuse requires attribution under CC BY 4.0. |
|
Europe Feed Enzymes Market Analysis by Mordor Intelligence
The Europe feed enzymes market size was valued at USD 329.97 million in 2025 and estimated to grow from USD 344.78 million in 2026 to reach USD 429.76 million by 2031, at a CAGR of 4.48% during the forecast period (2026-2031). Industrial livestock operators are accelerating enzyme adoption to comply with the European Union’s post-2022 antibiotic restrictions, to temper high feed-grain costs, and to meet retailer demands for verifiable carbon-footprint reduction. Carbohydrases dominate current demand because cereal-heavy formulations require fiber-breaking activity for optimal digestibility. Precision-fermentation breakthroughs are reducing novel enzyme production costs by roughly 30% and enabling species-specific blends that improve performance across poultry, swine, and emerging insect-protein systems. Although corn and wheat volatility squeezes producer margins, steady growth in Central and Eastern European (CEE) broiler capacity and the roll-out of carbon labels by major retailers underpin robust long-term demand.
Key Report Takeaways
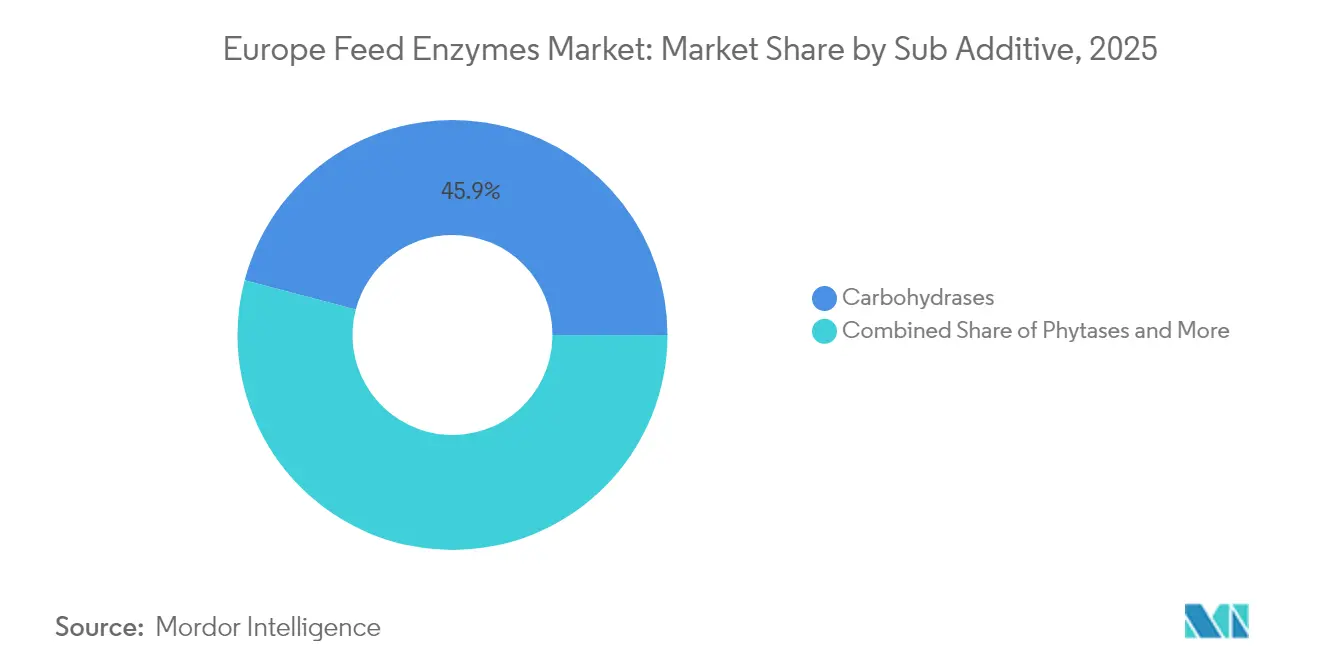
- By sub-additive, Carbohydrases led with 45.90% of the Europe feed enzymes market share in 2025, and are forecast to expand at a 4.41% CAGR through 2031.
- By animal, Poultry held 34.25% of the Europe feed enzymes market revenue share in 2025, and the swine segment is advancing at a 4.78% CAGR to 2031.
- By geography, Spain led with 15.08% of the Europe feed enzymes market revenue share in 2025, and the United Kingdom is poised for a 5.12% CAGR through 2031.
Note: Market size and forecast figures in this report are generated using Mordor Intelligence’s proprietary estimation framework, updated with the latest available data and insights as of 2026.
Europe Feed Enzymes Market Trends and Insights
Drivers Impact Analysis*
| Driver | (~) % Impact on CAGR Forecast | Geographic Relevance | Impact Timeline |
|---|---|---|---|
| EU Ban on Prophylactic Antibiotics Drives Enzyme Substitution | +1.2% | Europe-wide, strongest in Germany, Netherlands, Denmark | Short term (≤ 2 years) |
| Escalating Feed Input Prices Push Demand for Nutrient-Efficiency Solutions | +0.8% | Europe-wide, acute in Central and Eastern Europe | Medium term (2-4 years) |
| Carbon-Footprint Labeling Pressure from Retailers and Regulators | +0.6% | Western Europe, led by Germany, France, Netherlands | Long term (≥ 4 years) |
| Accelerated Industrial Poultry Expansion in Central and Eastern Europe | +0.7% | Poland, Romania, Hungary, Czech Republic | Medium term (2-4 years) |
| Growth of Insect-Protein Farming Requires Tailor-Made Enzyme Blends | +0.3% | Netherlands, France, Germany, early adoption markets | Long term (≥ 4 years) |
| Advances in Precision-Fermentation Unlock Cost-Effective Novel Enzymes | +0.5% | Europe-wide, concentrated in biotech hubs | Medium term (2-4 years) |
| Source: Mordor Intelligence | |||


EU Ban on Prophylactic Antibiotics Drives Enzyme Substitution
The complete prohibition of prophylactic antibiotics in livestock feed, enforced across the European Union in January 2022, removed an estimated 8,000 metric tons of antibiotic growth promoters from circulation and created an immediate performance gap that enzymes now fill. Poultry and swine integrators in Brittany, Lower Saxony, and Catalonia reacted by lifting enzyme inclusion rates 15–20%, translating into added outlays of EUR 2–3 per metric ton (USD 2.1–3.2 per metric ton) of finished feed. The rapid response underscores the indispensability of enzymes for maintaining feed-conversion ratios without sacrificing animal health. The European Food Safety Authority (EFSA) qualified presumption-of-safety status for main enzyme classes simplified formulation changes, curtailing reformulation lead times. Because antibiotic restrictions are non-negotiable and uniformly enforced, the resulting demand is structural and largely shielded from cyclical economic swings. The policy also pushes formulators toward multi-enzyme cocktails that tackle fiber, protein, and phytate simultaneously, further broadening unit volumes. With no reversal of the ban in sight, enzymes have become an integral pillar of European feed strategies and a durable growth engine for the European feed enzymes market.
Escalating Feed Input Prices Push Demand for Nutrient-Efficiency Solutions
European wheat averaged EUR 280 per metric ton (USD 298 per metric ton) and corn EUR 250 per metric ton (USD 266 per metric ton) in 2024, up 25% on the prior year. This inflation amplified interest in enzymes that unlock bound nutrients and curb over-formulation. Phytase, for example, can boost phosphorus digestibility by 60–80%, cutting inorganic phosphate supplementation that costs EUR 1,200 per metric ton (USD 1,278 per metric ton). Central and Eastern European (CEE) integrators, especially in Poland and Romania, have raised enzyme spending 12% annually to preserve profit margins, reasoning that a EUR 0.50–1.00 per metric ton (USD 0.53–1.06 per metric ton) enzyme cost can yield EUR 2–4 per metric ton (USD 2.1–4.3 per metric ton) grain savings. The logic holds even during downturns because enzyme cost is small relative to the total ration value. As European protein producers continue navigating commodity volatility, feed-conversion optimization through enzyme technology remains a financially compelling hedge, cementing its role within the European feed enzymes market.
Carbon-Footprint Labeling Pressure from Retailers and Regulators
Major grocers such as Carrefour, Tesco, and REWE now request cradle-to-gate emission data that include feed additives, prompting livestock suppliers to favor enzymes that measurably cut methane and ammonia emissions. Studies show carbohydrases can trim enteric methane by 8–12% and elevate nitrogen-use efficiency by 15–20%. These performance attributes directly serve the EU Farm-to-Fork objective of halving agricultural emissions by 2030. German and Dutch producers illustrate early adoption, lifting enzyme inclusion 18% since 2024 to secure eco-labels necessary for premium placement. Because carbon labels increasingly shape procurement contracts and consumer choice, environmental differentiation has graduated from value-added to must-have. Consequently, enzymes offering documented emission reductions enjoy a pricing premium and surge in volume demand, further propelling the European feed enzymes market.
Accelerated Industrial Poultry Expansion in Central and Eastern Europe
Poland, Romania, Hungary, and the Czech Republic added 2.8 million metric tons of annual broiler capacity since 2024. New turnkey complexes adopt best-in-class nutrition, embedding enzymes from day one to guarantee export-grade efficiency and compliance. Broiler operations in Hungary already dose 0.8–1.2 kg enzyme per metric ton of feed, outpacing the continental average of 0.6 kg. Exports provide an additional boost to the Polish shipments to Germany grew by 22% in 2024, increasing efficiency requirements to align with sustainability protocols in the destination country. The build-out supplies a dependable, high-volume customer base for enzyme suppliers and balances slowing growth in saturated Western Europe. As further capacity comes online, especially in swine and turkey, the CEE corridor cements its status as the fastest-growing regional node in the European feed enzymes market.
Restraints Impact Analysis*
| Restraint | (~) % Impact on CAGR Forecast | Geographic Relevance | Impact Timeline |
|---|---|---|---|
| Persistent Volatility of Cereal Substrate Prices for Enzyme Fermentation | -0.4% | Europe-wide, acute in fermentation hubs | Short term (≤ 2 years) |
| Slow Product Registration Timelines in Southern EU Member States | -0.3% | Italy, Spain, Portugal, Greece | Medium term (2-4 years) |
| Consumer Concerns Against GMO-Derived Feed Inputs | -0.2% | Germany, Austria, France, organic segments | Long term (≥ 4 years) |
| Consolidation of Integrators Squeezing Supplier Margins | -0.3% | Europe-wide, concentrated in major markets | Medium term (2-4 years) |
| Source: Mordor Intelligence | |||
Persistent Volatility of Cereal Substrate Prices for Enzyme Fermentation
Corn and wheat account for 40–60% of fermentation media, and 2024 prices ranged between EUR 200 and EUR 280 per metric ton (USD 213–298 per metric ton)[1]Source: European Commission, “Market Observatories – Crops,” ec.europa.eu. Because feed-enzyme contracts typically lock pricing six months ahead, surges erode margins swiftly. Biofuel refiners, armed with blending mandates and hedging capacity, often outbid enzyme producers for the same substrates, intensifying supply pressure. Danish and German plants revealed cost spikes near 20% at price peaks, forcing selective production curtailments to protect the Earnings Before Interest, Taxes, Depreciation, and Amortization (EBITDA). Smaller firms with limited balance-sheet strength face existential risk unless they pre-contract grain or diversify to non-cereal substrates. Fermentation substrate costs can represent 40-60% of total enzyme production expenses, making enzyme pricing highly sensitive to agricultural commodity cycles[2]Source: Tanpong, Sirisak, "Citric Acid By-Product Fermentation by Bacillus subtilis I9: A Promising Path to Sustainable Animal Feed," doi.org..
Slow Product Registration Timelines in Southern EU Member States
Even after securing the European Food Safety Authority (EFSA) approval, novel enzymes require individual notifications or translations in Italy, Spain, Portugal, and Greece, prolonging launch windows by six to nine months. The fragmented process elevates regulatory costs and delays revenue capture. Mid-tier innovators cite expenditures of EUR 0.3 million (USD 0.32 million) for multilingual dossiers covering these four markets. Extended timelines deter the roll-out of niche or low-volume enzymes, limiting portfolio depth available to local feed mills. The lag suppresses competitive diversity, concentrating sales among incumbents with the resources to navigate bureaucracy.
*Our forecasts treat driver/restraint impacts as directional, not additive. The impact forecasts reflect baseline growth, mix effects, and variable interactions.
Segment Analysis
By Sub-Additive: Carbohydrases Lead Fiber-Digestion Efficiency
Carbohydrases captured 45.90% of 2025 revenue, underlining their primacy in degrading non-starch polysaccharides typical of cereal-rich European rations. The sub-segment is projected to expand at a 4.41% CAGR, mirroring growth in wheat and barley inclusion rates prompted by high corn prices. Within this cohort, xylanase and beta-glucanase combinations deliver 3–5% feed-conversion improvements, making them staples in broiler and turkey diets. Phytases remain indispensable for unlocking bound phosphorus, enabling formulators to trim costly inorganic phosphate usage. Precision-fermentation breakthroughs allow producers to bundle carbohydrase, protease, and phytase in thermostable granules, augmenting value per kilogram sold.
The other enzymes, though smaller in value, outpace the segment with niche solutions such as chitinase for insect-protein diets and novel proteases that target heat-damaged soy fractions. Costs for these enzymes have declined since 2024. As feed mills continue experimenting with rapeseed, sunflower, and by-product meals, the European feed enzymes market size for customized multi-action products is set to grow swiftly, rewarding innovators capable of rapid formulation tweaks.


By Animal: Poultry Dominates, Swine Accelerates
Poultry generated 34.25% of 2025 enzyme sales as broiler integrators consumed 267.8 million metric tons of feed that year. The European feed enzymes market size for poultry is reinforced by short production cycles that magnify the financial impact of even fractional feed-conversion gains. Broilers account for the bulk, while layer operations boost usage to curb phosphorus emissions from manure, aligning with nitrate directives in Germany and the Netherlands.
Swine, forecast at 4.78% CAGR through 2031, looks set to narrow the gap. The post-antibiotic landscape prompted swine producers to elevate enzyme inclusion 18% since 2022, emphasizing phytase and carbohydrase to enhance cereal digestibility. Ruminant uptake remains limited by rumen pH variability, yet high-yielding dairy herds experiment with encapsulated fibrolytic enzymes, aiming for incremental milk-yield gains. Aquaculture, though minor in absolute terms, posts double-digit growth as European salmon and trout farms adopt enzyme strategies to reduce feed waste and meet coastal nutrient-discharge limits, ensuring broad-based demand across the European feed enzymes market.

Geography Analysis
Spain retained 15.08% of the European feed enzymes market share in 2025, leveraging its integrated pork and poultry industries to secure volumes in both carbohydrase and phytase categories. Local integrators shifted toward wheat- and barley-heavy rations to hedge corn risk, raising reliance on xylanase blends. Energy and logistics advantages further encourage enzymes that enhance feed density, sustaining Spain’s leadership. The United Kingdom, forecast at 5.12% CAGR, emerges as the momentum market. Post-Brexit policy incentives favor domestic protein, and rising import costs for soybean meal spur interest in rapeseed and field-pea co-products that require bespoke enzyme support.
Western Europe constitutes the mature core of the European feed enzymes market, accounting for over half of the revenue. Central and Eastern Europe delivers the fastest aggregate growth, driven by competitive land and labor costs that attract investment in world-scale broiler and hog complexes. Polish feed-conversion targets mirror those in Western Europe, prompting enzyme adoption to reach parity levels within three years. Romania benefits from EU rural-development funds that partially subsidize feed additive upgrades, propelling enzyme uptake. Hungary’s expanding turkey industry anchors demand for multi-enzyme packages customized for mixed wheat and corn diets. Northern Europe, led by Denmark and Sweden, integrates enzymes into sustainability programs focused on nitrogen efficiency and antibiotic stewardship. Southern Europe exhibits varied performance: Spain benefits from integrator scale, while Italy and Greece face minor setbacks due to extended product registration timelines, delaying the availability of next-generation variants. Overall, the widespread regulatory harmonization and shared decarbonization objectives ensure steady growth across all sub-regions, reinforcing the continent-wide relevance of the Europe feed enzymes market.
Competitive Landscape
The competitive landscape remains moderately fragmented, with the top five suppliers accounting for a significant share of revenue in 2024. This fragmentation leaves substantial room for specialist players. Novonesis Group is driven by ongoing enhancements to its Ronozyme portfolio and strong integration with premix partner. Brenntag SE leverages its extensive distribution network to promote various brands and provide value-added formulation support.
Mid-sized contenders such as AB Vista Limited, Nutrex NV, and Huvepharma AD contest niche territories by offering customized blends tailored to local grain profiles or production philosophies. Entry barriers include the European Food Safety Authority (EFSA) dossier costs, fermentation scalability, and the ability to offer non-GMO variants without price blowouts.
Strategic plays in 2022 include BASF SE USD 90 million phytase capacity expansion in Germany to secure supply for Europe and export clients. At the same time, Cargill’s Dutch research hub highlights the growing role of nutrition analytics in enzyme optimization. These developments demonstrate a dual approach of achieving economies of scale for mainstream products while retaining flexibility for customized solutions. Both are vital to capturing the evolving opportunities in the European feed enzymes market.
Europe Feed Enzymes Industry Leaders
-
BASF SE
-
Brenntag SE
-
IFF(Danisco Animal Nutrition)
-
Archer-Daniels-Midland Company
-
Novonesis Group
- *Disclaimer: Major Players sorted in no particular order

Recent Industry Developments
- February 2025: Novonesis announced the acquisition of DSM-Firmenich’s stake in the Feed Enzyme Alliance for EUR 1.5 billion (USD 1.6 billion). The deal aims to unify production, R&D, and commercial operations under Novonesis, significantly boosting its global position in feed enzyme innovation
- September 2024: DSM-Firmenich (in partnership with Novonesis) received European Union authorization for its next-generation phytase, HiPhorius. The product is approved for use in poultry, swine, and fish, enabling better phosphorous utilization to lower costs and reduce environmental pollution.
- June 2024: IFF has secured EU-wide regulatory approval for two of its advanced poultry feed solutions, Axtra XAP and Syncra AVI. The two solutions are designed to address key challenges in modern poultry production, focusing on improved efficiency and bird health.


Europe Feed Enzymes Market Report Scope
Sub Additive
| Carbohydrases |
| Phytases |
| Other Enzymes |
Animal
| Aquaculture | Fish |
| Shrimp | |
| Other Aquaculture Species | |
| Poultry | Broiler |
| Layer | |
| Other Poultry Birds | |
| Ruminants | Beef Cattle |
| Dairy Cattle | |
| Other Ruminants | |
| Swine | |
| Other Animals |
Geography
| France |
| Germany |
| Italy |
| Netherlands |
| Russia |
| Spain |
| Turkey |
| United Kingdom |
| Rest of Europe |
| Sub Additive | Carbohydrases | |
| Phytases | ||
| Other Enzymes | ||
| Animal | Aquaculture | Fish |
| Shrimp | ||
| Other Aquaculture Species | ||
| Poultry | Broiler | |
| Layer | ||
| Other Poultry Birds | ||
| Ruminants | Beef Cattle | |
| Dairy Cattle | ||
| Other Ruminants | ||
| Swine | ||
| Other Animals | ||
| Geography | France | |
| Germany | ||
| Italy | ||
| Netherlands | ||
| Russia | ||
| Spain | ||
| Turkey | ||
| United Kingdom | ||
| Rest of Europe | ||


Market Definition
- FUNCTIONS - For the study, feed additives are considered to be commercially manufactured products that are used to enhance characteristics such as weight gain, feed conversion ratio, and feed intake when fed in appropriate proportions.
- RESELLERS - Companies engaged in reselling feed additives without value addition have been excluded from the market scope, to avoid double counting.
- END CONSUMERS - Compound feed manufacturers are considered to be end-consumers in the market studied. The scope excludes farmers buying feed additives to be used directly as supplements or premixes.
- INTERNAL COMPANY CONSUMPTION - Companies engaged in the production of compound feed as well as the manufacturing of feed additives are part of the study. However, while estimating the market sizes, the internal consumption of feed additives by such companies has been excluded.
| Keyword | Definition |
|---|---|
| Feed additives | Feed additives are products used in animal nutrition for purposes of improving the quality of feed and the quality of food from animal origin, or to improve the animals’ performance and health. |
| Probiotics | Probiotics are microorganisms introduced into the body for their beneficial qualities. (It maintains or restores beneficial bacteria to the gut). |
| Antibiotics | Antibiotic is a drug that is specifically used to inhibit the growth of bacteria. |
| Prebiotics | A non-digestible food ingredient that promotes the growth of beneficial microorganisms in the intestines. |
| Antioxidants | Antioxidants are compounds that inhibit oxidation, a chemical reaction that produces free radicals. |
| Phytogenics | Phytogenics are a group of natural and non-antibiotic growth promoters derived from herbs, spices, essential oils, and oleoresins. |
| Vitamins | Vitamins are organic compounds, which are required for normal growth and maintenance of the body. |
| Metabolism | A chemical process that occurs within a living organism in order to maintain life. |
| Amino acids | Amino acids are the building blocks of proteins and play an important role in metabolic pathways. |
| Enzymes | Enzyme is a substance that acts as a catalyst to bring about a specific biochemical reaction. |
| Anti-microbial resistance | The ability of a microorganism to resist the effects of an antimicrobial agent. |
| Anti-microbial | Destroying or inhibiting the growth of microorganisms. |
| Osmotic balance | It is a process of maintaining salt and water balance across membranes within the body's fluids. |
| Bacteriocin | Bacteriocins are the toxins produced by bacteria to inhibit the growth of similar or closely related bacterial strains. |
| Biohydrogenation | It is a process that occurs in the rumen of an animal in which bacteria convert unsaturated fatty acids (USFA) to saturated fatty acids (SFA). |
| Oxidative rancidity | It is a reaction of fatty acids with oxygen, which generally causes unpleasant odors in animals. To prevent these, antioxidants were added. |
| Mycotoxicosis | Any condition or disease caused by fungal toxins, mainly due to contamination of animal feed with mycotoxins. |
| Mycotoxins | Mycotoxins are toxin compounds that are naturally produced by certain types of molds (fungi). |
| Feed Probiotics | Microbial feed supplements positively affect gastrointestinal microbial balance. |
| Probiotic yeast | Feed yeast (single-cell fungi) and other fungi used as probiotics. |
| Feed enzymes | They are used to supplement digestive enzymes in an animal’s stomach to break down food. Enzymes also ensure that meat and egg production is improved. |
| Mycotoxin detoxifiers | They are used to prevent fungal growth and to stop any harmful mold from being absorbed in the gut and blood. |
| Feed antibiotics | They are used both for the prevention and treatment of diseases but also for rapid growth and development. |
| Feed antioxidants | They are used to protect the deterioration of other feed nutrients in the feed such as fats, vitamins, pigments, and flavoring agents, thus providing nutrient security to the animals. |
| Feed phytogenics | Phytogenics are natural substances, added to livestock feed to promote growth, aid in digestion, and act as anti-microbial agents. |
| Feed vitamins | They are used to maintain the normal physiological function and normal growth and development of animals. |
| Feed flavors and sweetners | These flavors and sweeteners help to mask tastes and odors during changes in additives or medications and make them ideal for animal diets undergoing transition. |
| Feed acidifiers | Animal feed acidifiers are organic acids incorporated into the feed for nutritional or preservative purposes. Acidifiers enhance congestion and microbiological balance in the alimentary and digestive tracts of livestock. |
| Feed minerals | Feed minerals play an important role in the regular dietary requirements of animal feed. |
| Feed binders | Feed binders are the binding agents used in the manufacture of safe animal feed products. It enhances the taste of food and prolongs the storage period of the feed. |
| Key Terms | Abbreviation |
| LSDV | Lumpy Skin Disease Virus |
| ASF | African Swine Fever |
| GPA | Growth Promoter Antibiotics |
| NSP | Non-Starch Polysaccharides |
| PUFA | Polyunsaturated Fatty Acid |
| Afs | Aflatoxins |
| AGP | Antibiotic Growth Promoters |
| FAO | The Food And Agriculture Organization of the United Nations |
| USDA | The United States Department of Agriculture |


Research Methodology
Mordor Intelligence follows a four-step methodology in all our reports.
- Step-1: IDENTIFY KEY VARIABLES: In order to build a robust forecasting methodology, the variables and factors identified in Step-1 are tested against available historical market numbers. Through an iterative process, the variables required for market forecast are set and the model is built on the basis of these variables.
- Step-2: Build a Market Model: Market-size estimations for the forecast years are in nominal terms. Inflation is not a part of the pricing, and the average selling price (ASP) is kept constant throughout the forecast period.
- Step-3: Validate and Finalize: In this important step, all market numbers, variables and analyst calls are validated through an extensive network of primary research experts from the market studied. The respondents are selected across levels and functions to generate a holistic picture of the market studied.
- Step-4: Research Outputs: Syndicated Reports, Custom Consulting Assignments, Databases & Subscription Platforms


