Market Overview
| Study Period | 2020 - 2031 |
|---|---|
| Forecast Data Period | 2026 - 2031 |
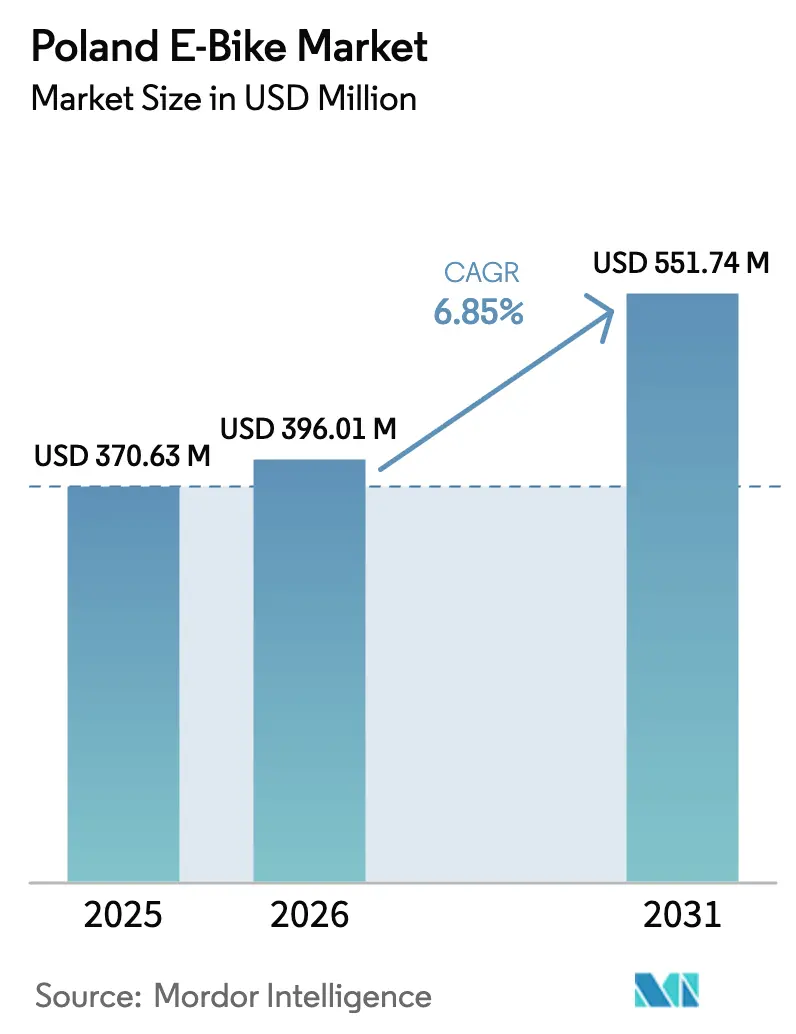
| Base Year Market Size (2025) | USD 370.63 Million |
| Market Size (2026) | USD 396.01 Million |
| Market Size (2031) | USD 551.74 Million |
| Growth Rate (2026 - 2031) | 6.85% CAGR |
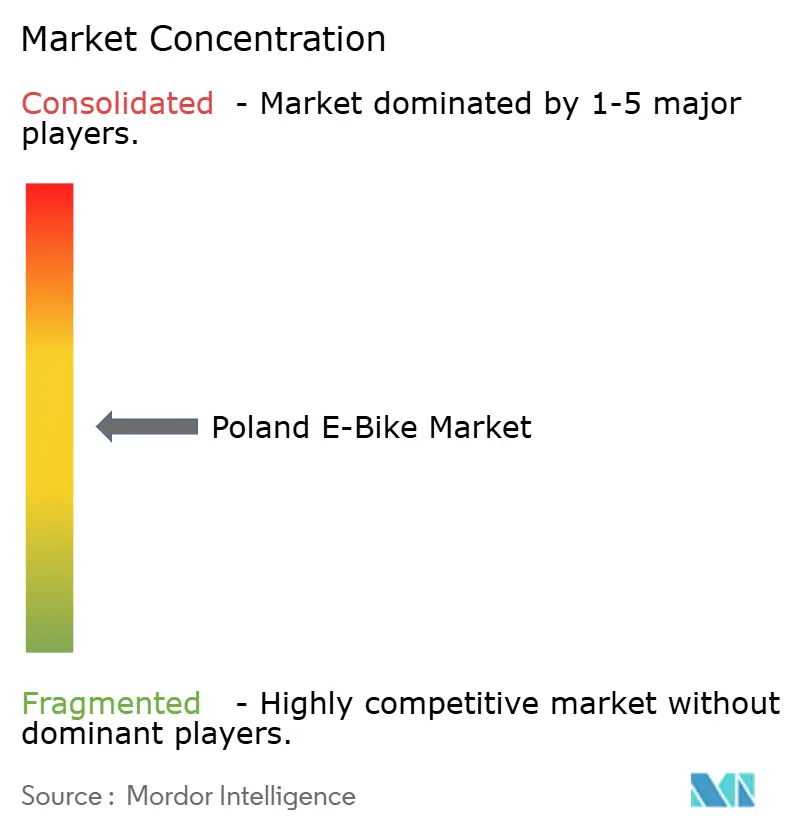
| Market Concentration | Medium |
Major Players*Disclaimer: Major Players sorted in no particular order Image © Mordor Intelligence. Reuse requires attribution under CC BY 4.0. |
|
Poland E-Bike Market Analysis by Mordor Intelligence
Poland E-Bike market size in 2026 is estimated at USD 396.01 million, growing from 2025 value of USD 370.63 million with 2031 projections showing USD 551.74 million, growing at 6.85% CAGR over 2026-2031. This trajectory stems from rising urban congestion charges, a PLN 300 million (USD 81.77 million) national subsidy program, and Poland’s emergence as an intra-EU battery production hub. Pedal-assisted models dominate sales today, yet speed pedelecs, cargo platforms, and mid-drive powertrains record the sharpest upticks as commuters, logistics fleets, and corporate leasing schemes search for agile, low-emission alternatives.
Key Report Takeaways
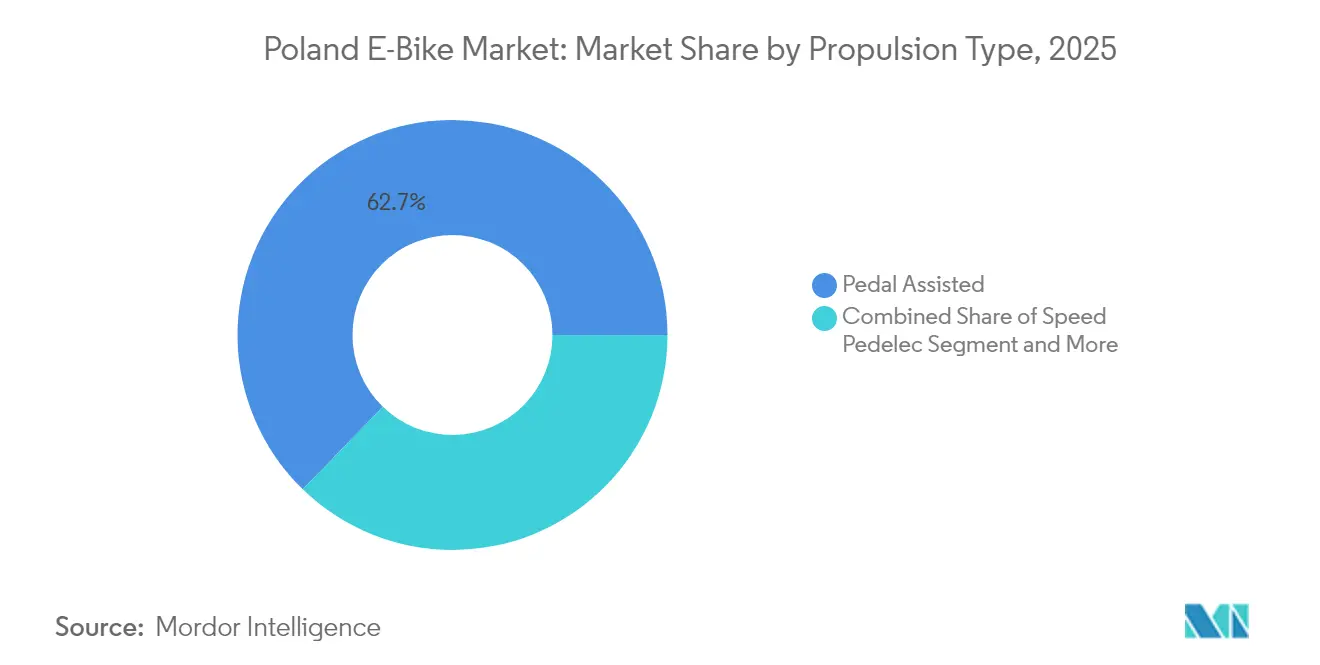
- By propulsion type, pedal-assisted bicycles commanded 62.74% of the Poland e-bike market share in 2025, whereas speed pedelecs are on track for a 14.35% CAGR through 2031.
- By application type, city/urban e-bikes held the largest share at 48.73% of the Poland e-bike market in 2025, while cargo/utility models are projected to grow fastest with a 16.92% CAGR over 2026–2031.
- By battery type, lithium-ion models dominated the Poland e-bike market with an 81.65% share in 2025, and the segment is expected to expand further at a 12.88% CAGR through 2031.
- By motor placement, hub motors accounted for 70.62% of the Poland e-bike market in 2025, whereas mid-drive systems are forecast to grow at a robust 13.54% CAGR during 2026–2031.
- By drive system, chain-driven e-bikes represented 87.74% of the Poland e-bike market in 2025, while belt-drive models are anticipated to post the highest growth at a 15.66% CAGR through 2031.
- By motor power, e-bikes with less than 250 W output captured 56.64% of the Poland e-bike market in 2025, whereas those in the 351–500 W range are expected to grow fastest at a 15.08% CAGR over 2026–2031.
- By price band, models priced between USD 1,500–2,499 accounted for 33.78% of the Poland e-bike market in 2025, while the USD 2,500–3,499 range is projected to record a 11.76% CAGR through 2031.
- By sales channel, offline distribution dominated the Poland e-bike market with a 63.42% share in 2025, whereas online sales are projected to expand rapidly at a 13.97% CAGR during 2026–2031.
- By end use, personal and family e-bikes comprised 45.88% of the Poland e-bike market in 2025, while commercial delivery applications are expected to grow fastest with an 17.55% CAGR through 2031.
Note: Market size and forecast figures in this report are generated using Mordor Intelligence’s proprietary estimation framework, updated with the latest available data and insights as of 2026.
Poland E-Bike Market Trends and Insights
Drivers Impact Analysis*
| Driver | (~) % Impact on CAGR Forecast | Geographic Relevance | Impact Timeline |
|---|---|---|---|
| Urban Congestion-Reduction Policies | +1.2% | Warsaw, Kraków, Gdańsk metro areas | Medium term (2-4 years) |
| Cycling Tourism Growth in Mazury and Sudetes | +1.1% | Northern and southwestern regions | Long term (≥ 4 years) |
| Clean Transport Act Subsidy Program | +0.9% | National, urban concentration | Short term (≤ 2 years) |
| Corporate Bike-Leasing Tax Incentives | +0.8% | National, business centers | Medium term (2-4 years) |
| Food-Delivery Platform Expansion | +0.7% | Large and secondary cities | Short term (≤ 2 years) |
| EU Battery-Recycling Targets | +0.5% | National compliance requirement | Long term (≥ 4 years) |
| Source: Mordor Intelligence | |||
Urban Congestion-Reduction Policies Drive Modal Shift
Poland's metropolitan areas implement intelligent transport systems that create measurable efficiency gains, with Warsaw's TRISTAR system reducing waiting times by 20% and Wrocław's smart lighting reducing accidents by 15%[1]"State of EU progress to climate neutrality," European Climate Neutrality Observatory, ecologic.eu.. These improvements paradoxically increase e-bike attractiveness by demonstrating municipal commitment to alternative mobility while highlighting persistent congestion in areas beyond ITS coverage. Warsaw's population density of 3,444 residents per square kilometer creates natural demand for space-efficient transport, where e-bikes occupy 90% less parking space than cars. The city's Urban Mobility Readiness Index reveals infrastructure gaps that municipal planners address through dedicated cycling lane expansion, creating protected corridors that reduce e-bike accident risk by approximately 40% compared to mixed-traffic routes. Corporate fleets increasingly adopt e-bikes for short-distance business travel, recognizing 15-minute average trip times versus 25-minute car journeys in congested city centers.
Subsidy Program Accelerates Consumer Adoption
The "Mój rower elektryczny" program's PLN 300 million allocation through 2029 represents Poland's largest direct consumer incentive for electric mobility, offering subsidies covering up to 50% of purchase price for qualifying models. Program design favors cargo e-bikes with PLN 9,000 maximum (USD 2,453) subsidies versus PLN 5,000 (USD 1,363) for standard models, signaling policy preference for commercial applications that reduce urban freight vehicle trips. The subsidy structure requires domestic assembly or significant local content, benefiting Polish manufacturers like Kross S.A. and Romet while encouraging international brands to establish local production partnerships. Application processing through digital platforms reduces administrative friction compared to automotive EV incentives, enabling faster market response to policy signals. Early program uptake data suggests consumer preference for mid-range models in the PLN 4,000 (USD 1,090) to 8,000 (USD 2,180) price band, where subsidies provide maximum purchasing power leverage for quality improvements over entry-level alternatives.
Corporate Bike-Leasing Tax Benefits Create B2B Demand
Polish tax regulations enable companies to deduct bicycle costs as business expenses while employees avoid fringe benefit taxation, creating effective subsidies of 19-32% depending on corporate tax rates. This mechanism proves particularly attractive for service companies seeking ESG credentials and employee wellness benefits without significant cash outlays. Leasing companies like LeaseLink, part of a Warsaw Stock Exchange-listed capital group, report 15-minute online approval processes that streamline corporate procurement compared to traditional fleet vehicle acquisition. Corporate adoption patterns favor higher-specification models with extended warranties and service packages, creating premium segment demand that supports manufacturer margin expansion. The tax advantage structure encourages 3-year lease terms that align with typical e-bike battery replacement cycles, ensuring corporate fleets maintain current technology standards.
Food Delivery Platform Expansion Drives Commercial Segment
Poland's position as Europe's out-of-home delivery leader, with InPost commanding approximately 50% market share, creates infrastructure foundations that support e-bike logistics expansion. Projections indicate a significant increase in OOH (Out-of-home) parcels across EU markets by 2027, with Poland's advanced pickup point network reducing last-mile delivery costs that favor e-bike economics over van-based distribution. Food delivery platforms leverage e-bikes for orders within 5-kilometer radii, where battery range and cargo capacity constraints align with optimal delivery zone economics. The sector's growth creates professional e-bike operator demand for models with enhanced durability, weather protection, and cargo capacity that exceed consumer specifications. Platform operators increasingly provide e-bikes to delivery personnel, shifting purchase decisions from individual contractors to fleet managers who prioritize total cost of ownership over initial purchase price.
Restraints Impact Analysis*
| Restraint | (~) % Impact on CAGR Forecast | Geographic Relevance | Impact Timeline |
|---|---|---|---|
| Fragmented Charging-Plug Standards | -0.6% | National, interoperability hurdle | Medium term (2-4 years) |
| Higher VAT on E-Bikes than Public Transport | -0.5% | National tax policy | Short term (≤ 2 years) |
| Retail Credit Tightening for Discretionary | -0.3% | Nationwide, lower-income cohorts | Short term (≤ 2 years) |
| Skilled-Mechanic Shortage Outside Tier-1 | -0.2% | Secondary cities and rural areas | Long term (≥ 4 years) |
| Source: Mordor Intelligence | |||
Fragmented Charging Standards Limit Infrastructure Investment
Poland's e-bike charging infrastructure development faces technical fragmentation where manufacturers employ proprietary connector designs that prevent standardized public charging deployment[2]"CHARGING INFRASTRUCTURE ELECTROMOBILITY," DKE – VDE Association for Electrical, Electronic & Information Technologies, dke.de. European standards bodies recognize this challenge through EN 15194:2017 for electrically power-assisted cycles, yet implementation varies across brands and battery suppliers. The absence of universal charging standards increases infrastructure deployment costs for municipalities and private operators who must accommodate multiple connector types or limit compatibility to specific brands. This fragmentation particularly affects shared mobility schemes and workplace charging installations where multi-brand compatibility determines user adoption rates. German technical guidelines recommend Mode 3 charging stations with integrated safety features over household socket solutions, but Polish deployment lags due to uncertain return on investment from fragmented user bases.
Skilled Mechanic Shortage Constrains Service Network Expansion
Poland's e-bike service infrastructure concentrates in major cities, with rural and secondary market coverage gaps that limit adoption among consumers requiring reliable maintenance access. E-bike complexity requires computer diagnostic capabilities beyond traditional bicycle mechanics, with specialized training for Bosch, Shimano, and other motor systems that smaller shops cannot economically justify. Service pricing reflects this scarcity, with e-bike inspections commanding PLN 450 to 500 (USD 125 - 136), including diagnostics, compared to PLN 250 to 350 (USD 68 - 95) for conventional bicycles. The shortage creates customer hesitation in areas beyond major metropolitan centers, where service availability uncertainty outweighs e-bike performance advantages for risk-averse consumers.
*Our forecasts treat driver/restraint impacts as directional, not additive. The impact forecasts reflect baseline growth, mix effects, and variable interactions.
Segment Analysis
By Propulsion Type: Speed Pedelecs Accelerate Despite Regulatory Complexity
Speed pedelecs represents a smaller segment compared to pedal-assisted models that command 62.74% market share in 2025, and capture the fastest growth trajectory at 14.35% CAGR through 2031. This acceleration reflects urban commuter demand for higher-speed options that compete effectively with public transport for medium-distance trips, particularly in metropolitan areas where 5-15 kilometer commutes predominate. Throttle-assisted models occupy a niche position due to European regulatory restrictions that limit their classification as bicycles, requiring registration and insurance, which reduces consumer appeal compared to pedal-assisted alternatives.
The propulsion segment evolution demonstrates technology convergence where manufacturers integrate multiple assistance modes within single platforms, enabling users to switch between pedal-assist and higher-speed operation based on traffic conditions and legal requirements. Romet's 2025 product lineup exemplifies this trend through Bosch Performance Line CX integration across multiple model categories, providing 85 Nm torque output that supports both urban commuting and recreational applications. Speed pedelec adoption correlates with corporate bike-leasing programs where tax advantages offset higher purchase prices and insurance requirements, creating B2B demand that drives segment growth beyond individual consumer preferences.


By Application Type: Cargo Utility Segment Transforms Urban Logistics
City/urban models held 48.73% market share in 2025, and cargo/utility applications emerge as the fastest-growing segment at 16.92% CAGR, reflecting structural shifts in last-mile delivery economics and municipal freight policies. This growth trajectory aligns with Poland's leadership in out-of-home delivery infrastructure, where approximately 15 pickup points per 10,000 residents create dense networks that favor e-bike logistics over traditional van-based distribution. Trekking/mountain applications serve recreational markets in regions like Mazury and Sudetes, where cycling tourism expansion drives demand for higher-specification models with enhanced battery capacity and off-road capabilities.
The application segmentation reveals consumer preference evolution where utility considerations increasingly influence purchase decisions over purely recreational factors. Poland's "Mój rower elektryczny" subsidy program reinforces this trend through higher incentives for cargo models, encouraging commercial adoption that reduces urban freight vehicle trips. Corporate fleets adopt cargo e-bikes for service calls and short-distance freight, recognizing operational cost advantages in congested urban environments where parking availability and access restrictions favor two-wheeled solutions over conventional vehicles.
By Battery Type: Lithium-Ion Dominance Reinforced by Local Production
Lithium-ion batteries maintain a commanding 81.65% market share in 2025 while sustaining a 12.88% CAGR through 2031, supported by local production capabilities through BMZ Poland partnerships that enable customized battery configurations ranging from 480 Wh to 820 Wh capacity. Lead acid and alternative battery technologies occupy declining market positions due to weight penalties and limited cycle life that compromise e-bike performance characteristics. The EU Battery Regulation 2023/1542 implementation creates compliance requirements for battery passports and recycling targets that favor established lithium-ion supply chains over alternative chemistries with less developed circular economy infrastructure.
ElevenEs' planned lithium iron phosphate gigafactory investment in Poland signals strategic positioning for domestic battery production that reduces import dependency and supply chain risks. This development enables Polish e-bike manufacturers to optimize battery specifications for local market conditions, including cold-weather performance requirements and integration with domestic charging infrastructure standards. The battery segment consolidation around lithium-ion technology simplifies service network requirements and reduces inventory complexity for retailers and service providers.
By Motor Placement: Mid-Drive Systems Gain Traction Through Performance Advantages
Hub motors maintaining 70.62% market share in 2025, however mid-drive motors achieve 13.54% CAGR growth through 2031, reflecting consumer recognition of performance advantages in varied terrain conditions common across Poland's diverse geography. Mid-drive positioning provides superior weight distribution and gear integration that enhances climbing performance in mountainous regions like the Sudetes, where cycling tourism expansion drives demand for higher-capability systems. Hub motor prevalence reflects cost advantages and installation simplicity that appeal to urban commuters prioritizing reliability over performance optimization.
The motor placement evolution demonstrates technology maturation where manufacturers offer both configurations within product lines to address diverse consumer preferences and price points. Romet's 2025 lineup includes Bosch Performance Line CX mid-drive systems alongside Bafang hub motor alternatives, enabling market segmentation based on intended use and budget constraints. Mid-drive adoption correlates with premium segment growth, where consumers prioritize performance characteristics over initial cost considerations, particularly in corporate bike-leasing programs where tax advantages offset higher purchase prices.

By Drive Systems: Belt Drive Innovation Challenges Chain Dominance
Chain drive held 87.74% market share in 2025, while belt drive systems accelerate at 15.66% CAGR through 2031, representing a technology disruption that addresses maintenance concerns, particularly relevant in Poland's harsh winter conditions. Gates carbon belt integration in premium models like Romet's E-Modeco 4.0 NX Di2 eliminates chain lubrication requirements and extends service intervals, appealing to urban commuters seeking low-maintenance solutions. Belt drive adoption faces cost barriers and limited gear ratio options that constrain market penetration despite operational advantages.
The drive system segmentation reflects broader industry trends toward reduced maintenance requirements that align with corporate fleet preferences and urban mobility demands. Belt drive integration with electronic shifting systems like Shimano Nexus Di2 creates premium positioning that justifies higher prices through operational cost savings over product lifecycles. This technology convergence particularly appeals to corporate bike-leasing programs where maintenance cost predictability influences total cost of ownership calculations.
By Motor Power: Mid-Range Power Bands Capture Growth
Sub-250W motors maintain 56.64% market share in 2025, while the 351 to 500W motor power segment achieves 15.08% CAGR through 2031, reflecting consumer demand for enhanced performance within European regulatory frameworks that classify higher-power systems as mopeds requiring registration. This power band expansion enables manufacturers to optimize performance for specific applications, with cargo e-bikes benefiting from higher torque output for load-carrying capability. The 251-350W and 501-600W segments serve intermediate markets where consumers balance performance requirements against regulatory complexity and cost considerations.
Motor power segmentation demonstrates regulatory influence on market development, where European standards limit bicycle classification to 250W nominal power, creating artificial market boundaries that manufacturers navigate through peak power optimization and torque delivery strategies. Polish consumers increasingly recognize power rating limitations of nominal specifications, focusing on torque output and real-world performance characteristics that determine climbing ability and acceleration in urban traffic conditions.
By Price Band: Premium Segments Accelerate Through Value Recognition
The USD 1,500 to 2,499 range accounts 33.78% market share in 2025, while the USD 2,500 to 3,499 price band emerges as the fastest-growing segment at 11.76% CAGR through 2031, indicating consumer willingness to invest in higher-specification models that provide enhanced performance and durability. This premium migration reflects subsidy program influence, incentives enable consumers to access higher-quality models within affordable price ranges. The sub-USD 1,000 segment faces quality concerns documented by local mechanics who report safety issues with low-cost imports that require extensive repairs or replacement within short timeframes.
Price band evolution demonstrates market maturation where consumers prioritize total cost of ownership over initial purchase price, recognizing that premium models offer superior component quality, warranty coverage, and service network access. Corporate bike-leasing programs particularly favor mid-range to premium segments where tax advantages and operational reliability justify higher monthly payments compared to personal purchase alternatives.
By Sales Channel: Online Growth Accelerates Despite Service Concerns
Offline channels maintain a 63.42% market share in 2025 while online sales channels achieve a 13.97% CAGR through 2031, reflecting digital adoption acceleration during the pandemic period and continued consumer preference for physical inspection before purchase. Online growth faces constraints from consumer concerns about assembly quality and service access, with local mechanics reporting frequent issues from DIY assembly, including incorrect pedal installation and brake adjustment errors. Established retailers like CentrumRowerowe.pl address these concerns through showroom networks in Gdańsk, Warsaw, and Wrocław, combined with 24-hour delivery and professional assembly services.
The sales channel evolution demonstrates omnichannel strategies where retailers integrate online ordering with physical service networks to capture digital convenience while maintaining quality control. Kross S.A. exemplifies this approach through direct-to-consumer online sales combined with extensive dealer networks that provide local service and support capabilities. Online channel growth correlates with corporate procurement preferences, where B2B buyers prioritize specification comparison and bulk ordering capabilities over individual product inspection.

By End Use: Commercial Delivery Segment Transforms Market Dynamics
Personal and family use maintains 45.88% market share in 2025 while commercial delivery applications achieve 17.55% CAGR through 2031, reflecting structural shifts in urban logistics and last-mile delivery economics. This growth trajectory aligns with Poland's advanced out-of-home delivery infrastructure, where InPost's creates dense pickup networks that favor e-bike logistics over traditional van-based distribution. Service providers and institutional segments serve specialized markets, including maintenance, healthcare, and municipal services, where e-bikes provide cost-effective mobility solutions in congested urban environments.
The end-use segmentation reveals demand diversification beyond traditional recreational cycling toward utility applications that generate higher usage intensity and replacement frequency. Commercial operators prioritize durability, cargo capacity, and service network access over aesthetic considerations that influence personal purchases, creating distinct market segments with different value propositions and competitive dynamics. Food and beverage delivery specifically drives cargo e-bike adoption, where operators recognize operational cost advantages and regulatory benefits compared to motorized alternatives in city center environments.
Competitive Landscape
Competition is moderately concentrated: local leaders Kross, Romet, and ECOBIKE share the podium with multinationals such as Giant and Trek that rely on import distributors. Kross expanded Desiknio premium assembly lines under a partnership with Swiss firm MyStromer in 2024, adding carbon belt models to its Polish catalog. Romet refreshed 80% of its range for 2025, slotting Bosch Performance Line CX drives into gravel and SUV frames.
Global brands differentiate through high-end carbon frames and proprietary app ecosystems but concede volume segments to agile domestic lines that enjoy subsidy-linked content rules. ElevenEs’ forthcoming LFP gigafactory and DT Swiss’s suspension expansion in Poland highlight rising upstream integration that may recalibrate sourcing economics in favor of homegrown players.
White-space opportunities persist in after-sales franchising beyond tier-1 cities. Independent workshops backed by leasing firms could lock in annuity-style revenue and raise switching costs, suggesting an emergent service-based battleground rather than pure hardware rivalry.
Poland E-Bike Industry Leaders
-
Accell Group
-
Giant Manufacturing Co. Ltd
-
Kross SA
-
Merida Industry Co. Ltd
-
ECOBIKE Sp. z o.o.
- *Disclaimer: Major Players sorted in no particular order

Recent Industry Developments
- September 2025: ElevenEs announces EUR 600 million investment in lithium iron phosphate battery gigafactory in Poland, competing with Hungary for European battery manufacturing leadership. The facility will supply automotive and e-bike markets, potentially transforming Poland's position in the electric mobility supply chain and reducing import dependency for local manufacturers.
- February 2024: MyStromer AG shifts production for Spanish sister brand Desiknio Bikes to Poland, with all models now painted and assembled by Kross S.A. in Przasnysz. This partnership demonstrates Poland's growing role as a European e-bike manufacturing hub and Kross S.A.'s expansion into premium segment assembly services.


Poland E-Bike Market Report Scope
Pedal Assisted, Speed Pedelec, Throttle Assisted are covered as segments by Propulsion Type. Cargo/Utility, City/Urban, Trekking are covered as segments by Application Type. Lead Acid Battery, Lithium-ion Battery, Others are covered as segments by Battery Type.
By Propulsion Type
| Pedal Assisted |
| Speed Pedelec |
| Throttle Assisted |
By Application Type
| Cargo/Utility |
| City/Urban |
| Trekking/Mountain |
By Battery Type
| Lead Acid Battery |
| Lithium-ion Battery |
| Others |
By Motor Placement
| Hub (front/rear) |
| Mid-drive |
By Drive Systems
| Chain Drive |
| Belt Drive |
By Motor Power
| Less than 250 W |
| 251 to 350 W |
| 351 to 500 W |
| 501 to 600 W |
| More than 600 W |
By Price Band (USD)
| Up to 1,000 |
| 1,000 to 1,499 |
| 1,500 to 2,499 |
| 2,500 to 3,499 |
| 3,500 to 5,999 |
| Above 6,000 |
By Sales Channel
| Online |
| Offline |
By End Use
| Commercial Delivery | Retail and Goods Delivery |
| Food and Beverage Delivery | |
| Service Providers | |
| Personal and Family Use | |
| Institutional | |
| Others |
| By Propulsion Type | Pedal Assisted | |
| Speed Pedelec | ||
| Throttle Assisted | ||
| By Application Type | Cargo/Utility | |
| City/Urban | ||
| Trekking/Mountain | ||
| By Battery Type | Lead Acid Battery | |
| Lithium-ion Battery | ||
| Others | ||
| By Motor Placement | Hub (front/rear) | |
| Mid-drive | ||
| By Drive Systems | Chain Drive | |
| Belt Drive | ||
| By Motor Power | Less than 250 W | |
| 251 to 350 W | ||
| 351 to 500 W | ||
| 501 to 600 W | ||
| More than 600 W | ||
| By Price Band (USD) | Up to 1,000 | |
| 1,000 to 1,499 | ||
| 1,500 to 2,499 | ||
| 2,500 to 3,499 | ||
| 3,500 to 5,999 | ||
| Above 6,000 | ||
| By Sales Channel | Online | |
| Offline | ||
| By End Use | Commercial Delivery | Retail and Goods Delivery |
| Food and Beverage Delivery | ||
| Service Providers | ||
| Personal and Family Use | ||
| Institutional | ||
| Others | ||


Market Definition
- By Application Type - E-bikes considered under this segment include city/urban, trekking, and cargo/utility e-bikes. The common types of e-bikes under these three categories include off-road/hybrid, kids, ladies/gents, cross, MTB, folding, fat tire, and sports e-bike.
- By Battery Type - This segment includes lithium-ion batteries, lead-acid batteries, and other battery types. The other battery type category includes nickel-metal hydroxide (NiMH), silicon, and lithium-polymer batteries.
- By Propulsion Type - E-bikes considered under this segment include pedal-assisted e-bikes, throttle-assisted e-bikes, and speed pedelec. While the speed limit of pedal and throttle-assisted e-bikes is usually 25 km/h, the speed limit of speed pedelec is generally 45 km/h (28 mph).
| Keyword | Definition |
|---|---|
| Pedal Assisted | Pedal-assist or pedelec category refers to the electric bikes that provide limited power assistance through torque-assist system and do not have throttle for varying the speed. The power from the motor gets activated upon pedaling in these bikes and reduces human efforts. |
| Throttle Assisted | Throttle-based e-bikes are equipped with the throttle assistance grip, installed on the handlebar, similarly to motorbikes. The speed can be controlled by twisting the throttle directly without the need to pedal. The throttle response directly provides power to the motor installed in the bicycles and speeds up the vehicle without paddling. |
| Speed Pedelec | Speed pedelec is e-bikes similar to pedal-assist e-bikes as they do not have throttle functionality. However, these e-bikes are integrated with an electric motor which delivers power of approximately 500 W and more. The speed limit of such e-bikes is generally 45 km/h (28 mph) in most of the countries. |
| City/Urban | The city or urban e-bikes are designed with daily commuting standards and functions to be operated within the city and urban areas. The bicycles include various features and specifications such as comfortable seats, sit upright riding posture, tires for easy grip and comfortable ride, etc. |
| Trekking | Trekking and mountain bikes are special types of e-bikes that are designed for special purposes considering the robust and rough usage of the vehicles. These bicycles include a strong frame, and wide tires for better and advanced grip and are also equipped with various gear mechanisms which can be used while riding in different terrains, rough grounded, and tough mountainous roads. |
| Cargo/Utility | The e-cargo or utility e-bikes are designed to carry various types of cargo and packages for shorter distances such as within urban areas. These bikes are usually owned by local businesses and delivery partners to deliver packages and parcels at very low operational costs. |
| Lithium-ion Battery | A Li-ion battery is a rechargeable battery, which uses lithium and carbon as its constituent materials. The Li-Ion batteries have a higher density and lesser weight than sealed lead acid batteries and provide the rider with more range per charge than other types of batteries. |
| Lead Acid Battery | A lead acid battery refers to sealed lead acid battery having a very low energy-to-weight and energy-to-volume ratio. The battery can produce high surge currents, owing to its relatively high power-to-weight ratio as compared to other rechargeable batteries. |
| Other Batteries | This includes electric bikes using nickel–metal hydroxide (NiMH), silicon, and lithium-polymer batteries. |
| Business-to-Business (B2B) | The sales of e-bikes to business customers such as urban fleet and logistics company, rental/sharing operators, last-mile fleet operators, and corporate fleet operators are considered under this category. |
| Business-to-Customers (B2C) | The sales of electric scooters and motorcycles to direct consumers is considered under this category. The consumers acquire these vehicles either directly from manufacturers or from other distributers and dealers through online and offline channel. |
| Unorganized Local OEMs | These players are small local manufacturers and assemblers of e-bikes. Most of these manufacturers import the components from China and Taiwan and assemble them locally. They offer the product at low cost in this price sensitive market which give them advantage over organized manufacturers. |
| Battery-as-a-Service | A business model in which the battery of an EV can be rented from a service provider or swapped with another battery when it runs out of charge |
| Dockless e-Bikes | Electric bikes that have self-locking mechanisms and a GPS tracking facility with an average top speed of around 15mph. These are mainly used by bike-sharing companies such as Bird, Lime, and Spin. |
| Electric Vehicle | A vehicle which uses one or more electric motors for propulsion. Includes cars, scooters, buses, trucks, motorcycles, and boats. This term includes all-electric vehicles and hybrid electric vehicles |
| Plug-in EV | An electric vehicle that can be externally charged and generally includes all-electric vehicles as well as plug-in hybrids. In this report we use the term for all-electric vehicles to differentiate them from plug-in hybrid electric vehicles. |
| Lithium-Sulphur Battery | A rechargeable battery that replaces the liquid or polymer electrolyte found in current lithium-ion batteries with sulfur. They have more capacity than Li-ion batteries. |
| Micromobility | Micromobility is one of the many modes of transport involving very-light-duty vehicles to travel short distances. These means of transportation include bikes, e-scooters, e-bikes, mopeds, and scooters. Such vehicles are used on a sharing basis for covering short distances, usually five miles or less. |
| Low Speed Electric Vehicls (LSEVs) | They are low speed (usually less than 25 kmph) light vehicles that do not have an internal combustion engine, and solely use electric energy for propulsion. |


Research Methodology
Mordor Intelligence follows a four-step methodology in all its reports.
- Step-1: Identify Key Variables: To build a robust forecasting methodology, the variables and factors identified in Step-1 are tested against available historical market numbers. Through an iterative process, the variables required for market forecast are set and the model is built based on these variables.
- Step-2: Build a Market Model: Market-size estimations for the historical and forecast years have been provided in revenue and volume terms. Market revenue is calculated by multiplying the volume demand with volume-weighted average battery pack price (per kWh). Battery pack price estimation and forecast takes into account various factors affecting ASP, such as inflation rates, market demand shifts, production costs, technological developments, and consumer preferences, providing estimations for both historical data and future trends.
- Step-3: Validate and Finalize: In this important step, all market numbers, variables, and analyst calls are validated through an extensive network of primary research experts from the market studied. The respondents are selected across levels and functions to generate a holistic picture of the market studied.
- Step-4: Research Outputs: Syndicated Reports, Custom Consulting Assignments, Databases & Subscription Platforms


