Europe Domestic Courier Market Size and Share
Market Overview
| Study Period | 2018 - 2031 |
|---|---|
| Forecast Data Period | 2026 - 2031 |
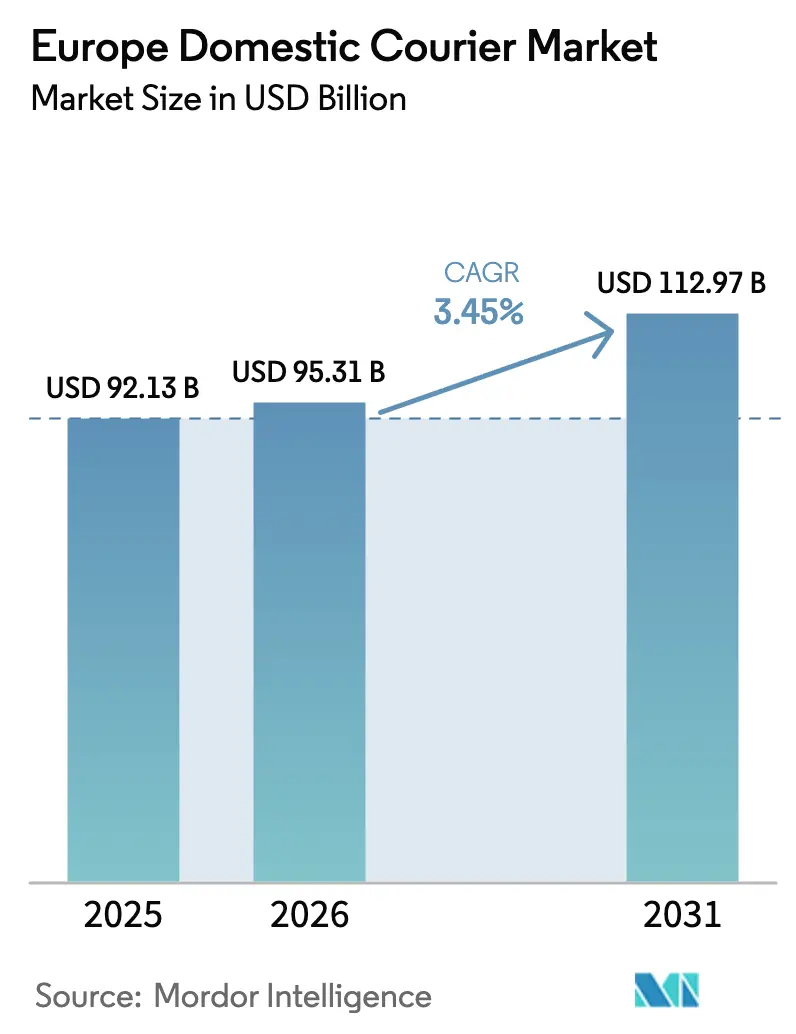
| Base Year Market Size (2025) | USD 92.13 Billion |
| Market Size (2026) | USD 95.31 Billion |
| Market Size (2031) | USD 112.97 Billion |
| Growth Rate (2026 - 2031) | 3.45% CAGR |
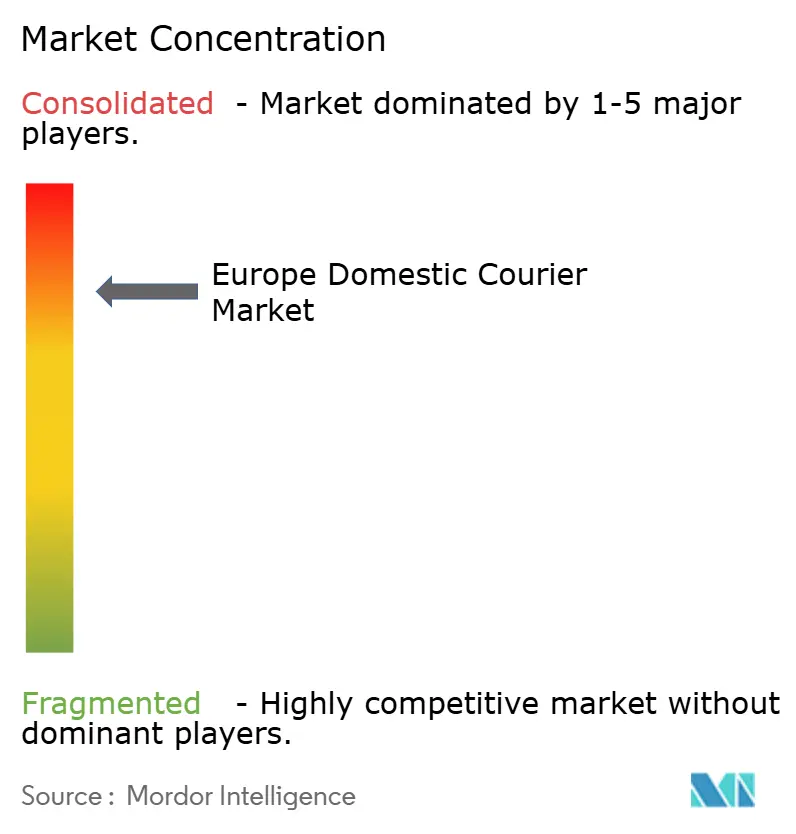
| Market Concentration | High |
Major Players *Disclaimer: Major Players sorted in no particular order Image © Mordor Intelligence. Reuse requires attribution under CC BY 4.0. | |
Europe Domestic Courier Market Analysis by Mordor Intelligence
Europe domestic courier market size in 2026 is estimated at USD 95.31 billion, growing from 2025 value of USD 92.13 billion with 2031 projections showing USD 112.97 billion, growing at 3.45% CAGR over 2026-2031. This headline growth rests on parcel-volume momentum from e-commerce, structural shifts toward electric fleets, and resilient demand from specialized sectors such as healthcare. Network operators continue to capture economies of scale by densifying routes, yet rising labor costs and stricter emission regulations pressure operating margins. Consolidation accelerates as postal incumbents partner with technology-led entrants to balance capacity shortages with digital routing efficiencies. Meanwhile, Eastern European countries outpace mature Western counterparts, reflecting infrastructure upgrades and rapid digital-commerce adoption.
Key Report Takeaways
- By speed of delivery, non-express services held 76.20% of the Europe domestic courier market share in 2025, while express services are projected to grow at a 4.12% CAGR between 2026-2031.
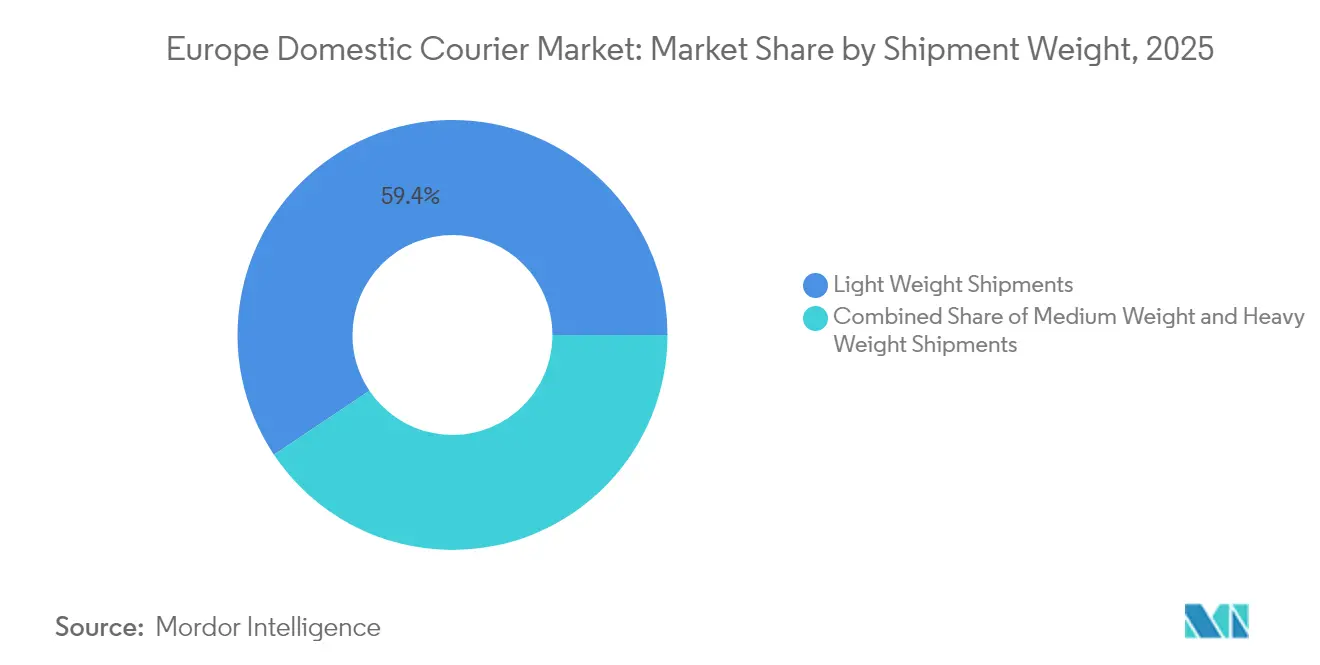
- By shipment weight, light parcels accounted for 59.40% of the Europe domestic courier market size in 2025, whereas heavy parcels are set to expand at a 3.62% CAGR between 2026 and 2031.
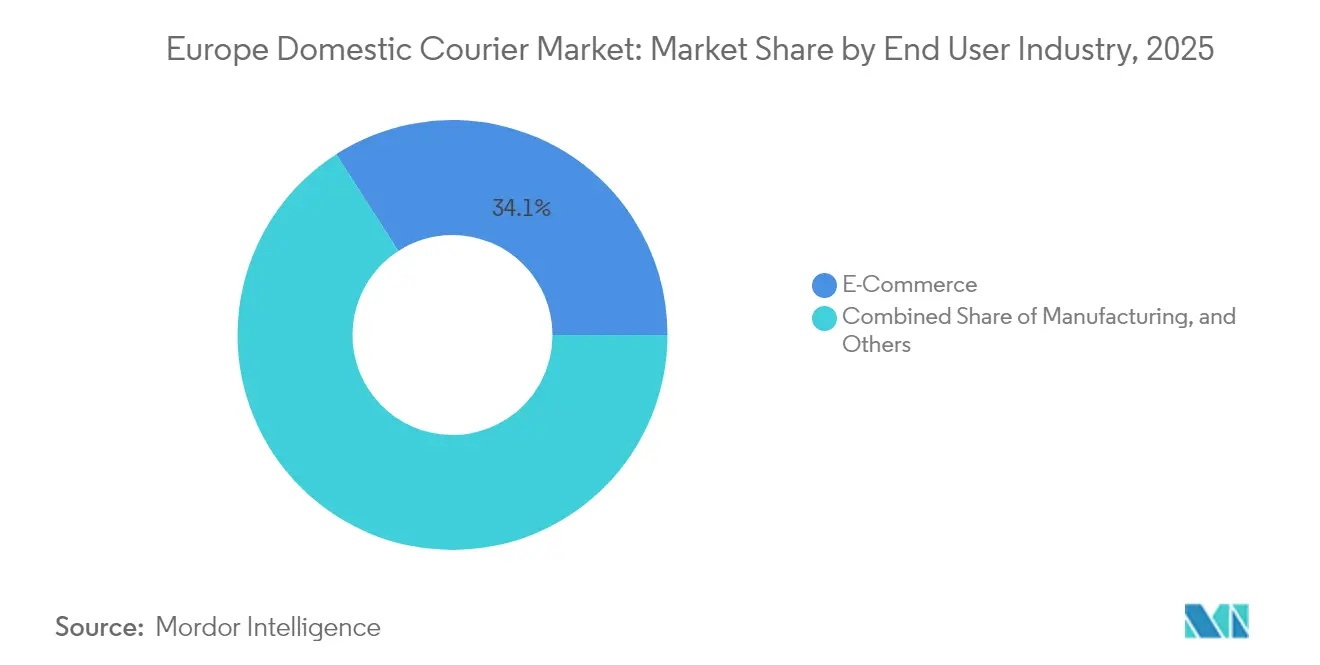
- By end user industry, e-commerce led with 34.10% of the revenue share in 2025; healthcare deliveries register the fastest 3.74% CAGR between 2026-2031.
- By model, the business-to-consumer (B2C) segment represented 47.90% of the revenue share in 2025, yet consumer-to-consumer (C2C) shipments post the highest 3.92% CAGR between 2026-2031.
- By geography, Poland captured 3.20% share in 2025, whereas Bulgaria is forecast to achieve a 3.67% CAGR over 2026-2031.
Note: Market size and forecast figures in this report are generated using Mordor Intelligence’s proprietary estimation framework, updated with the latest available data and insights as of 2026.
Europe Domestic Courier Market Trends and Insights
Drivers Impact Analysis*
| Driver | (~) % Impact on CAGR Forecast | Geographic Relevance | Impact Timeline |
|---|---|---|---|
| Rapid e-commerce parcel-volume surge sustains network density | 1.2% | Global, with concentration in Western Europe urban centers | Short term (≤ 2 years) |
| Demand for same-day and on-demand urban delivery | 0.8% | Major European cities, particularly London, Paris, Berlin | Medium term (2-4 years) |
| Growth of out-of-home (parcel-locker and PUDO) networks | 0.9% | Northern and Central Europe, expanding to Southern markets | Medium term (2-4 years) |
| EU Green Deal incentives accelerating electric and cargo-bike fleets | 0.6% | EU27 markets, strongest in Netherlands, Germany, France | Long term (≥ 4 years) |
| Postal-operator liberalization unlocking white-label partnerships | 0.4% | Central and Eastern Europe, selective Western markets | Long term (≥ 4 years) |
| AI-powered dynamic routing lowering congestion-zone fees | 0.3% | Urban centers with LEZ/ULEZ implementations | Short term (≤ 2 years) |
| Source: Mordor Intelligence | |||
Rapid E-Commerce Parcel-Volume Surge Sustains Network Density
Cross-border shopping inflows lifted intra-EU parcel volumes 23% in 2024, reinforcing scale advantages for integrated networks. Black Friday peaks pushed daily volumes up to 40% above baseline, tightening hub capacity yet confirming the structural shift toward parcel-first supply chains. Operators able to align domestic and cross-border flows continue to reduce stop-per-parcel costs. The trend’s durability now hinges on consumer tolerance for flexible delivery windows during peak weeks, a compromise already visible in Western Europe’s largest metros[1]“E-commerce Statistics for Individuals,” European Commission, ec.europa.eu .
Demand for Same-Day and On-Demand Urban Delivery
End-customers in dense cities increasingly opt for premium windows under four hours, prompting networks to add micro-fulfillment centers inside emission zones. Cargo-bike fleets and electrified vans gain favor because they avoid daily LEZ fees and shorten stop times, although cost recovery remains viable mainly for high-value SKUs. Operators respond by co-locating dark stores with parcel lockers to blend speed and pick-up convenience. The model’s scalability outside tier-1 cities depends on real-estate economics and sustained consumer willingness to pay[2]“European Green Deal,” European Commission, ec.europa.eu.
Growth of Out-of-Home (Parcel-Locker and PUDO) Networks
InPost processed 1 billion parcels through 27,000 lockers across nine countries in 2024. Locker uptake trims last-mile cost 30–40% versus home delivery and slashes failed-attempt rates. Open-network initiatives, such as multi-carrier locker sharing in Germany and Poland, further lift utilization. Yet the capital intensity of dense locker grids favors well-funded operators; smaller couriers often piggyback via white-label partnerships rather than build proprietary assets.
EU Green Deal Incentives Accelerating Electric and Cargo-Bike Fleets
EU legislation phases out tail-pipe emissions on urban delivery vehicles by 2035, steering fleet investments toward battery vans and cargo bikes. DHL already fields 17,000 electric bikes across Europe, citing 90% emission cuts on last-mile runs. Early movers gain cost relief through fee exemptions in low-emission zones and faster curb access. The hurdle: charging infrastructure coverage, which still lags in secondary cities, prolonging diesel fleet life cycles and capping immediate scale.
Restraints Impact Analysis*
| Restraint | (~) % Impact on CAGR Forecast | Geographic Relevance | Impact Timeline |
|---|---|---|---|
| Driver shortages and rising labor costs | -0.7% | Pan-European, acute in Germany, UK, Netherlands | Short term (≤ 2 years) |
| Stringent urban emission and access regulations | -0.5% | Major European cities with LEZ/ULEZ zones | Medium term (2-4 years) |
| Saturation in mature Western markets slows parcel-volume growth | -0.4% | Western Europe core markets | Long term (≥ 4 years) |
| Packaging-waste directives increase compliance complexity | -0.3% | EU27 markets under PPWR regulations | Medium term (2-4 years) |
| Source: Mordor Intelligence | |||
Driver Shortages and Rising Labor Costs
An estimated 426,000 driver vacancies in 2024 constrain delivery capacity and elevate wages by 8–12% across primary markets. High-density city routes require additional pay premiums, lifting hourly costs to EUR 25–30 in London and Zurich. Autonomous delivery pilots and route-optimization efforts partially offset shortages yet demand significant capital. Smaller operators increasingly outsource middle-mile legs to 3PLs, pushing consolidation as scale becomes a prerequisite for labor bargaining power[3]“Shortage of Truck Drivers in the EU,” European Commission, transport.ec.europa.eu.
Stringent Urban Emission and Access Regulations
More than 320 European cities levy daily charges of EUR 12.50-25 on non-compliant vehicles, creating immediate margin erosion for diesel-heavy fleets. Upcoming zero-emission zones will fully exclude internal-combustion vans during business hours, accelerating fleet renewals. Compliance complexity rises because municipalities adopt distinct standards and exemption rules, obliging sophisticated fleet-management tools. Operators with early electric investments gain a structural cost edge, whereas laggards face capex spikes and route realignments[4]“Low Emission Zones: Main Findings,” European Environment Agency, eea.europa.eu.
*Our forecasts treat driver/restraint impacts as directional, not additive. The impact forecasts reflect baseline growth, mix effects, and variable interactions.
Segment Analysis
By End User Industry: Healthcare Gains Momentum
Healthcare occupies a growing niche, expanding at a 3.74% CAGR between 2026-2031 due to temperature-controlled pharmaceutical and medical-device flows. UPS boosted its European cold-chain footprint 40% in 2024 with new sites across Germany, Netherlands, and Poland. These additions reinforce network credibility for 2–8 °C and sub-zero products, an area where standard parcel players lack certification depth. E-commerce still leads overall value at 34.10% share in 2025; however, volume growth moderates in mature economies as consumers transition toward consolidated deliveries and out-of-home pick-ups. Manufacturing and wholesale trade remain steady contributors, sustaining mid-weight B2B shipments essential for base-load density. Circular-economy returns sit within the Others segment; they register steady double-digit growth as EU eco-design rules extend product lifecycles. Consequently, operators diversify service portfolios to capture both high-value healthcare flows and high-volume retail parcels, ensuring fleet and facility flexibility.
Europe domestic courier market operators invest in GDP-compliant warehouses and real-time temperature monitoring to meet healthcare audit requirements. Simultaneously, omnichannel retailers demand weekend and after-hours delivery, prompting networks to stretch operational windows without escalating cost per stop. Added complexity raises the entry barrier, consolidating share among networks with multi-temperature expertise and automated sort centers that switch between healthcare and standard volumes. As supply chains regionalize post-pandemic, Poland and the Benelux corridor emerge as central medical hubs, further concentrating healthcare parcel flows within the Europe domestic courier market.


By Speed of Delivery: Express Outpaces in Urban Cores
Express shipments record the swiftest trajectory at a 4.12% CAGR between 2026-2031 on the back of urgent B2B orders and premium same-day consumer demand. Urban congestion and LEZ fees favor compact electric vans and bikes that weave through traffic, raising service reliability. Although non-express deliveries still comprise 76.20% of value in 2025, their growth tapers as consumers select slower yet greener options. Express channels increasingly use predictive analytics to batch orders within optimal micro-fulfillment radii, improving stop density.
Non-express continues to anchor network economics by supplying scale on trunk lines, subsidizing express service operating costs. The Europe domestic courier market consequently pursues dual-speed infrastructures: automated hubs deploy split-sort logic while line-haul assets dynamically re-assign to late-cut-off express waves. This hybridity lets operators monetize premium windows without duplicating fixed assets. Cost-curbing measures, such as parcel-locker diversion, reduce express on-door attempts, balancing speed with resource efficiency across the Europe domestic courier market.
By Shipment Weight: Light Parcels Stay Dominant
Light parcels hold 59.40% of the 2025 value because most e-commerce goods fall within standard automated-sort formats. They travel through high-speed cross-belt sorters, enabling per-piece costs that anchor the Europe domestic courier market. Heavy parcels show the highest 3.62% CAGR between 2026-2031 as industrial maintenance and home-improvement items migrate online. Handling such weight calls for tail-lift vans and in-building delivery options that attract surcharges.
Medium-weight parcels grow steadily by piggybacking on both consumer and industrial flows. Sorting centers invest in adjustable chute widths and robotic arms to cover the full spectrum efficiently. Emission rules widen the cost gap between lightweight cargo bikes and heavier diesel vans, incentivizing shipment consolidation whenever feasible. Nevertheless, product-dimension diversity ensures that all three weight bands remain critical pillars of service design in the Europe domestic courier market.
By Model: C2C Rises with Circular Marketplaces
B2C remains dominant at 47.90% share in 2025 thanks to direct-to-consumer brands and marketplace volumes that continue to redefine retail. Yet C2C transactions now expand at a 3.92% CAGR between 2026-2031, propelled by recommerce platforms that move secondhand apparel, electronics, and furniture. The surge forces networks to handle irregular pickups and non-standard packaging, prompting service modules like print-at-home labels and QR-code drop-offs at lockers. B2B volumes stabilize with recovering industrial orders, delivering higher ticket sizes even as overall growth moderates.
To blend versatility with cost, couriers embed API integrations with top C2C platforms, allowing frictionless label generation and proactive tracking. Sustainability credentials become pivotal selection criteria: senders and recipients often prefer operators disclosing carbon footprints per shipment. The Europe domestic courier industry thus aligns model strategy with environmental reporting obligations, translating ISO 14001 adoption into marketing leverage while streamlining operations across all three models.
Geography Analysis
Poland commands 3.20% share in 2025, acting as a pivotal conduit between Western consumer markets and Eastern production clusters. Government-led infrastructure projects, such as the Central Communication Port, upgrade multimodal connectivity, enabling parcel hubs to pivot easily between domestic and cross-border volumes. Germany and France sustain large absolute revenues, yet volume growth normalizes as locker penetration and delivery-frequency optimization moderate per-capita shipments.
Bulgaria leads growth tables at a 3.67% CAGR between 2026-2031, buoyed by EU structural funds modernizing arterial highways and warehousing stock. Similar trajectories appear in Romania and Czech Republic, where wage competitiveness attracts fulfillment centers serving pan-European platforms.
Nordic countries continue to pilot zero-emission initiatives and warehouse automation, exporting best practices later scaled across the Europe domestic courier market. Post-Brexit United Kingdom faces procedural friction on EU flows but shields domestic volume through entrenched online shopping habits. Switzerland occupies a premium niche dominated by high-value goods and cold-chain healthcare, securing elevated yields compared with EU peers.
Competitive Landscape
Market consolidation remains moderate as national postal incumbents vie with global integrators and digitally native specialists. Deutsche Post DHL leverages its 17,000-strong electric bike fleet to differentiate on sustainability while scaling locker partnerships across Germany. InPost’s pan-European locker strategy underpins its 1 billion-parcel milestone, allowing white-label deals with retailers keen to trim last-mile costs.
Royal Mail and PostNL accelerate automation to offset labor shortages, evidenced by PostNL’s EUR 300 million (USD 331.09 million) Nieuwegein mega-hub capable of 1.2 million parcels daily.
Technology investments center on AI routing, predictive sort planning, and customer-facing carbon dashboards. Operators fostering open APIs with marketplaces and ERP systems secure stickier client relationships. Regulatory exposure shapes fleet roadmaps; those lagging on electrification face mounting LEZ penalties. The Europe domestic courier market therefore pivots on the dual axes of sustainability compliance and data-driven efficiency rather than sheer network footprint.
Europe Domestic Courier Industry Leaders
DHL Group
International Distributions Services (including GLS)
La Poste Group
United Parcel Service of America, Inc. (UPS)
FedEx
- *Disclaimer: Major Players sorted in no particular order

Recent Industry Developments
- October 2024: InPost unveils GBP 1 billion plan to raise its UK locker count from 6,000 to 10,000 by 2026, targeting grocery sites and transit hubs.
- September 2024: DHL Express completes its EUR 1.8 billion (USD 1.98 billion) acquisition of Hillebrand Gori, adding temperature-controlled wine and spirits logistics capabilities.
- August 2024: FedEx launches a EUR 200 million (USD 220.72 million) electric-van pilot across Paris, London, and Amsterdam, deploying 500 zero-tailpipe vehicles.
- July 2024: PostNL opens its EUR 300 million (USD 331.09 million) automated sort center in Nieuwegein, Netherlands, lifting daily capacity to 1.2 million parcels.


Europe Domestic Courier Market Report Scope
Express, Non-Express are covered as segments by Speed Of Delivery. Heavy Weight Shipments, Light Weight Shipments, Medium Weight Shipments are covered as segments by Shipment Weight. E-Commerce, Financial Services (BFSI), Healthcare, Manufacturing, Primary Industry, Wholesale and Retail Trade (Offline), Others are covered as segments by End User Industry. Business-to-Business (B2B), Business-to-Consumer (B2C), Consumer-to-Consumer (C2C) are covered as segments by Model. Albania, Bulgaria, Croatia, Czech Republic, Denmark, Estonia, Finland, France, Germany, Hungary, Iceland, Italy, Latvia, Lithuania, Netherlands, Norway, Poland, Romania, Russia, Slovak Republic, Slovenia, Spain, Sweden, Switzerland, United Kingdom are covered as segments by Country.| Express |
| Non-Express |
| Heavy Weight Shipments |
| Light Weight Shipments |
| Medium Weight Shipments |
| E-Commerce |
| Financial Services (BFSI) |
| Healthcare |
| Manufacturing |
| Primary Industry |
| Wholesale and Retail Trade (Offline) |
| Others |
| Business-to-Business (B2B) |
| Business-to-Consumer (B2C) |
| Consumer-to-Consumer (C2C) |
| Albania |
| Bulgaria |
| Croatia |
| Czech Republic |
| Denmark |
| Estonia |
| Finland |
| France |
| Germany |
| Hungary |
| Iceland |
| Italy |
| Latvia |
| Lithuania |
| Netherlands |
| Norway |
| Poland |
| Romania |
| Russia |
| Slovak Republic |
| Slovenia |
| Spain |
| Sweden |
| Switzerland |
| United Kingdom |
| Rest of Europe |
| Speed of Delivery | Express |
| Non-Express | |
| Shipment Weight | Heavy Weight Shipments |
| Light Weight Shipments | |
| Medium Weight Shipments | |
| End User Industry | E-Commerce |
| Financial Services (BFSI) | |
| Healthcare | |
| Manufacturing | |
| Primary Industry | |
| Wholesale and Retail Trade (Offline) | |
| Others | |
| Model | Business-to-Business (B2B) |
| Business-to-Consumer (B2C) | |
| Consumer-to-Consumer (C2C) | |
| Country | Albania |
| Bulgaria | |
| Croatia | |
| Czech Republic | |
| Denmark | |
| Estonia | |
| Finland | |
| France | |
| Germany | |
| Hungary | |
| Iceland | |
| Italy | |
| Latvia | |
| Lithuania | |
| Netherlands | |
| Norway | |
| Poland | |
| Romania | |
| Russia | |
| Slovak Republic | |
| Slovenia | |
| Spain | |
| Sweden | |
| Switzerland | |
| United Kingdom | |
| Rest of Europe |


Market Definition
- Courier, Express, and Parcel - The Courier, Express, and Parcel services, often called as CEP Market, refers to the logistics and postal service providers which specialize in moving small goods (parcels/packages). It captures the overall market size (USD) and market volume (number of parcels) of (1) the shipments/parcels/packages which are under 70kgs/ 154lbs weight, (2) Business Customer packages viz. Business-to-Business (B2B) & Business-to-Consumer (B2C) as well as private customer packages (C2C), (3) non-express parcel delivery services (Standard and Deferred) as well as express parcel delivery services (Day-Definite-Express and Time-Definite-Express), (4) domestic as well as international shipments.
- Demographics - To analyse total addressable market demand, population growth & forecasts have been studied and presented in this industry trend. It represents population distribution across categories like gender (male/female), development area (urban/rural), major cities among other key parameters like population density and final consumption expenditure (growth and share % of GDP). This data has been used for assessing the fluctations in demand & consumption expenditure, and the major hotspots (cities) of potential demand.
- Domestic Courier Market - Domestic Courier Market refers to the CEP shipments wherein the origin and destination is within the boundary of the geography studied (country or region as per the scope of report). It captures the market size (USD) and market volume (number of parcels) of (1) the shipments/parcels/packages which are under 70kgs/ 154lbs weight, including light weight shipments, medium weight shipments and heavy weight shipments (2) Business Customer packages viz. Business-to-Business (B2B) & Business-to-Consumer (B2C) as well as private customer packages (C2C), (3) non-express parcel delivery services (Standard and Deferred) as well as express parcel delivery services (Day-Definite-Express and Time-Definite-Express).
- E-Commerce - This end user industry segment captures the external (outsourced) logistics expenditure incurred by the e-tailers, through online sales channel, on Courier, Express, and Parcel (CEP) services. The scope includes (i) the supply chain of a company's online customer orders being fulfilled, (ii) the process of getting a product from the point of manufacturing to the point at which it is delivered to consumers. It involves managing inventory (deferred as well as time critical), shipping, and distribution.
- Export Trends and Import Trends - Overall logistics performance of an economy is positively and significantly (statistically) correlated to its trade performance (exports and imports). Hence, in this industry trend, total value of trade, major commodities/ commodity groups and the major trade partners, for the studied geography (country or region as per the scope of report) have been analysed alongside the impact of major trade/logistics infrastructure investments & regulatory environment.
- Financial Services (BFSI) - This end user industry segment captures the external (outsourced) logistics expenditure incurred by the BFSI players, on Courier, Express, and Parcel (CEP) services. CEP is important to the financial services industry in shipping of confidential documents and files. The establishments in this sector are engaged in (i) financial transactions (that is, transactions involving the creation, liquidation, or change in ownership of financial assets) or in facilitating financial transactions, (ii) financial intermediation, (iii) the pooling of risk by underwriting annuities and insurance, (iv) providing specialized services that facilitate or support financial intermediation, insurance and employee benefit programs, and (v) monetary control - the monetary authorities.
- Fuel Price - Fuel price spikes can cause delays and diruption for logistics service providers (LSPs), while drops in the same can result in higher short-term profitability and increased market rivalry to offer consumers with the best deals. Hence, the fuel price variations have been studied over the review period and presented along with the causes as well as market impacts.
- GDP Distribution by Economic Activity - Nominal Gross Domestic Product and distribution of the same, across major economic sectors in the geography studied (country or region as per scope of the report) have been studied and presented in this industry trend. As GDP is positively related to the profitability and growth of logistics industry, this data has been used in adjunction to the input-output tables/ supply-use tables for analyzing the potential major contributing sectors towards the logistics demand.
- GDP Growth by Economic Activity - Growth of Nominal Gross Domestic Product across major economic sectors, for the geography studied (country or region as per scope of the report) have been presented in this industry trend. This data has been utilized for assessing the growth of logistics demand from all the market end users (economic sectors considered here).
- Healthcare - This end user industry segment captures the external (outsourced) logistics expenditure incurred by the Healthcare players (Hospitals, clinics, mrdical centres) , on Courier, Express, and Parcel (CEP) services. The scope includes CEP services involved in the defrerred as well time critical movement of medical goods & supplies (surgical supplies and instruments, including gloves, masks, syringes, equipment). The establishments in this sector (i) include the ones providing medical care exclusively (ii) deliver services by trained professionals (iii) involve processes, including labor inputs of health practitioners with the requisite expertise (iv) are defined based on the educational degree held by the practitioners included in the industry.
- Inflation - Variations in both Wholesale Price Inflation (YoY change in producer price index) and Consumer Price Inflation have been presented in this industry trend. This data has been used to assess the inflationary environment as it plays a vital role in smooth functioning of the supply chain, directly impacting the logistics operational cost components e.g., pricing of tyres, driver wages & benefits, energy/fuel prices, maintenace costs, toll charges, warehousing rents, custom brokerage, forwarding rates, courier rates etc. hence impacting the overall freight and logistics market.
- Infrastructure - As infrastructure plays a vital role in an economy's logistics performance, variables like length of roads, distribution of road length by surface category (paved v/s unpaved), distribution of road length by road classification (expressways v/s highways v/s other roads), rail length, volume of containers handled by major ports and tonnage handled by major airports have been analysed and presented in this industry trend.
- International Express Service Market - International Express Service Market refers to the CEP shipments wherein the origin or destination is not within the boundary of the geography studied (country or region as per the scope of report). It captures the market size (USD) and market volume (number of parcels) of (1) the shipments/parcels/packages which are under 70kgs/ 154lbs weight, including light weight shipments, medium weight shipments and heavy weight shipments (ii) Inter-Region as well as Intra-Region Shipments
- Key Industry Trends - The report section named "Key Industry Trends" include all the key variables/parameters studied to better analyze the market size estimates and forecasts. All the trends have been presented in the form of data points (time series or latest available data points) along with analysis of the paramter in the form of concise market relevant commentary, for the geography studied (country or region as per the scope of report).
- Key Strategic Moves - The action taken by a company to differentiate from its competitor or used as a general strategy is referred to as a key strategic move (KSM). This includes (1) Agreements (2) Expansions (3) Financial Restructuring (4) Mergers and Acquisitions (5) Partnerships, and (6) Product Innovations. Key players (Logistics Service Providers, LSPs) in the market have been shortlisted, their KSM have been studied and presented in this section.
- Logistics Performance - Logistics Performance and Logistics Costs are the backbone of trade, and influences trade costs, making countries compete globally. Logistics performance is influenced by market wide adopted supply chain management strategies, government services, investments & policies, fuel/ energy costs, inflationary environment etc. Hence, in this industry trend, the logistics performance of the geography studied (country/ region as per the scope of report) has been analysed and presented over the review period.
- Manufacturing - This end user industry segment captures the external (outsourced) logistics expenditure incurred by the Manufacturing industry (including Hi-Tech/Technology) players, on Courier, Express, and Parcel (CEP) services. The end user players considered are the establishments primarily engaged in the chemical, mechanical or physical transformation of materials or substances into new products. Logistics Service Providers (LSPs) play a crucial role in maintaining a smooth flow of raw materials across the supply chain, enabling timely delivery of finished goods to distributors or end customers and storing & supplying the raw materials to clients for just-in-time manufacturing.
- Other End Users - Other end user segment captures the external (outsourced) logistics expenditure incurred by the construction, real estate, educational services, and professional services (administrative, waste management, legal, architectural, engineering, design, consulting, scientific R&D), on Courier, Express, and Parcel (CEP) services. Logistics Service Providers (LSPs) plays a crucial role in the reliable movement of time critical supplies and documents to/from these industries such as transporting any equipment or resources required, shipping confidential documents and files.
- Primary Industry - This end user industry segment captures the external (outsourced) logistics expenditure incurred by the AFF (Agriculture, Fishing, and Forestry) and Extraction indsutry (Oil &Gas, Quarrying and Mining) players, on Courier, Express, and Parcel (CEP) services. The end user players considered are the establishments (i) primarily engaged in growing crops, raising animals, harvesting timber, harvesting fish & other animals from their natural habitats and providing related support activities; (ii) that extract naturally occurring mineral solids, such as coal and ores; liquid minerals, such as crude petroleum; and gases, such as natural gas. Herein, Logistics Service Providers (LSPs) (i) play a crucial role in acquisition, storage, handling, transportation, and distribution activities for the optimal & continuous flow of inputs (seeds, pesticides, fertilizers, equipment, and water) from manufacturers or suppliers to the producers and smooth flow of output (produce, agro-goods) to distributors/ consumers; (ii) cover entire phases from upstream to downstream and play a crucial role in the transportation of machinery, drilling equipments, extracted minerals, crude oil & natural gas and refined/ processed products from one place to another. This includes both termperature controlled and non-temperature controlled logistics, as and when required according to the shelf life of goods being transported or stored.
- Producer Price Inflation - It indicates inflation from viewpoint of the producers viz. the average selling price received for their output over a period of time. Annual change (YoY) of producer price index is reported as wholesale price inflation in the "Inflation" industry trend. As WPI captures dynamic price movements in most comprehensive way, it is widely used by governments, banks, industry, business circles and is deemed important in formulation of trade, fiscal and other economic policies. The data has been used in adjunction to consumer price inflation for better understanding the inflationary environment.
- Segmental Revenue - Segmental Revenue has been triangulated or computed and presented for all the major players in the market. It refers to the courier, express, and parcel (CEP) market specific revenue earned by the company, over the base year of study, in the geography studied (country or region as per the scope of report). It is computed through the study and analysis of major parameters like financials, service portfolio, employee strength, fleet size, investments, number of countries present in, major economies of concern, etc. that have been reported by the company in its annual reports, webpage. For companies having scarce financial disclosures, paid databases like D&B Hoovers, Dow Jones Factiva have been resorted to and verified through industry/expert interactions.
- Transport and Storage Sector GDP - Value and growth of Transport and Storage Sector GDP has a direct relation to the freight and logistics market size. Hence, this variable has been studied and presented over the review period, in value terms (USD) and as share % of total GDP, in this industry trend. The data has been supported by concise and relevant commentary around the investments, developments, and current market scenario.
- Trends in E-Commerce Industry - Enhanced internet connectivity and boom in smartphone penetration, coupled with increasing disposable incomes, has led to a phenomenal growth in the e-commerce market globally. Online shoppers require fast and efficient delivery of their orders leading to an increase in the demand for logistics services especially e-commerce fulfilment services. Hence, the Gross Merchandise Value (GMV), historial and projected growth, breakup of major commodity groups in e-commerce industry for the studied geography (country or region as per scope of the report) have been analysed and presented in this industry trend.
- Trends in Manufacturing Industry - Manufacturing industry involves the transformation of raw materials into finished products, while logistics industry ensures the efficient flow of raw materials to the factory, and the transport of manufactured products to the distributors & consumers. Demand-Supply of both industries are highly cross-linked and critical for a seamless supply chain. Hence, the Gross Value Added (GVA), breakup of GVA into major manufacturing sectors, and growth of manufacturing industry over the review period have been analysed and presented, in this industry trend.
- Wholesale and Retail Trade (Offline) - This end user industry segment captures the external (outsourced) logistics expenditure incurred by the wholesalers and retailers, through offline sales channel, on Courier, Express, and Parcel (CEP) services. The end user players considered are the establishments primarily engaged in wholesaling or retailing merchandise, generally without transformation, and rendering services incidental to the sale of merchandise. Logistics Service Providers (LSPs) plays a crucial role in the reliable movement of supplies to and finished products from production houses to the distributors and finally to the end customer covering activites like material sourcing, transportation, order fulfillment, warehousing & storage, demand forecasting, inventory management etc.
| Keyword | Definition |
|---|---|
| Axle Load | The axle load refers to the total load (weight) bearing on the roadway through wheels connected to a given axle. Across the globe, there are systems in place to ensure axle load monitoring, wherein surpassing the defined limits set by the concerned regulatory authority can lead to penalty/fine. For transportation of goods via road this can be an important determinant of costs as knowledge about the axle load limits can be used to (i) load the vehicle optimally for maximizing profits (ii) avoid exceeding the same and hence the probable fines associated (iii) avoid wear and tear of the vehicle (iv) avoid damage to pavement resulting in noticeable public maintenance and repair costs (v) achieve better turnaround time. |
| Back Haul | Backhaul is the return movement of a transport vehicle from its original destination to its original point of departure, and can include full, partial, or empty truck loads (all or part of the way) depending on the visibility of the local freight ecosystem. In this regard, transportation of empty containers to the point of origin, known as deadheading is also a significant factor, considering the supply/container shortages across the geographies, resulting in cost escalation and under optimized profit potential attainment. Generally, the carriers offer discounts on the backhaul, to secure freight for the trip. |
| Bill of Lading (BOL) | A bill of lading is a legal contract document issued by a carrier to a shipper to acknowledge reception of their cargo, and is evidence for the contract of carriage between the two parties. Broadly it details the (i) type, quantity, and other specifications of the goods being carried (ii) destination, and terms & conditions of the shipment (iii) carrier and drivers with all the necessary information to process the shipment, which can be used for insurance and customs clearance purposes (iv) assurance that the consignment is damage-free and ready to be shipped to the consignee. In this regard, a house bill of lading (HBL) is a document issued by a freight forwarder or a non-vessel operating common carrier (NVOCC) to acknowledge receipt of items for shipment (to a shipper). If shipments from several shippers are involved a master bill of lading (MBL) might be involved which is a consolidated version of the same for all the shipments being taken care of by the carrier (to a common destination) and might be issued by the carrier to the freight forwarder or the shipper (depending on who books the transport). |
| Bunkering | Bunkering is the process of supplying fuel to power the propulsion system of a ship. It includes the logistics of loading and distributing the fuel among available shipboard tanks. In this regard, (i) Bunker fuel is technically any type of fuel oil used aboard ships. It gets its name from the containers on ships and in ports that it is stored in; in the days of steam they were coal bunkers but now they are bunker-fuel tanks, (ii) Bunker refers to the spaces (Tank) on board a vessel to store fuel, (iii) Bunker trader refers to a person dealing in trade of bunker (fuel), (iv) Bunker call is made when a cargo ship anchors or berths in a port to take on bunker oil or supplies, (v) Bunkering service is the supply of a requested quality and quantity of bunkers to a ship. Bunkering is signficant from point of view of freight rates applicable to the shipper as Bunker Contribution (BUC)/ Fuel Adjustment Factor (FAF)/ Bunker Adjustment Factor (BAF) are applied by shipping lines to offset the effect of fluctuations in the cost of bunkers. |
| Cabotage | Transport by a vehicle registered in a country, performed on the national territory of another country. Cabotage law may restrict domestic cargo traffic to be carried in its own nationally registered, and sometimes built and crewed vehicles, though regulations vary across industries/commodity groups/countries and sometimes specify maximum allowable percentage of cabotage that can be serviced by foreign registered fleet. |
| C-commerce | Collaborative commerce (also known as C-commerce), (i) describes electronically enabled business interactions among an enterprise’s internal personnel, business partners and customers throughout a trading community (industry, industry segment, supply chain or supply chain segment); (ii) is the optimization of supply and distribution channels to capitalize on the global economy by using new technology efficiently. Advantages of C-commerce, to detail few include (i) maximization of organization's efficiency and profitability (ii) technology integration with physical channels to allow companies to work together (iii) increased information exchange such as inventory and product specifications, using the web as an intermediary (iv) increased competitiveness by reaching a broader audience. Examples of C-commerce, also known as peer-to-peer commerce, include (i) companies that allow consumers to rent things from each other, or marketplaces, such as Meta (formerly Facebook) Marketplace, that allow the sale of used goods; (ii) DoorDash teamed up with many national brands, such as McDonald’s and Chipotle, to offer fast food delivery, building their business model on c-commerce. They have since expanded their delivery service from restaurants to retailers and even offer 'fleets' of drivers to businesses. |
| Courier | A business/company that delivers packages/parcels/shipments (upto 70 kgs) including quick door to door pickup and delivery service for goods or documents, domestically or internationally, on a commercial contract basis. Example, DHL Group, FedEx, United Parcel Service of America, Inc., USPS, International Distributions Services, J&T Express, SF Express among several others |
| Cross docking | Cross docking is a practice in logistics management that includes unloading incoming delivery vehicles and loading the materials directly into outbound delivery vehicles, omitting traditional warehouse logistical practices and saving time and money. It requires close synchronization of both inbound and outbound movements. It is highly significant in reduction of costs pertaining to warehousing & storage (and the associated Value Added Services). |
| Cross Trade | International transport between two different countries performed by a vehicle registered in a third country. A third country is a country other than the country of loading/embarkation and the country of unloading/disembarkation. Cross Trade law may restrict international cargo traffic to be carried by respective country's registered vehicles, and sometimes built and crewed vehicles, though regulations vary across industries/commodity groups/countries and sometimes specify maximum allowable percentage of cross trade that can be serviced by foreign registered fleet. |
| Customs Clearance | The process of declaring and clearing cargoes through customs. It includes the procedures involved in getting cargo released by Customs through designated formalities such as presenting import license/permit, payment of import duties and other required documentations by the nature of the cargo. In this regard, a customs broker is a person or company licensed by the respective department of the country to act on behalf of freight importers and exporters. |
| Dangerous Goods | Dangerous goods (or hazardous materials or HAZMAT) include flammable liquids/solids, gases (compressed, liquified, dissolved under pressure), corrosives, oxidising substances, explosive substances and articles, substances which on contact with water emit flammable gasses, organic peroxides, toxic substances, infectious substances, radioactive materials, miscellaneous dangerous goods and articles. |
| First mile Delivery | First mile delivery refers to the (i) first stage of the freight/shipment/cargo/courier transportation (ii) the transportation of goods from a merchant’s premises or warehouse to the next fulfillment centre/warehouse/hub from where the goods are forwarded (iii) shipping goods from local distribution centers to stores (For retailers) (iv) transportation of finished goods from a plant or a factory to a distribution center (For manufacturers), (v) pick up of goods from the end-customer’s home or store followed by movement to a warehouse or storage location (movers and packers), (vi) process where goods are picked up from a retailer and then transferred to third-party logistics providers or courier service providers to be delivered to the end-consumer (e-commerce). Once the package reaches the next warehouse or the courier’s hub, it is then sorted and transported further until it reaches the customer’s doorstep. Example, if one chooses UPS as a courier, first-mile delivery will be the product being delivered from manufacturer's/retailer's warehouse to the UPS’s warehouse/ fulfilment centre. |
| Last Mile Delivery | Last mile delivery refers to the very last step of the delivery process when a parcel is moved from a transportation hub (warehouse or a distribution center or fulfillment centre) to its final destination, which usually is a personal residence/retail store/ business, or parcel locker. It accounts for around half of the total cost involved in entire process of first mile, middle mile, and last mile delivery, though it can vary shipment to shipment, based on commodity, business model and similar factors. |
| Milkrun | A Milk Run is a delivery method used to transport mixed loads from various suppliers to one customer, using lean management principles applied to logistics. Instead of each supplier sending a truck every week to meet the needs of one customer, one truck (or vehicle) visits the suppliers to pick up the loads for that customer. This method of transport got its name from the dairy industry practice, where one tanker used to collect milk from several dairy farms for delivery to a milk processing company. A milk run can be a more efficient way to handle logistics but require proper planning. If the route involves products from different companies, there is need for an agreement about cost-sharing and other aspects of the cooperative delivery arrangement. Once the group settles these issues, this delivery method can save time and money for everyone by pooling operation costs and resources. |
| Multi country consolidation | Multi-Country Consolidation (MCC) is a cost-effective solution that consolidates one's cargo from different countries of origin to build Full Container Loads (FCL). MCC is most suitable for companies that import light volumes of goods from multiple countries but want to take advantage of the more economic FCL freight rates. Apart from costing some of the other advantages include (i) flexibility to choose suppliers from a wider range of origin countries without worrying about the logistics to final destination from each origin, (ii) ability to pick the most suitable suppliers from many different countries for one's business operations. The increase in one's sourcing options by MCC provides the kind of flexibility needed in competitive global markets. |
| Q-commerce | Q-commerce, also referred to as quick commerce, is a type of e-commerce where emphasis is on quick deliveries, typically in less than an hour. The companies providing Q-Commerce services might have vertically intergrated model or might be using third party delivery platforms (outsourced logistics). It has advantages like (i) competitve USP, (ii) potential to earn greater profit margins, (iii) better customer experience, (iv) guaranteed availability of products, (v) traceability, and (vi) scaleability. |
| ReverseLogistics | Reverse logistics is a type of supply chain management that moves goods from customers back to the sellers or manufacturers and may involve ciruclar economy principles (3Rs) viz. recycling, reuse (repurposing, reselling), reducing or repairing. In this regard, reverse commerce (or Recommerce) is the selling of previously owned items through physical or online marketplaces/distribution channels to buyers who reuse, recycle or resell them. |


Research Methodology
Mordor Intelligence follows a four-step methodology in all our reports.
- Step-1: Identify Key Variables: In order to build a robust forecasting methodology, the variables and factors identified in Step-1 are tested against available historical market numbers. Through an iterative process, the variables required for market forecast are set and the model is built on the basis of these variables.
- Step-2: Build a Market Model: Market-size estimations for the forecast years are in nominal terms. Inflation is considered to be a part of the pricing, and the average selling price (ASP) is varying throughout the forecast period for each country
- Step-3: Validate and Finalize: In this important step, all market numbers, variables and analyst calls are validated through an extensive network of primary research experts from the market studied. The respondents are selected across levels and functions to generate a holistic picture of the market studied.
- Step-4: Research Outputs: Syndicated Reports, Custom Consulting Assignments, Databases & Subscription Platforms


