
Europe Data Center Networking Market Size and Share
Market Overview
| Study Period | 2020 - 2031 |
|---|---|
| Forecast Data Period | 2026 - 2031 |
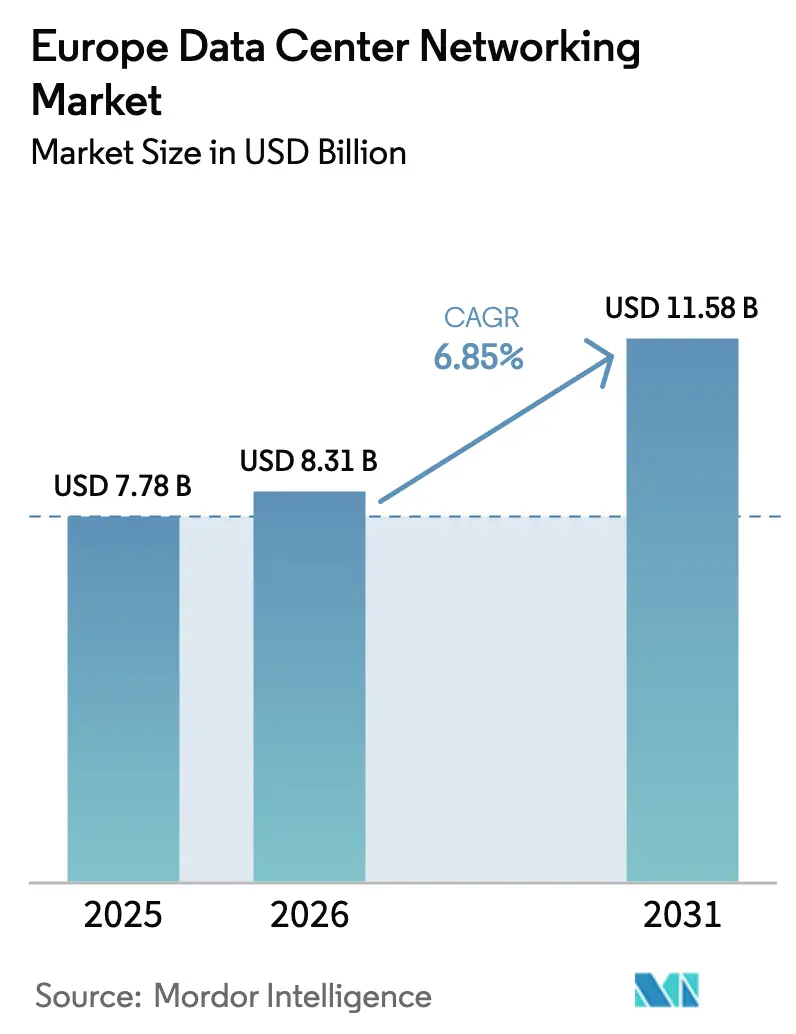
| Base Year Market Size (2025) | USD 7.78 Billion |
| Market Size (2026) | USD 8.31 Billion |
| Market Size (2031) | USD 11.58 Billion |
| Growth Rate (2026 - 2031) | 6.85 % |
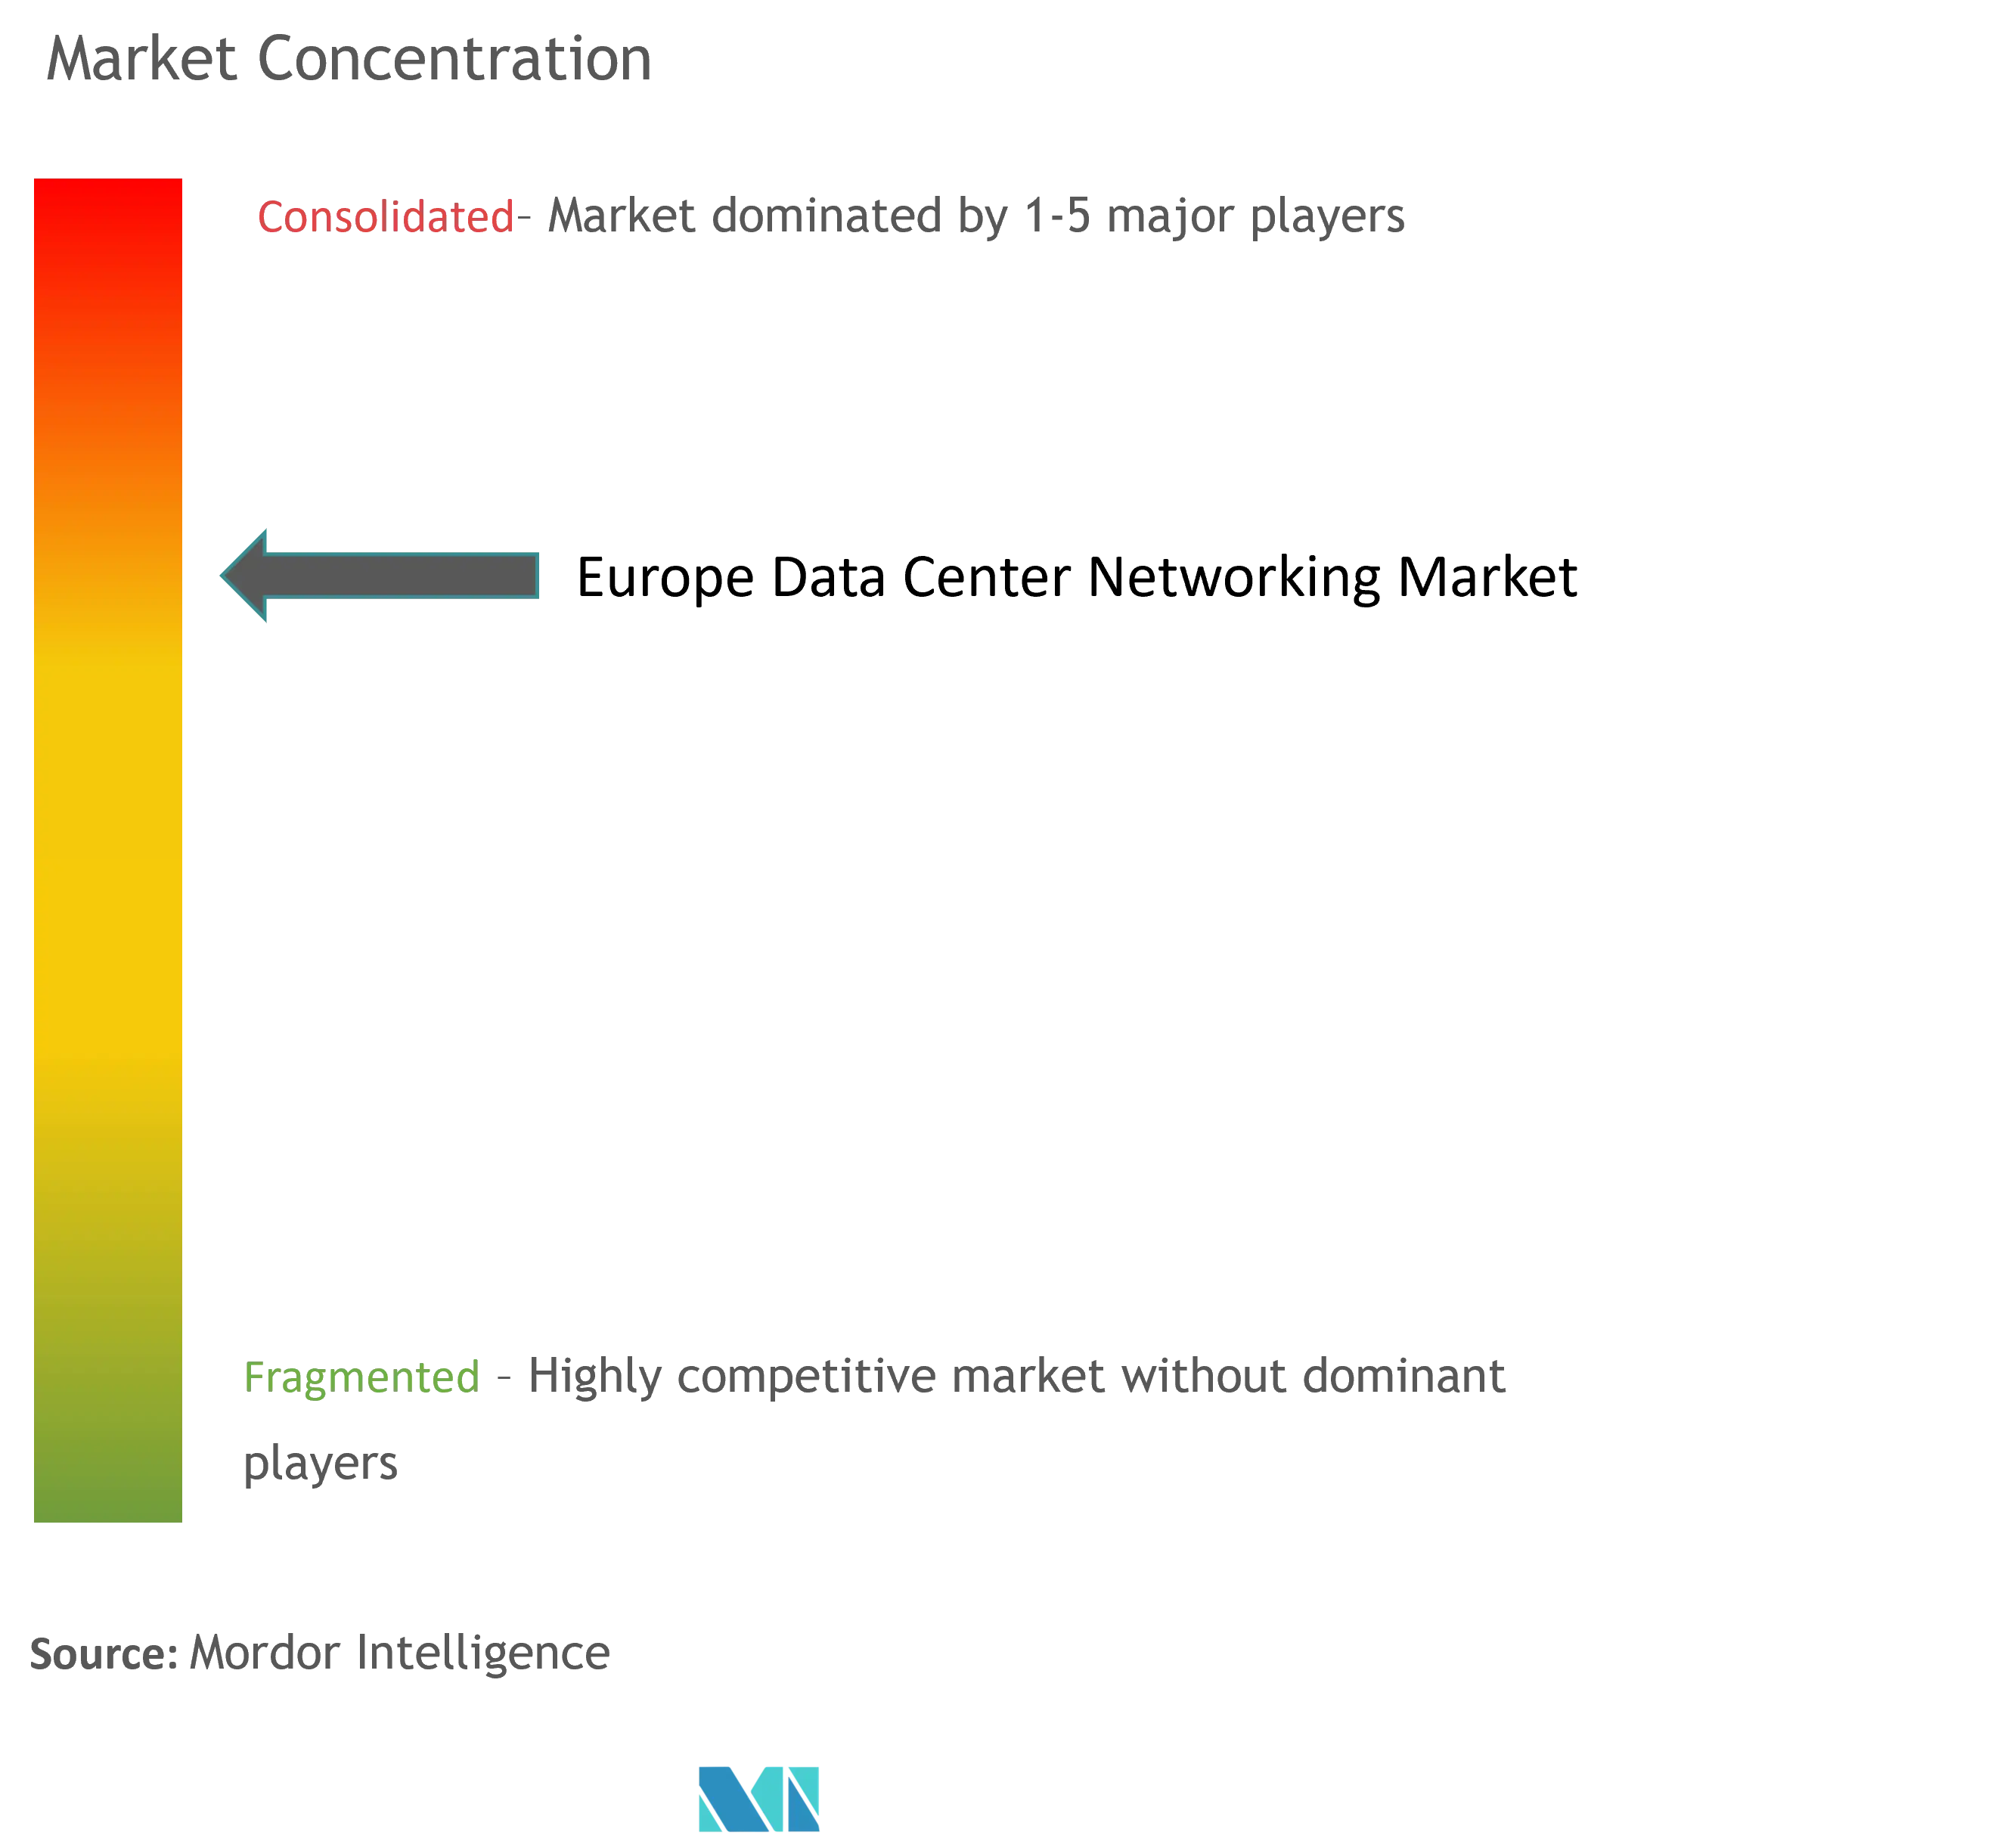
| Market Concentration | Medium |
Major Players *Disclaimer: Major Players sorted in no particular order Image © Mordor Intelligence. Reuse requires attribution under CC BY 4.0. | |
Europe Data Center Networking Market Analysis by Mordor Intelligence
Europe data center networking market size in 2026 is estimated at USD 8.31 billion, growing from 2025 value of USD 7.78 billion with 2031 projections showing USD 11.58 billion, growing at 6.85% CAGR over 2026-2031. Expansive AI infrastructure roll-outs, rapid edge computing adoption, and EU-wide sustainability mandates form the structural bedrock of this growth. Hyperscalers are moving aggressively; Brookfield has earmarked EUR 20 billion for French AI capacity while Microsoft is deploying EUR 4 billion to expand regional cloud estates, signaling a multi-year investment super-cycle. Hardware refreshes linked to the shift from 100 GbE to 400 GbE and 800 GbE accelerate replacement sales, and liquid-cooled platforms gain traction as operators prepare for mandatory energy-use reporting. Consolidation is rewriting competitive lines: Hewlett Packard Enterprise seeks to fold Juniper Networks into its portfolio, Cisco defends share through Silicon One, and Arista Networks gains mindshare on the back of 800-gigabit switch success. Secondary metros such as Madrid, Berlin, and Warsaw capture new builds as FLAP hubs confront grid limits; these locations become testbeds for energy-efficient designs anchored in renewable power.
Key Report Takeaways
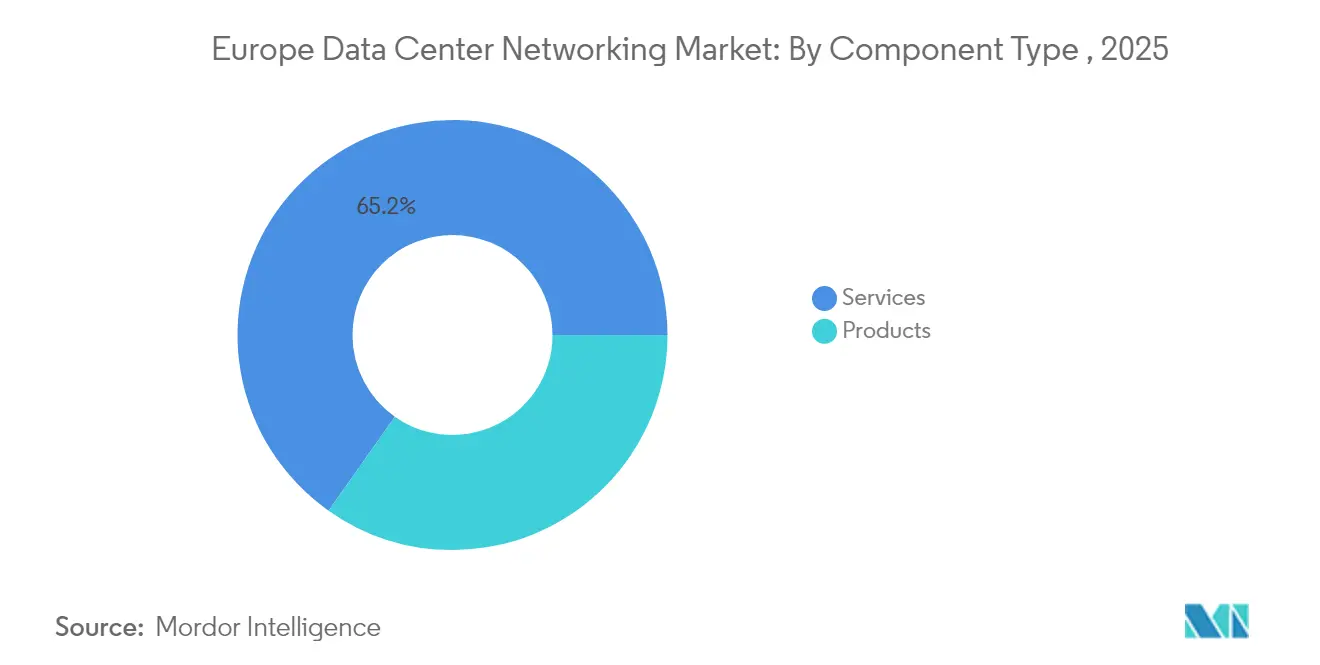
- By component, Ethernet switches led with 34.78% of Europe data center networking market share in 2025, while software-defined networking controllers are projected to record a 11.76% CAGR through 2031.
- By end-user, the IT & telecommunications segment held 36.05% share of the Europe data center networking market size in 2025; banking, financial services and insurance is expanding at a 12.65% CAGR to 2031.
- By data-center type, colocation facilities accounted for 51.72% of the Europe data center networking market size in 2025, whereas hyperscaler cloud service providers are set to grow at a 14.05% CAGR.
- By bandwidth, 50-100 GbE configurations controlled 37.74% Europe data center networking market share in 2025, and >100 GbE deployments are forecast to rise at a 12.74% CAGR.
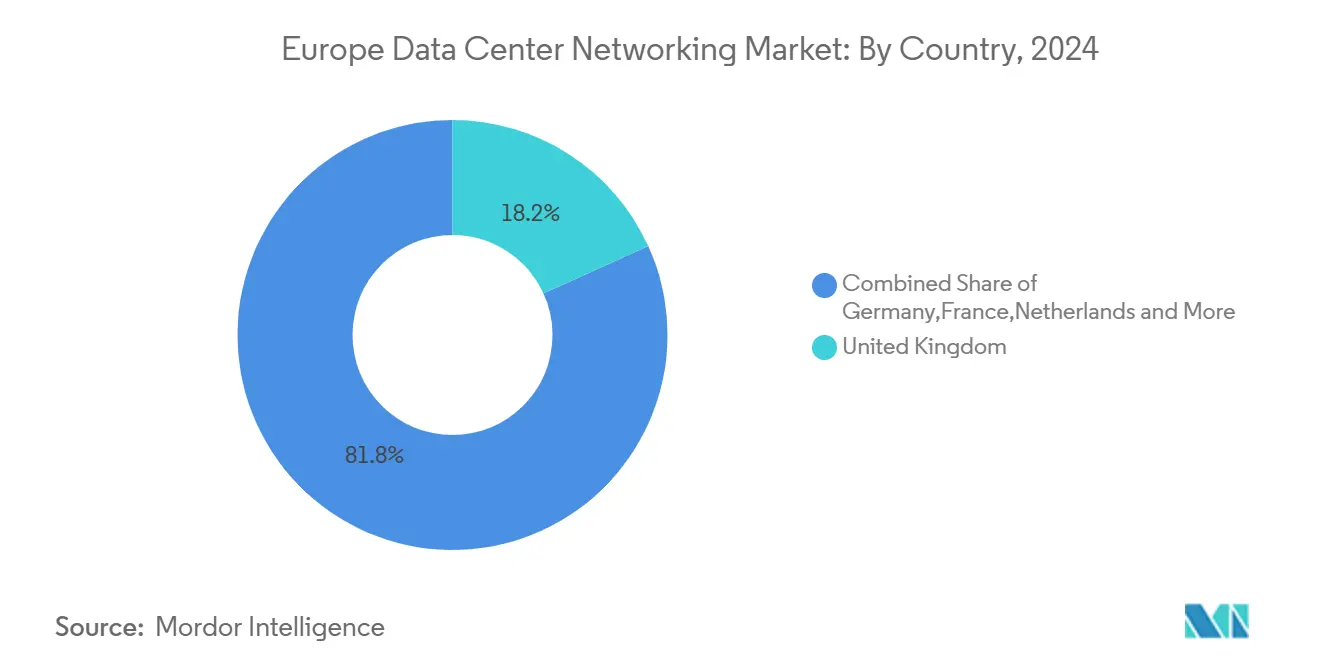
- By country, the United Kingdom captured 18.05% Europe data center networking market share in 2025; Spain is forecast to lead growth at a 10.18% CAGR.
Note: Market size and forecast figures in this report are generated using Mordor Intelligence’s proprietary estimation framework, updated with the latest available data and insights as of 2026.
Europe Data Center Networking Market Trends and Insights
Drivers Impact Analysis*
| Driver | (~) % Impact on CAGR Forecast | Geographic Relevance | Impact Timeline |
|---|---|---|---|
| Cloud storage and reliable application performance | +1.8% | FLAP-D corridors and pan-EU enterprises | Medium term (2-4 years) |
| 5G and edge-computing traffic surge | +1.5% | Core EU markets, Nordic expansion | Medium term (2-4 years) |
| Migration to 400G/800G Ethernet switching | +1.2% | Frankfurt, Amsterdam, Dublin hyperscaler clusters | Short term (≤ 2 years) |
| EU push for energy-efficient liquid-cooled switching | +0.9% | Germany and Netherlands early adopters | Long term (≥ 4 years) |
| Shift of builds to secondary EU metros | +0.8% | Madrid, Berlin, Warsaw, Milan | Medium term (2-4 years) |
| Merchant silicon and open NOS adoption | +0.6% | Cost-sensitive Eastern Europe and SME segment | Long term (≥ 4 years) |
| Source: Mordor Intelligence | |||
Cloud Storage and Reliable Application Performance
Forty-five percent of EU businesses procured cloud services in 2024, primarily for email hosting and file storage, underscoring mainstream reliance on off-premise platforms. Oracle Cloud Infrastructure was selected for European government workloads, indicating public-sector trust in cloud-native networks. Instant payment regulations require European banks to clear transactions within 10 seconds by 2025, a mandate that tightens latency budgets and favors ultra-low-jitter switching fabrics. The Trustworthy & Responsible AI Network linking leading hospitals depends on resilient inter-data-center paths to keep diagnostic AI online while remaining privacy-compliant. Together, regulatory imperatives and performance expectations elevate high-availability networking from operational necessity to board-level differentiator.
5G and Edge-Computing Traffic Surge
The EU intends to deploy 10,000 climate-neutral edge nodes by 2030, expecting 80% of processing to occur outside core sites.[1]Eurostat, “ICT Usage in Enterprises,” ec.europa.eu Demonstrations under the 5GMEC4EU program validate sub-millisecond edge fabrics that integrate optical circuit switching with SDN control planes. Deutsche Telekom positions edge as a pillar for national digital agendas, enabling smart-city telemetry and autonomous mobility. Micro data center revenues already exceeded USD 5.8 billion in 2023 and have a runway toward USD 160.8 billion by 2036, revealing a robust pipeline for ruggedized switches and intelligent edge controllers. This distributed topology re-routes traffic away from FLAP hubs, demanding new orchestration layers capable of real-time fault isolation across thousands of mini-sites.
Migration to 400G/800G Ethernet Switching
Hyperscale operators accelerated upgrades, with Arista supplying 7700R4 platforms to Meta’s European AI clusters and booking USD 7 billion in 2024 revenue, up 19.5% year on year. IEEE’s P802.3df release, coupled with interoperable 800 GbE demos at ECOC 2024, confirms the standardization path for next-gen optics. Cisco’s Silicon One unifies switching and routing on a single ASIC to simplify layer counts and trim energy draw. Google’s Jupiter network revision delivered 5× capacity while cutting capex by 30% through direct-connect optical fabrics.[2]Google Research, “Jupiter Rising: A Decade of Datacenter Networking,” research.google These transitions retire legacy 100 GbE estates, creating a replacement cycle that directly feeds Europe data center networking market expansion.
EU Push for Energy-Efficient Liquid-Cooled Switching
From September 2024, operators must file annual power-usage-effectiveness metrics under the revised Energy Efficiency Directive.[3]European Commission, “Directive (EU) 2023/1791 on Energy Efficiency,” ec.europa.eu CyrusOne’s FRA7 campus integrates waste-heat reuse, delivering 40 MW to local grids, a template for future German designs. Base-8 and Base-16 fiber plans improve port utilization and lower fan-out losses while meeting the EU sub-1.3 PUE objective. Berlin’s national strategy obliges new builds to tap renewables and export residual heat, compelling switch vendors to embed liquid-cool cold plates in top-of-rack gear. Vendors prioritizing green engineering, therefore, gain a policy-driven edge in the Europe data center networking market.
Restraints Impact Analysis*
| Restraint | (~) % Impact on CAGR Forecast | Geographic Relevance | Impact Timeline |
|---|---|---|---|
| Rising network complexity | -1.1% | Enterprise footprints across EU | Medium term (2-4 years) |
| Supply-chain shortage of optics and ASICs | -0.8% | Germany and Netherlands hit hardest | Short term (≤ 2 years) |
| Power-grid bottlenecks and permitting delays | -0.7% | FLAP-D metros and other urban centers | Long term (≥ 4 years) |
| Carbon- and water-use caps inflate TCO | -0.5% | EU-wide, tougher limits in Nordics | Medium term (2-4 years) |
| Source: Mordor Intelligence | |||
Rising Network Complexity
Hybrid cloud sprawl and AI pipelines complicate topologies faster than European enterprises can recruit qualified engineers. Juniper’s Apstra applies intent-based automation to multivendor fabrics, yet skills shortages persist as teams juggle Kubernetes, Terraform, and optical circuit switching. ETNO argues for policy relief that lets carriers recoup investments while delivering edge services. Without broad expertise, organisations defer upgrades, slowing refresh activity in the Europe data center networking market.
Supply-Chain Shortage of Optics and ASICs
Lead times for 400 G optical modules exceed 12 months, a constraint that mirrors COVID-era shocks according to Extreme Networks executives. European facilities remain dependent on Asian wafer fabs, a vulnerability highlighted in the Commission’s raw-materials foresight review. Lenovo’s Hungarian line eases regional tariffs but cannot fully offset shortages. Deferred deployments translate into lost quarters for switch revenue, trimming momentum during the forecast window.
*Our forecasts treat driver/restraint impacts as directional, not additive. The impact forecasts reflect baseline growth, mix effects, and variable interactions.
Segment Analysis
By Component: Hardware platforms anchor bandwidth upgrades
Ethernet switches commanded 34.78% Europe data center networking market share in 2025, underscoring their role in leaf-spine fabrics that feed GPU clusters. Software-defined networking controllers, expanding at 11.76% CAGR, orchestrate diverse ASIC generations and automate failover, a necessity as average cluster sizes surpass 10,000 servers. Routers retain relevance for WAN ingress but cede internal roles to converged switches that flatten layers and squeeze latency. Storage networking, though growing slower, gains interest from financial services adopting immutable backup vaults to satisfy operational resilience rules. Application delivery controllers become indispensable at the edge, handling TLS offload near user eyeballs. Security appliances increasingly embed in switching OS images to comply with EU Digital Operational Resilience Act rules. Optical interconnects evolve fastest; co-packaged optics and linear pluggable optics battle for sockets as operators weigh cost, power and upgrade ease. Services hold a stabilizing influence as managed network contracts let enterprises offset the expertise gap that complexity creates.
A second-wave replacement super-cycle is forming around liquid-cool ready gear. Vendors pairing cold-plate chassis with direct-to-chip loops appeal to colocation landlords who must publish PUE scores. Merchant silicon levels hardware performance, shifting differentiation toward NOS features such as real-time fabric telemetry. Open networking distributions like SONiC persuade buyers that they can swap vendors without forklift rewires, making software support and lifecycle stewardship the new trust metric. This pivot realigns profit pools toward licenses and subscription telemetry rather than physical ports, yet packet-processing ASIC innovation remains critical for line-rate encryption and AI cluster congestion control.



By End-User: Financial institutions accelerate latency-sensitive builds
IT and telecommunications firms delivered 36.05% of 2025 revenue, leveraging rich peering and backbone assets to monetise hybrid cloud and 5G. Banks and insurers post the fastest 12.65% CAGR as instant-payment rules and model-driven risk scoring force ultra-low latency links between vaults and analytics engines. Government and defence entities adopt sovereign cloud frameworks such as Germany’s Deutsche Verwaltungscloud, prioritising data residency and zero-trust segmentation. Media and entertainment houses expand private CDNs, shifting transcoding to edge racks to curb backbone congestion during live sports streams. Healthcare networks participate in shared AI models for radiology, fuelling demand for encrypted east-west traffic inspection. Manufacturing deploys deterministic Ethernet for robotic cells and predictive maintenance, pushing OT and IT domain convergence. Education, retail and logistics round out remaining spend, upgrading campus cores to 100 GbE as digital curricula and omnichannel fulfilment mature.
EU regulatory pressure for operational resilience anchors capital outlays. The Digital Operational Resilience Act compels even mid-tier financial entities to test failover quarterly, driving redundant mesh deployments. Telecommunication operators reroute traffic toward multi-access edge units to offload RAN congestion, embedding workload-aware routing into core switches. Overall, vertical diversity cushions cyclical swings in the Europe data center networking market while BFSI share grows.
By Data-Center Type: Neutral facilities still dominate interconnection
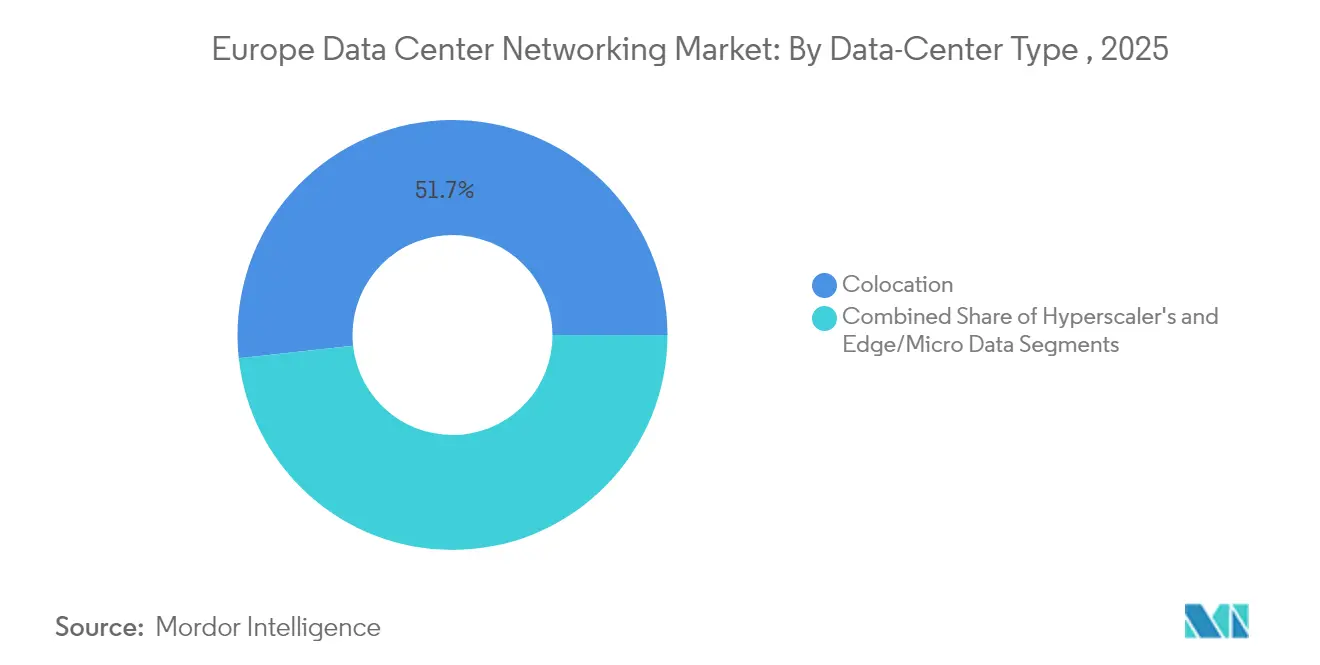
Colocation sites held 51.72% Europe data center networking market size in 2025 as enterprises seek carrier-neutral meet-me rooms for multi-cloud interconnection. Hyperscaler cloud providers, however, show the highest 14.05% CAGR triggered by AI training farms that demand 800 GbE fabrics. Edge and micro data centers multiply at tower sites and metro POPs, mirroring telco timelines for 5G standalone. Enterprises continue to vacate legacy on-prem computer rooms, migrating workloads into shared halls to meet Scope 3 carbon accounting goals. The colocation segment invests in on-site renewables, district heat export and battery storage to answer EU disclosure rules. Hyperscalers deploy proprietary topologies that integrate optical circuit switching for elephant flows, reducing spine layers and wiring cost. Edge operators prioritise rugged hardware with zero-touch provisioning to cut truck rolls to rural sites. Together, these archetypes ensure sustained channel diversity and cushion demand fluctuations.
Industry consolidation intensifies: Penta Infra absorbed KPN’s Amsterdam asset, and nLighten snapped up seven edge facilities from Exa Infrastructure. Such roll-ups give providers larger footprints to secure multi-megawatt leases from AI tenants. Landlords integrate liquid-immersion pods and wasted-heat capture to win zoning approvals, reshaping design guides for rack-level networking gear. Hyperscalers adopt Build-Operate-Transfer models in emerging metros to hedge against licensing risk while still controlling network design DNA. The Europe data center networking market therefore tracks not just capacity growth but ownership churn.
By Bandwidth: High-speed optics underpin AI clusters
In 2025, 50-100 GbE links accounted for 37.74% spend, satisfying mainstream enterprise storage and VM migration. Deployments above 100 GbE post the steepest 12.74% CAGR, underpinned by GPU cluster rollout that benefits from 400 GbE and 800 GbE leaf-spine fabrics. The ≤10 GbE tier remains for management networks and small regional edge nodes where cost outranks bandwidth. 25-40 GbE continues as a bridging option for mid-cycle refresh projects. Operators future-proof cabling by installing MPO-16 trunks ready for 1.6 T lanes, limiting stranded fibre when speeds double. Coherent pluggables extend Ethernet directly over metro fibre, bypassing proprietary DWDM shelves and cutting capex. As green tariffs rise, optics suppliers push lower-power DSPs and linear drivers, stepping toward energy budgets compatible with EU net-zero targets.
Wide adoption of host-based congestion controls improves link utilisation, enabling operators to increase oversubscription without hurting GPU training times. Vendors promote telemetry-anchored traffic engineering, analysing per-flow micro-bursts and shaping queues in real time. These capabilities encourage enterprises that skipped 100 GbE to leapfrog straight to 400 GbE, deepening refresh demand across the Europe data center networking market.
Geography Analysis
Europe data center networking market revenue concentrates in the FLAP-D corridor, yet grid constraints in London and Frankfurt curtail new megawatt allocations, steering investors toward secondary metros. Frankfurt sits at 745 MW installed IT capacity but faces connection moratoriums until sub-stations come online, slowing near-term switch demand. London still leads at 993 MW, though high power tariffs incentivise operators to earmark incremental AI clusters for northern England sites where renewable PPAs are available. Amsterdam, with 506 MW, imposes floor-space caps, driving multi-storey vertical builds that require higher port densities. Dublin remains a hyperscale stronghold, but electricity regulator CRU limits future allocations, pressing cloud providers to co-invest in grid upgrades.
Secondary markets show double-digit expansion as a result. Madrid leverages surplus solar production and benign permitting to invite 100-MW campuses, generating sizeable orders for 400 GbE fabrics. Berlin and Warsaw benefit from east-west fibre backbones, positioning themselves as disaster-recovery nodes for FLAP tenants. Milan’s growth stems from undersea cable landings from Africa and the Middle East, turning the city into a latency bridge to EMEA south. Nordic facilities target AI inference and batch analytics thanks to cool climates, with Denmark and Sweden offering tax incentives that cut total cost of ownership. EU investment vehicles amplify geographic spread. The Digital Europe Program allocated EUR 1.3 billion to AI and cybersecurity in 2025, earmarking grants for edge nodes that will number 10,000 by 2030. Renewable-heavy grids in Finland and Norway support green branding claims, appealing to corporate ESG scorecards. Eastern European governments deploy investment subsidies to build sovereign cloud zones, ensuring data stays within borders and boosting local switch procurement. Aggregate demand therefore follows a hub-and-edge pattern: mature metros consume replacement gear, while emerging locales absorb greenfield shipments, together underpinning a resilient trajectory for the Europe data center networking market.
Regulatory Landscape
EU policy is tightening around energy transparency and efficiency for data centers, which is raising the bar for power-aware switching, optics efficiency, and automated telemetry during network upgrades. Under the Energy Efficiency Directive framework, the EU introduced a data center reporting scheme (Delegated Regulation (EU) 2024/1364) that makes reporting mandatory for facilities above a 500 kW power-demand threshold, building on annual reporting of energy performance metrics that began in September 2024. In March 2026, the European Commission also opened feedback on an EU-level data center rating scheme as part of a broader Data Centre Energy Efficiency Package, alongside preparatory work on minimum performance standards. Together, these steps are reinforcing compliance-driven demand for energy-efficient, liquid-cool ready networking platforms.
Data governance and sovereignty initiatives further shape procurement for network security, segmentation, and data-handling controls. The EU Data Act (Regulation (EU) 2023/2854) establishes new obligations around access and use of data from connected products and related services, with key application requirements referenced for 12 September 2026, increasing attention on secure data movement, auditability, and vendor interoperability across cloud and edge deployments. In parallel, the European Commission published a Cloud and AI Development Act (CADA) proposal in June 2026 (COM(2026) 502), aiming to create a single EU-wide assessment framework for cloud and AI sovereignty. This is supporting demand for sovereign-ready architectures across government and regulated vertical data center networks.
Value Chain Analysis
The value chain starts with silicon and optics (switch ASICs, pluggable transceivers, and fiber/cabling), then extends to switch/router/ADC/security hardware manufacturing and network operating systems (NOS). It continues through systems integration into leaf-spine fabrics, followed by operations, automation, and managed services that help keep complex multi-site networks performant. Europe remains exposed to upstream constraints, including extended lead times for high-speed optical modules and dependence on non-European wafer and packaging capacity, which can slow 400G/800G rollouts even when data hall capacity is available. In this context, services (design, integration, and lifecycle support) and software layers (SDN controllers, intent-based automation, and telemetry platforms) increasingly influence time-to-deploy and day-2 operational outcomes.
Downstream demand concentrates among hyperscalers, colocation operators, and large enterprises, including IT and telecommunications and BFSI. Buyers tend to prioritize validated architectures and continuity of operational toolchains. Vendor strategies align with those buying priorities: Cisco emphasizes integrated systems and SDN-driven policy control (for example, Nexus/ACI-style approaches), Arista focuses on open high-speed Ethernet fabrics supported by automation and telemetry, and Huawei differentiates with vertically integrated compute-network approaches, including lossless Ethernet acceleration for AI fabrics. Channel partners, integrators, and managed network service providers also matter as network complexity rises and skills shortages widen. In parallel, data center operators increasingly require liquid-cooling compatibility and power-efficient optics so networking refreshes can align with site-level energy reporting and efficiency requirements.
Competitive Landscape
Competition balances scale and specialisation. Cisco retains the broadest portfolio, spanning leaf-spine switches, WAN routers and zero-trust appliances, but faces margin compression as merchant silicon erodes ASIC differentiation. Arista Networks recorded USD 2.005 billion Q1 2025 revenue, a 27.6% jump fuelled by 800 GbE shipments into European AI buildouts, cementing its challenger status. Hewlett Packard Enterprise’s pending USD 14 billion acquisition of Juniper Networks aims to blend compute, storage and network orchestration into a single stack, though U.S. regulators continue their review.
White-box penetration rises as hyperscalers value software control over branded metal. SONiC distributions let operators mix ODM chassis with self-developed tooling, reducing vendor lock-in and spurring price competition. PLVision contributes hardened SONiC images for Europe’s temperate-edge deployments, illustrating a market tilt toward services value. Legacy router incumbents respond by embedding streaming telemetry and AI-assisted troubleshooting into NOS packages, seeking subscription revenue.
Liquid-cool engineering becomes a key differentiator. Vendors integrate dielectric coolant loops to maintain ASIC temperatures under 65 °C while slashing fan energy. Firms first to certify liquid-ready gear under EU eco-design directives gain early-mover bids. Meanwhile, optical module makers accelerate linear pluggable optics roadmaps, allowing 800 GbE adoption without costly DSPs. The interplay of consolidation, open software and sustainability requirements shapes a moderately concentrated structure that still leaves room for nimble entrants targeting niche functions in the Europe data center networking market.
Europe Data Center Networking Industry Leaders
Cisco Systems, Inc.
Arista Networks, Inc.
Huawei Technologies Co., Ltd.
Juniper Networks, Inc.
Dell Technologies Inc.
- *Disclaimer: Major Players sorted in no particular order

Market Opportunities and Future Outlook
Compliance-driven efficiency requirements and the push to publish standardized energy performance metrics create a clear opportunity for vendors and service providers that can pair bandwidth upgrades with measurable reductions in power per bit. The EU has moved from guidance toward mandatory reporting for larger sites, including the 500 kW threshold under Delegated Regulation (EU) 2024/1364, and the European Commission advanced its 2026 work on an EU data center rating scheme and minimum performance standards. This environment supports liquid-cool capable switching, lower-power optics, and automation that can document utilization and energy KPIs. It also creates room for retrofit programs in FLAP-D markets constrained by grid limits, as well as for greenfield builds in secondary metros that use renewables and heat reuse as permitting enablers.
Sovereign and regulated-cloud architectures add another demand pocket for networking stacks that combine high availability, segmentation, encryption, and auditable operations across hybrid cloud and edge footprints. The EU Data Act (Regulation (EU) 2023/2854) and the June 2026 CADA proposal (COM(2026) 502) raise the weight of interoperability, data handling, and sovereignty assessment in procurement, particularly among government and critical infrastructure buyers. Meanwhile, AI cluster buildouts extend networking requirements beyond traditional switching refresh cycles into end-to-end fabrics across the data center, campus, and edge, increasing demand for high-speed Ethernet (>100 GbE) and for autonomous operations tooling that reduces congestion and shortens troubleshooting cycles in multi-vendor environments.
Recent Industry Developments
- June 2026: Arista Networks announces XPO high-density liquid-cooled pluggable optics to power AI networking fabrics. The development introduces liquid-cooled optics for AI workloads, expanding high-density spine-leaf capabilities in European deployments. The move strengthens Arista's position in liquid-cooled, high-throughput data center fabrics across Europe.
- March 2026: Cisco Systems expands Secure AI Factory with NVIDIA support for RTX PRO 4500 Blackwell GPUs across UCS and Edge portfolios. The integration adds AI accelerators to the data center networking stack, enabling AI-ready deployments. The enhancement strengthens Cisco’s Europe sovereign deployment capabilities and widens its AI-oriented offerings.
- February 2026: Cisco unveils Silicon One G300 102.4 Tbps switching silicon for massive AI cluster buildouts with new N9000 and 8000 systems with liquid cooling. The next-gen switching silicon targets 100+ Tbps AI workloads, enabling large-scale European deployments. The move positions Cisco at the forefront of AI data center fabric and supports expanding regional capacity.


Research Methodology Framework and Report Scope
Market Definition and Coverage
This market covers spending in Europe on networking hardware, software, and related services that are deployed inside data centers or used to interconnect data center resources, where the purpose is to move, secure, and manage data traffic across the facility.
Scope exclusions: This sizing does not count general enterprise campus networking that is not used for data center operations, even if the same product families are used in both environments.
Segmentation Overview
- By Component
- Products
- Ethernet Switches
- Routers
- Storage Area Network (SAN)
- Application Delivery Controllers (ADC)
- Network Security Appliances
- Software-Defined Networking (SDN) Controllers
- Optical Interconnects
- Services
- Installation and Integration
- Training and Consulting
- Support and Maintenance
- Managed Network Services
- Products
- By End-User
- IT and Telecommunications
- Banking, Financial Services and Insurance (BFSI)
- Government and Defense
- Media and Entertainment
- Healthcare and Life Sciences
- Manufacturing and Industrial
- Other End-Users
- By Data-Center Type
- Colocation
- Hyperscalers/Cloud Service Providers
- Edge/Micro Data Centers
- By Bandwidth
- Less Than or equals to 10 GbE
- 25–40 GbE
- 50–100 GbE
- Greater than 100 GbE
- By Country
- United Kingdom
- Germany
- France
- Netherlands
- Ireland
- Spain
- Italy
- Sweden
- Denmark
- Norway
- Poland
- Austria
- Belgium
- Switzerland
- Rest of Europe
Data Sources, Market Sizing, and Validation
Desk Research
Desk research sets the guardrails for what should be counted and provides base activity signals that networking demand typically follows. We anchored the Europe view using public infrastructure and connectivity indicators, including Eurostat digital economy tables, European Commission digital and connectivity releases, and national regulator publications where available. Data center build and utilization context was also cross-checked using sources such as Uptime Institute public research, IEA electricity and data center notes, and technical standards and guidance from bodies like ETSI and the IETF.
To translate these signals into a practical market model, we reviewed supplier public disclosures, annual reports, and investor decks to understand product revenue mixes and regional exposure. We then compared those findings with reputed press coverage of capacity additions and interconnect announcements. Patent databases were used selectively to sanity-check which networking capabilities were being prioritized over time, for example higher-speed Ethernet and automation features. The list above is illustrative, and many other public sources were also referenced for collection, validation, and clarification during the research process.
Primary Interviews and Surveys
Primary interviews and surveys were used to turn the desk view into realistic sizing inputs, especially where public data does not describe what is deployed inside facilities. We spoke with equipment suppliers, integrators, colocation operators, cloud and enterprise buyers, and channel partners across major European hubs. After each round, we reconciled differences in views through follow-up questions. These discussions helped confirm replacement cycles, typical port-speed migration timing, service attach rates, and how pricing moves when customers shift from 10/25/100 GbE toward higher speeds.
Distribution of primary research fieldwork respondents
| Company type | Respondent position |
|---|---|
| Top tier: 35% | CXOs: 12% |
| Mid tier: 51% | Functional/Unit leaders: 41% |
| Smaller Players: 14% | Managers: 47% |
Market-Sizing & Forecasting
Sizing starts from a top-down reconstruction that links European data center activity to networking demand, where installed IT load growth, facility expansions, and interconnect build-outs are converted into expected refresh and incremental equipment needs. We then corroborated totals with selective bottom-up checks, sampling typical bill-of-material shares for switching, routing, security, and optical interconnect. After that, we stress-tested the implied ASPs against what buyers and channel participants described.
A few practical inputs were tracked closely because they explain most swings in spending. These include port-speed mix shifts (10/25/100/400 GbE and above), average ports per rack trends driven by virtualization and AI-ready designs, deployment preference for spine-leaf fabrics, optical link density for east-west traffic, and the share of spending delivered as services versus product-only. Where direct visibility was patchy for smaller countries or edge-style deployments, gaps were handled by applying validated adoption ratios from comparable markets and adjusting for known local build pipelines.
Forecasts were prepared using scenario analysis supported by a light multivariate regression. The dependent series was market spend, and the key drivers included forecast IT load additions, announced capacity timelines, and expected price erosion by speed class. Final growth paths were reviewed with primary inputs so the forecast reflects what procurement teams are planning, not only what macro indicators imply.
Data Validation & Update Cycle
Validation is done in layers so the final numbers stay tied to observable signals. We compare modeled results against independent indicators such as data center capacity additions, interconnection expansion activity, and public supplier commentary about regional demand. If variance looks out of range, we investigate and adjust assumptions as needed. Clarifying questions are then sent back to selected respondents before internal sign-off is completed.
Each report is refreshed on an annual cycle, and interim updates are made when material events change demand patterns, including major capacity delays, pricing step-changes at key speeds, or regulatory shifts that alter build plans. Before delivery, the latest public releases are rechecked so clients receive an updated view rather than an older model snapshot.
Mordor Intelligence's Europe Data Center Networking Market Size Measured Against Other Published Estimates
Published market sizes for Europe data center networking can vary widely because counting rules are not always the same. Differences usually come from what is treated as data center specific versus general networking, how services are handled, and whether numbers reflect booked shipments or recognized revenue timing.
The spread is also shaped by how price changes are modeled across port speeds, how quickly buyers are assumed to migrate to higher-speed links, and how Europe is constructed, for example country build-up versus applying a fixed share of a global total. The table below summarizes these typical gap drivers in a practical way.
Benchmark comparison
| Source | Market Size | Gaps in Research Methodology |
|---|---|---|
| Mordor Intelligence | USD 7.78 B (2025) | |
| Regional Consultancy A | USD 8.33 B (2024) | Uses shipment-year booking to represent market value and applies an aggressive refresh assumption for switching, which can pull demand forward compared to revenue recognition timing. |
| Industry Journal B | USD 9.17 B (2025) | Rolls adjacent enterprise LAN spending into the total and estimates Europe as a simple share of global networking, which can overstate demand in countries with slower capacity additions. |
The benchmark table shows a clear spread, and in the Mordor Intelligence model the total is built around data center deployed networking, including optical interconnect and services only when tied to data center projects, which avoids mixing in general enterprise LAN demand. After the scope is fixed, the final value is checked against capacity growth signals and primary-confirmed speed-mix pricing, so the result stays traceable to inputs a buyer can pressure-test and repeat.


Key Questions Answered in the Report
What is the projected value of the Europe data center networking market by 2031?
The market is forecast to reach USD 11.58 billion by 2031, supported by a 6.85% CAGR driven by AI infrastructure expansion and edge computing deployments.
Which component category currently leads spending?
Ethernet switches lead with 34.78% 2025 revenue share, reflecting their central role in spine-leaf and AI cluster networks.
Why is Spain the fastest-growing national market?
Spain benefits from cloud-first government policy, abundant renewable energy and strategic subsea cable routes, producing a 10.18% CAGR outlook to 2031.
What bandwidth tier is expanding most quickly?
Links above 100 GbE, particularly 400 GbE and 800 GbE, show the highest 12.74% CAGR as hyperscalers upgrade AI fabrics.
How will the HPE–Juniper merger affect competitive dynamics?
If completed, the merger would combine compute, storage and network portfolios, creating a stronger challenger to Cisco while potentially reshaping partner ecosystems across Europe.
Page last updated on:
- France Data Center Networking Market
- United Kingdom Data Center Networking Market
- Germany Data Center Networking Market
- China Data Center Networking Market
- Italy Data Center Networking Market
- Japan Data Center Networking Market
- South Korea Data Center Networking Market
- Sweden Data Center Networking Market
- Norway Data Center Networking Market
- Netherlands Data Center Networking Market
- Data Center Server Market Servers across all regions, split by tier, facility size and facility type.
- Data Center Construction Market Construction worldwide, split by tier, facility size and facility type.
- Artificial Intelligence (AI) Data Center Market AI facilities worldwide, split by facility type, component and tier.
- Europe Data Center Storage Market Storage in Europe, split by storage technology, storage type and end user.





