Europe Data Center Construction Market Size and Share
Market Overview
| Study Period | 2020 - 2031 |
|---|---|
| Forecast Data Period | 2026 - 2031 |
| Historical Data Period | 2020 - 2024 |
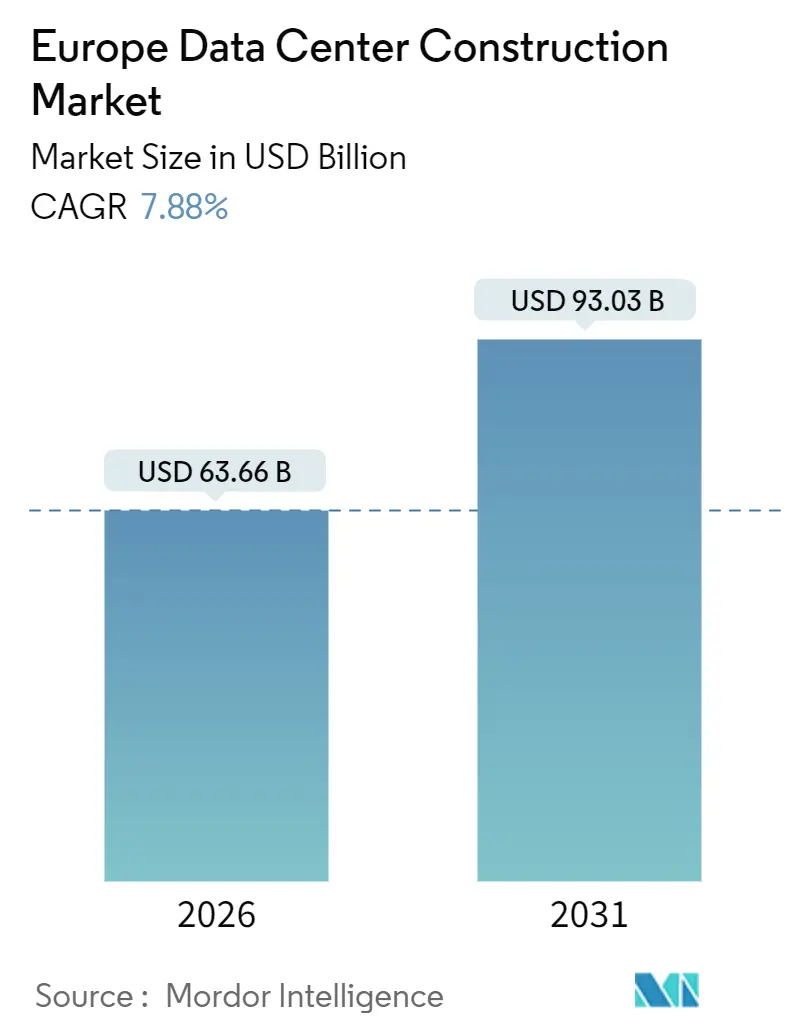
| Market Size (2026) | USD 63.66 Billion |
| Market Size (2031) | USD 93.03 Billion |
| Growth Rate (2026 - 2031) | 7.88% CAGR |
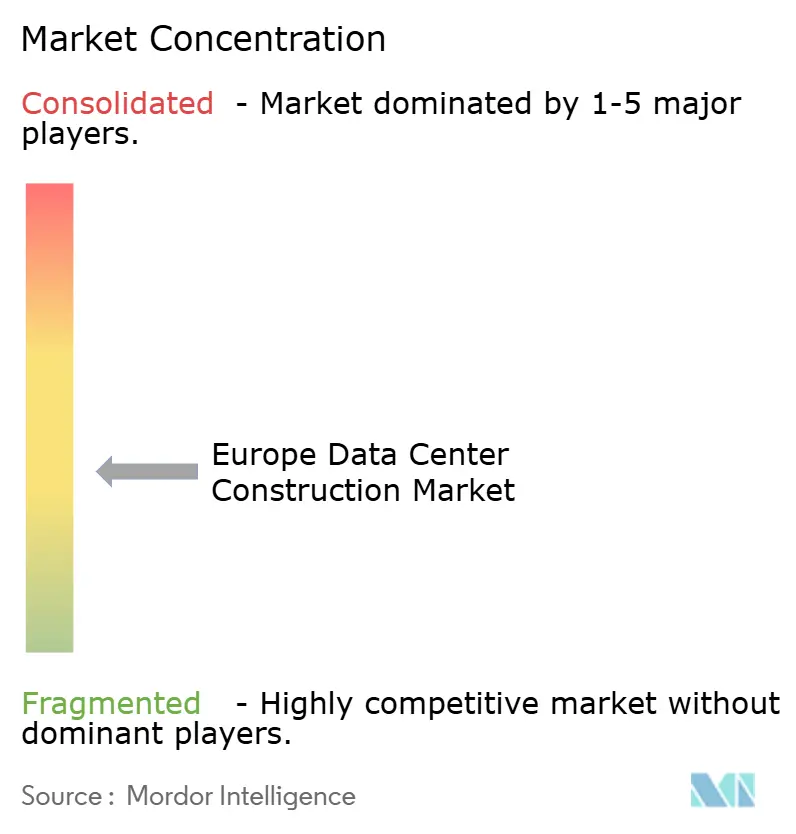
| Market Concentration | Medium |
Major Players *Disclaimer: Major Players sorted in no particular order Image © Mordor Intelligence. Reuse requires attribution under CC BY 4.0. | |
Europe Data Center Construction Market Analysis by Mordor Intelligence
The Europe data center construction market size stands at USD 63.66 billion in 2026 and is projected to reach USD 93.03 billion by 2031, advancing at a 7.88% CAGR over the forecast period. The surge reflects sovereign-cloud mandates, hyperscale capacity build-outs, and the rapid shift to AI-native architectures that demand rack densities of 50-100 kilowatts. Operators are re-engineering electrical backbones around 400-volt direct-current topologies while liquid-cooling retrofits pull mechanical spending ahead of structural work. Prefabricated power rooms, modular chillers, and onsite battery storage compress lead times, an advantage as grid-connection queues in key metros stretch to double-digit years. Meanwhile, Nordic wholesale power prices below EUR 0.06 per kilowatt-hour in 2025 position Sweden and Finland as magnets for new hyperscale announcements.
Key Report Takeaways
- By tier type, tier 3 held 57.14% of Europe data center construction market share in 2025, while Tier 4 is set to expand at an 8.42% CAGR through 2031.
- By data center size, hyperscale builds captured 60.75% of Europe data center construction market size in 2025 and are growing at an 8.23% CAGR through 2031.
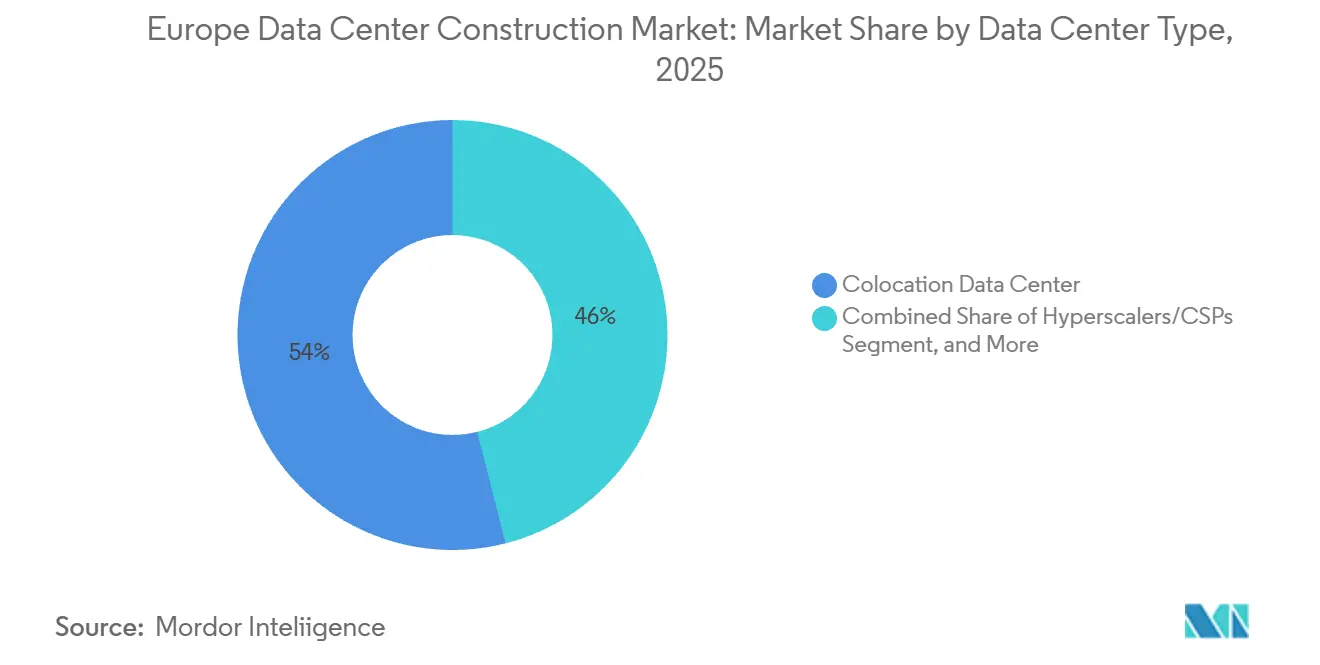
- By data center type, colocation led the Europe data center construction market with 53.98% market share in 2025, yet cloud service providers are advancing at an 8.53% CAGR.
- By infrastructure category, mechanical systems are growing fastest at an 8.65% CAGR, even though electrical gear still accounted for 41.95% of 2025 spending.
- By country, Germany accounted for 18.54% of 2025 revenue, and Spain represents the fastest-growing market with a 9.21% CAGR through 2031.
Note: Market size and forecast figures in this report are generated using Mordor Intelligence’s proprietary estimation framework, updated with the latest available data and insights as of January 2026.
Europe Data Center Construction Market Trends and Insights
Drivers Impact Analysis*
| Driver | (~) % Impact on CAGR Forecast | Geographic Relevance | Impact Timeline |
|---|---|---|---|
| Rising Generative-AI and Big-Data Workloads | +2.1% | Germany, United Kingdom, France, Nordics | Medium term (2-4 years) |
| Surge in Hyperscale and Colocation Build-Outs | +1.8% | Germany, United Kingdom, France, Netherlands | Short term (≤ 2 years) |
| Cloud Service Provider Regional Expansion | +1.5% | Germany, France, Spain, Italy, Nordics | Medium term (2-4 years) |
| EU Green Deal Waste-Heat Reuse Incentives | +1.2% | Germany, France, Denmark, Finland | Long term (≥ 4 years) |
| Nordic Renewable-Energy PPAs Lowering TCO | +0.9% | Sweden, Finland, Norway, Denmark | Medium term (2-4 years) |
| Prefabricated Modular Power Rooms Adoption | +0.4% | United Kingdom, Germany, France | Short term (≤ 2 years) |
| Source: Mordor Intelligence | |||
Rising Generative-AI and Big-Data Workloads
GPU clusters that draw 50-100 kilowatts per rack are redefining design baselines, prompting operators to deploy liquid-cooled racks across flagship campuses. Microsoft’s Swedish facilities reached power-usage-effectiveness ratios below 1.2 in 2024, a threshold unattainable with air cooling. Training runs for frontier models run uninterrupted for weeks, pushing demand for Tier 4 fault-tolerant architectures despite a 20-30% cost premium. Enterprises that cannot meet latency targets in public clouds are retrofitting on-premises sites, accelerating orders for N+2 cooling loops and 400-volt uninterruptible power supplies. Generative-AI workloads are expected to dominate incremental capacity additions late in the decade, reshaping procurement toward high-density server enclosures. The shift also sharpens focus on grid resiliency, driving interest in on-site battery storage to mitigate brownouts during training cycles.
Surge in Hyperscale and Colocation Build-Outs
Hyperscale operators are consolidating loads into multi-campus estates that clear 1 gigawatt of IT capacity, enabling bulk renewable power purchase agreements at below-spot pricing. Amazon Web Services’ EUR 7.8 billion Brandenburg program spans three sites totaling 1.2 gigawatts, locking in long-term grid reservations.[1]Amazon Web Services, “AWS Announces Multi-Billion-Euro Investment in Germany,” aws.amazon.com Colocation specialists respond with powered-shell leases that let tenants fit bespoke cooling and network fabrics, a model Colt Data Centre Services advanced through EUR 2 billion (USD 2.4 billion) in German expansions in 2024. Average facility size for 2025 deliveries rose to 45 megawatts, up from 28 megawatts in 2020, intensifying demand for contractors capable of integrating modular power rooms at scale. The economies of scale also unlock cross-campus redundancy schemes, trimming reserve-capacity over-provisioning. These dynamics collectively boost construction intensity even in secondary metros such as Madrid and Milan.
Cloud Service Provider Regional Expansion
Sovereign-cloud mandates and ultra-low-latency use cases are triggering a wave of regional clusters. Google’s EUR 5.5 billion outlay across Germany and the Netherlands positions micro-regions in Berlin and Groningen to satisfy residency rules.[2]Google, “Expanding Our Infrastructure in Europe,” cloud.google.com Microsoft’s EUR 3.2 billion (USD 3.8 billion) Dataland campus in North Rhine-Westphalia will anchor Azure Government zones for defense and healthcare tenants. Regional diversification also solves edge-computing latency ceilings that autonomous-vehicle telemetry and industrial IoT flows need, requiring sub-20-millisecond round-trip times. Spain and Italy emerge as beneficiaries, with smaller 5-10 megawatt sites surrounding Madrid, Barcelona, Milan, and Rome. Construction demand, therefore, tilts toward adaptable shell-and-core designs that can land in constrained urban parcels while aligning with EU taxonomy-aligned sustainability metrics.
EU Green Deal Waste-Heat Reuse Incentives
The Energy Efficiency Directive, enforceable from 2025, obliges facilities above 1 megawatt to integrate heat-recovery systems where district networks exist. Germany’s 2024 implementation guidance hard-codes the requirement into municipal permitting.[3]Federal Ministry for Economic Affairs and Climate Action, “Waste Heat Recovery Guidelines for Data Centers,” bmwk.de Operators that couple data halls with local utilities gain a compliance moat and an ancillary revenue stream, evidenced by Microsoft’s campuses in Västerås and Stockholm that channel rejected heat into residential grids. Prefabricated skids bundling heat exchangers, sensors, and controls are shortening project cycles, making small-form deployments viable in suburban zones. Denmark and Finland lead in long-term heat-purchase agreements that monetize thermal output while shrinking scope-1 emissions. As reporting under the EU taxonomy tightens, waste-heat utilization rates will become a board-level KPI for financing.
Restraints Impact Analysis*
| Restraint | (~) % Impact on CAGR Forecast | Geographic Relevance | Impact Timeline |
|---|---|---|---|
| Escalating Power and Real-Estate Costs | -1.4% | United Kingdom, Germany, Netherlands | Short term (≤ 2 years) |
| Grid-Connection Approval Bottlenecks | -1.1% | United Kingdom, Ireland, Germany | Medium term (2-4 years) |
| Stricter EU Taxonomy on Non-Green Materials | -0.6% | Germany, France, Netherlands, Nordics | Long term (≥ 4 years) |
| Skilled-Labour Gap for Advanced Commissioning | -0.5% | United Kingdom, Germany, France | Medium term (2-4 years) |
| Source: Mordor Intelligence | |||
Escalating Power and Real-Estate Costs
Industrial electricity in Germany and the United Kingdom averaged EUR 0.15-0.25 (USD 0.18-0.30) per kilowatt-hour in 2025, translating into USD 11.9-19.8 million in annual power costs for a 10-megawatt site operating at 80% utilization. Frankfurt land crossed EUR 1,200 per square meter in 2025, up 40% from 2022, as operators chase parcels with pre-existing grid access. The United Kingdom’s property tax formula, pegged to replacement cost, adds USD 10-15 million per year to a 20-megawatt build. These pressures divert investment toward lower-cost secondary metros and drive the popularity of multi-year renewable PPAs in the Nordics, where wholesale rates sit below EUR 0.06 per kilowatt-hour. Developers are also pivoting to vertical data halls and rooftop solar canopies to stretch constrained footprints, though such adaptations increase structural steel tonnage and upfront capital costs.
Grid-Connection Approval Bottlenecks
Transmission operators in the United Kingdom quote 10-15-year lead times for capacity in London and the Southeast, forcing developers to pre-reserve megawatts years before any concrete is poured. Ireland’s moratorium on new Dublin-area connections, first imposed in 2022 and still effective in 2025, similarly throttles expansion. In Germany, connections above 10 megawatts trigger environmental assessments and town-hall consultations, inserting an extra 18-24 months into schedules. These delays steer construction toward regions with surplus transmission capacity, including Brandenburg and Schleswig-Holstein, where offshore wind build-outs backstop capacity. Some operators deploy onsite battery farms and diesel generators to shave grid draw, yet doing so lifts capital intensity by up to 20% and complicates emissions accounting. The European Commission’s 2024 Grid Action Plan promises permitting relief, but timelines remain uncertain, reinforcing the premium on sites with legacy substations.
*Our forecasts treat driver/restraint impacts as directional, not additive. The impact forecasts reflect baseline growth, mix effects, and variable interactions.
Segment Analysis
By Tier Type: Mission-Critical Investment Tilts Toward Tier 4
Tier 3 captured 57.14% of Europe data center construction market spending in 2025, reflecting its balance between budget and uptime. Europe data center construction market size allocated to Tier 4 is growing at an 8.42% CAGR as financial services and government tenants press for 99.995% availability. Fault-tolerant 2N+1 redundancy eliminates single points of failure, a prerequisite for instant-settlement payment rails and defense command systems. Operators absorb the 20-30% capex premium because downtime penalties far outweigh initial costs. Frankfurt and London see the heaviest Tier 4 demand, though grid capacity constraints are redirecting projects to Brandenburg and Wales. Modular switchgear and hot-swappable UPS skids are standardizing Tier 4 deployments, trimming engineering cycles. Cloud providers experimenting with hybrid designs - Tier 4 for power and Tier 3 for cooling - reflect a nuanced risk-tiering strategy.
Tier 1 and Tier 2 builds fell below 10% of Europe data center construction market share in 2025 as operators abandon non-redundant layouts. Small and medium enterprises still accept Tier 3 colocation suites on cost grounds, but rising AI inference loads may stretch those architectures. European insurers are adding premium surcharges for Tier 3 outages, accelerating migration to higher tiers. Meanwhile, EU taxonomy rules favoring fault tolerance for critical infrastructure tilt financing toward Tier 4 bonds. Component vendors respond with pre-certified Tier 4 kits, compressing commissioning to under 20 months. The interplay between generative-AI density and uptime risk thus reinforces the Tier 4 trajectory.


By Data Center Size: Hyperscale Estates Dominate Capital Allocation
Hyperscale campuses secured 60.75% of Europe data center construction market size in 2025, advancing at an 8.23% CAGR through 2031. Facilities in the 50-250 megawatt bracket let operators bargain for multi-gigawatt renewable PPAs, smoothing energy cost curves. Europe data center construction market share for hyperscale builds benefits from consolidation economies, particularly in power shell and heat-exchanger procurement. Brandenburg, Groningen, and Västerås headline deal flow, where local governments fast-track permits for large-scale renewable integrations. Investors prize the predictable cash flows of hyperscale anchor leases, lowering weighted average cost of capital against smaller formats.
Large (10-50 megawatt) and medium (2-10 megawatt) facilities retain a role in regional aggregation networks, feeding edge nodes while providing burst capacity. Edge and micro-edge sites under 2 megawatts proliferate in urban cores to guarantee sub-20-millisecond latency for autonomous vehicles and industrial-IoT telemetry. Prefabricated container modules, deployable on retail-park car lots, compress construction to 12-18 months. Average hyperscale project scope climbed from 28 megawatts in 2020 to 45 megawatts in 2025, a trend likely to continue as chip roadmaps push thermal envelopes upward. Google’s Groningen campus targets 200 megawatts at full build, illustrating the trajectory.
By Data Center Type: Colocation Leads While Cloud Self-Builds Accelerate
Colocation commanded 53.98% of Europe data center construction market spending in 2025, but cloud providers are expanding at an 8.53% CAGR as they internalize workloads. Enterprises lacking scale capitalize on colocation’s shared power and cooling, yet rising density requirements prompt powered-shell leases that blur lines with wholesale models. Colt’s EUR 2 billion (USD 2.4 billion) German rollout exemplifies the pivot, delivering flexible footprints for AI workloads. Tenant mix is diversifying, with healthcare and fintech clients demanding dedicated suites inside larger campuses to manage data-sovereignty risks.
Cloud hyperscalers, spurred by residency laws, embed regional availability zones within sovereign boundaries, driving the Europe data center construction market toward single-tenant builds. Microsoft’s Azure Government zones occupy dedicated halls inside multibuilding campuses, leveraging shared substations while preserving logical isolation. Enterprise data centers continue to shrink as on-prem workloads lift to SaaS and PaaS environments. Edge formats gain favor in transportation and public-safety sectors, where containerized pods can be rooftop-mounted at train stations to meet video analytics latency thresholds. Regulatory scrutiny on cross-border data transfers further cements regional multicloud strategies.
By Infrastructure: Mechanical Systems Overtake Electrical in Growth Momentum
Electrical gear still represented 41.95% of 2025 spend, but mechanical systems are rising at an 8.65% CAGR, outpacing all other categories. Liquid-cooling retrofits dominate capex, with rear-door heat exchangers and direct-to-chip loops slashing fan energy by up to 90%. Europe data center construction market size dedicated to mechanical upgrades grows as operators chase power-usage-effectiveness below 1.15. Microsoft’s 2024 Swedish rollout removed computer-room air handlers entirely, proving viability at scale. Mechanical suppliers capitalize by bundling skid-mounted pumps, heat exchangers, and smart valves into turnkey offerings.
Power architectures are shifting to 400-volt direct current, lowering conversion losses by 3-5 percentage points and easing integration of battery energy-storage systems. Diesel generators lose share to lithium-ion and vanadium-flow batteries as operators target net-zero commitments. Prefabricated electrical rooms shorten installation by 30-40%, an edge valued in backlogged grid areas. General construction still accounts for roughly one-quarter of budgets, but design-for-manufacture principles reduce onsite labor, mitigating skilled-worker shortages. Services spend climbs as ISO 50001 certification and EU taxonomy reporting necessitate specialist audit work. The combined momentum propels mechanical and electrical innovation to the forefront of procurement strategies.
Geography Analysis
Germany remains the largest node in the Europe data center construction market spending, buoyed by Frankfurt’s interconnection density and federal digital sovereignty policy. In 2025, Germany captured 18.54% of the revenue share, while Spain emerged as the fastest-growing market, boasting a 9.21% CAGR projected through 2031. Amazon’s EUR 7.8 billion (USD 9.3 billion) Brandenburg estates, totaling 1.2 gigawatts, headline investment, while Google’s EUR 5.5 billion (USD 6.6 billion) multi-city expansion reinforces sovereign-cloud footprints. Microsoft’s Dataland project adds Azure Government capacity in North Rhine-Westphalia. Grid constraints in Frankfurt steer developers toward Brandenburg and Schleswig-Holstein, where offshore-wind surplus backs grid resiliency. Federal waste-heat guidelines published in 2024 revitalize Munich and Hamburg projects that integrate with district-heating grids.
The United Kingdom ranks second, anchored by London’s finance sector and supplemented by Manchester’s emergence as a secondary hub. Amazon pledged GBP 8 billion (USD 11 billion) to expand London zones and establish edge nodes in Birmingham and Edinburgh. Transmission headroom issues in the Southeast reroute builds to Scotland and Wales, where tidal and wind resources supply cost-effective power. France follows, with Paris and Marseille benefiting from Colt’s EUR 2.3 billion (USD 2.8 billion) outlay focused on hybrid-cloud tenancy. France’s 2030 digital strategy incentivizes domestic cloud with grants for waste-heat reuse infrastructure, accelerating municipal partnerships.
Spain emerges as the fastest-growing market, while Italy evolves into latency-driven secondary markets. Madrid and Barcelona colocation builds serve Iberian enterprise demand, while Milan and Rome attract cloud zones meeting EU residency rules. The Nordic bloc commands a disproportionate haul of hyperscale announcements thanks to wholesale power pricing below EUR 0.06 (USD 0.07) per kilowatt-hour in 2025. Microsoft’s EUR 3.3 billion (USD 3.95 billion) Swedish spend integrates heat-reuse arrangements that qualify for EU taxonomy incentives. The rest of Europe - Netherlands, Belgium, and Switzerland - retains importance for interconnection neutrality, with Amsterdam and Zurich sustaining finance-sector edge workloads.
Competitive Landscape
Europe data center construction market features fragmentation, with global EPC giants contending against regional specialists and prefab module vendors. AECOM, Jacobs Solutions, and DPR Construction leverage digital-twin tools to accelerate mechanical-electrical-plumbing layout iterations, trimming rework, and enhancing schedule certainty. Regional players such as Mercury Engineering and Collen Construction win contracts by specializing in liquid-cooling retrofits and high-density commissioning across Ireland and the United Kingdom. Prefabricated power rooms and cooling modules, capable of shaving commissioning timelines by up to 40%, have become table stakes offerings among bidders.
Edge-facility construction presents white-space potential. Operators seek sub-1-megawatt rooftops or parking-lot deployments that conventional contractors overlook, allowing modular vendors to carve niche share with containerized data halls. Battery-storage integrators partner with EPC firms to bundle 20-40 megawatt battery farms and rooftop solar arrays, helping clients secure EU taxonomy-aligned financing. Liquid-cooling system integrators emerge as influential subcontractors as generative-AI densities root into mainstream builds. ISO 50001 and EN 50600 certifications act as differentiators during tender evaluations, with operators scoring bids on proven ability to meet energy-management criteria.
Competitive strategy increasingly hinges on speed-to-market given grid-approval bottlenecks. Contractors with established prefab supply chains can mobilize kits within 10 weeks, a compelling value proposition for hyperscalers obligated to deliver capacity inside 24 months. Meanwhile, joint ventures between builders and heat-network utilities unlock co-development synergies, evidenced by Digital Realty’s Marseille alliance that monetizes waste heat while fast-tracking permits. The convergence of mechanical innovation, sustainability compliance, and permitting agility therefore dictates competitive positioning into the next decade.
Europe Data Center Construction Industry Leaders
NTT Ltd. (wholly-owned by NTT DATA Inc.)
CBRE Group Inc.
Bouygues Energies and Services SAS
ISG plc
DPR Construction
- *Disclaimer: Major Players sorted in no particular order

Recent Industry Developments
- January 2026: Amazon Web Services injected an additional EUR 1.2 billion (USD 1.4 billion) into its Brandenburg campus, adding 300 megawatts of AI-optimized capacity, liquid cooling, and onsite batteries.
- December 2025: Microsoft revealed a EUR 800 million (USD 904 million) expansion of its Dataland campus in North Rhine-Westphalia, upgrading to Tier 4 power and integrating district-heating connections.
- November 2025: Colt Data Centre Services received approval for a 40-megawatt Frankfurt build using prefabricated power rooms and direct-to-chip cooling, targeting a power-usage-effectiveness below 1.15.
- October 2025: Google allocated an extra EUR 1.5 billion (USD 1.7 billion) to scale its Groningen site to 250 megawatts, backed by a 15-year offshore-wind PPA.


Research Methodology Framework and Report Scope
Market Definitions and Key Coverage
Our study treats the Europe data center construction market as the annual value of electrical, mechanical, and general-construction contracts awarded for new build or major expansion projects that reach initial fit-out in the 27 EU states, the U.K., EFTA, and EU-candidate nations. Spending linked to racks, servers, network gear, and ongoing facility maintenance is excluded, so the focus stays on bricks, steel, power, and cooling systems that create fresh IT-ready capacity.
Scope exclusion: we leave out refurbishment budgets that extend the life of existing halls without adding net white-space.
Segmentation Overview
- By Tier Type
- Tier 1 and 2
- Tier 3
- Tier 4
- By Data Center Size
- Small
- Medium
- Large
- Hyperscale
- By Data Center Type
- Colocation Data Center
- Hyperscalers/Cloud Service Provider (CSPs)
- Enterprise and Edge Data Center
- By Infrastructure
- Electrical Infrastructure
- Power Distribution Solution
- Power Backup Solutions
- Mechanical Infrastructure
- Cooling Systems
- Racks and Cabinets
- Servers and Storage
- Other Mechanical Infrastructure
- General Construction
- Services - Design and Consulting, Integration, Support and Maintenance
- Electrical Infrastructure
- By Country
- Germany
- United Kingdom
- France
- Italy
- Spain
- Rest of Europe
Detailed Research Methodology and Data Validation
Primary Research
We interview design-build contractors, specialist MEP suppliers, and colocation operators across FLAP-D, Nordics, and CEE. Discussions clarify typical $/MW outlays, lead-time shifts, tier-mix intentions, and pricing pressure points, letting our team validate desk assumptions and fine-tune regional multipliers.
Desk Research
Mordor analysts begin with public datasets such as Eurostat building-permit filings, Uptime Institute tier certifications, ENTSO-E grid-connection records, national land registries, and trade-association briefings from bodies like the European Data Centre Association. Company filings, investor decks, and reputable press articles enrich CapEx benchmarks and reveal hyperscale site pipelines. Where gaps persist, subscription resources, including D&B Hoovers for contractor revenues and Dow Jones Factiva for project announcements, anchor cost curves. This source list is illustrative; many additional references support verification and context building.
Market-Sizing & Forecasting
A top-down model reconstructs regional spend from announced MW pipelines, average $/MW construction costs, and expected commissioning lags before being cross-checked with selective bottom-up roll-ups from ten large contractors. Key variables like median build cost per MW, annual IT-load additions, share of Tier 3 vs Tier 4 halls, steel and diesel price indices, and exchange-rate trends feed a multivariate regression that projects value through 2030. Where country-level data are thin, we gap-fill using recent tender values adjusted by local labor-cost indices and power-availability constraints.
Data Validation & Update Cycle
Each output passes a variance screen against independent indicators such as transformer imports and substation energizations. Senior reviewers sign off after anomaly checks, and we refresh the model yearly, triggering interim reviews after material project deferrals or cost-run-ups.
Why Mordor's Europe Data Center Construction Baseline Commands Reliability
Published figures rarely align because analysts pick different geographical cuts, include or exclude retrofits, and apply divergent $/MW curves.
Key gap drivers stem from (i) whether refurbishments are counted, (ii) the choice of base cost curve: headline contract value vs turnkey cost, and (iii) refresh cadence; some providers project five-year-old inputs forward without fresh project checks, inflating or deflating totals.
Benchmark comparison
| Market Size | Anonymized source | Primary gap driver |
|---|---|---|
| USD 59.45 B (2025) | Mordor Intelligence | - |
| USD 49.50 B (2024) | Regional Consultancy A | omits edge builds and applies static €-to-$ rate |
| USD 47.10 B (2024) | Global Consultancy B | excludes Tier 4 sites, assumes uniform $/MW across Nordics and FLAP-D |
| USD 69.91 B (2024) | Industry Journal C | includes large-scale refurbishments and uptime retrofits in spend baseline |
Taken together, the comparison shows that scope breadth and variable selection drive most discrepancies. By anchoring values to verifiable MW pipelines, current material-cost trackers, and live contractor feedback, Mordor delivers a transparent, repeatable baseline investors can trust.


Key Questions Answered in the Report
How large is the Europe data center construction market in 2026 and how fast is it growing?
It is valued at USD 63.66 billion in 2026 and is projected to expand to USD 93.03 billion by 2031, registering a 7.88% CAGR.
Which facility tier is gaining the most traction among new builds?
Tier 4 designs are the fastest-growing, posting an 8.42% CAGR as financial-services and public-sector tenants demand 99.995% uptime.
Why are hyperscale operators favoring Nordic countries?
Wholesale electricity in Sweden and Finland averaged under EUR 0.06 per kilowatt-hour in 2025, significantly lowering operating costs and enabling renewable PPAs.
How are EU regulations shaping construction practices?
The Energy Efficiency Directive mandates waste-heat recovery for sites above 1 megawatt from 2025, accelerating integration with district-heating networks.
What technologies are being adopted to support AI-driven rack densities?
Operators are rolling out liquid-cooled racks, 400-volt DC power distribution, and onsite battery storage to handle 50-100 kilowatt per-rack loads while keeping PUE under 1.15.
Page last updated on:


