North America Data Center Construction Market Size and Share
Market Overview
| Study Period | 2020 - 2031 |
|---|---|
| Forecast Data Period | 2026 - 2031 |
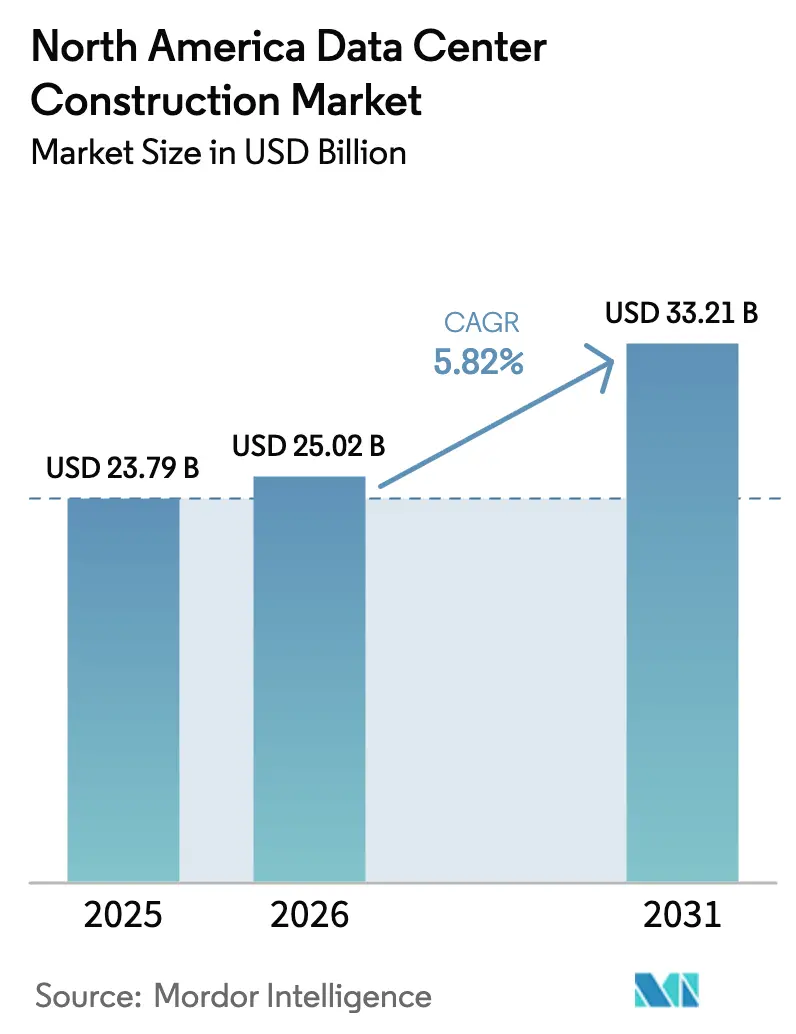
| Base Year Market Size (2025) | USD 23.79 Billion |
| Market Size (2026) | USD 25.02 Billion |
| Market Size (2031) | USD 33.21 Billion |
| Growth Rate (2026 - 2031) | 5.82% CAGR |
| Market Concentration | Medium |
Major Players *Disclaimer: Major Players sorted in no particular order Image © Mordor Intelligence. Reuse requires attribution under CC BY 4.0. | |
North America Data Center Construction Market Analysis by Mordor Intelligence
The North America data center construction market size is projected to be USD 23.79 billion in 2025, USD 25.02 billion in 2026, and reach USD 33.21 billion by 2031, growing at a CAGR of 5.82% from 2026 to 2031. Rising cloud and generative-AI workloads are steering capital toward hyperscale-ready campuses that can support 100+ kW rack densities, while proximity to wind and solar resources lowers lifecycle power costs and aligns with net-zero pledges. Transformer lead times that now stretch to two years are prompting early procurement strategies, and contractors are turning to prefabricated electrical and cooling modules to offset skilled-labor shortages. Competitive advantage hinges on locking in grid access ahead of interconnection queues, especially in Virginia, Texas, and Arizona, where wait times already exceed 18 months. Sustainability mandates are further reshaping site selection, with decommissioned coal sites gaining favor because they pair existing transmission lines with ready-to-sign renewable power purchase agreements.
Key Report Takeaways
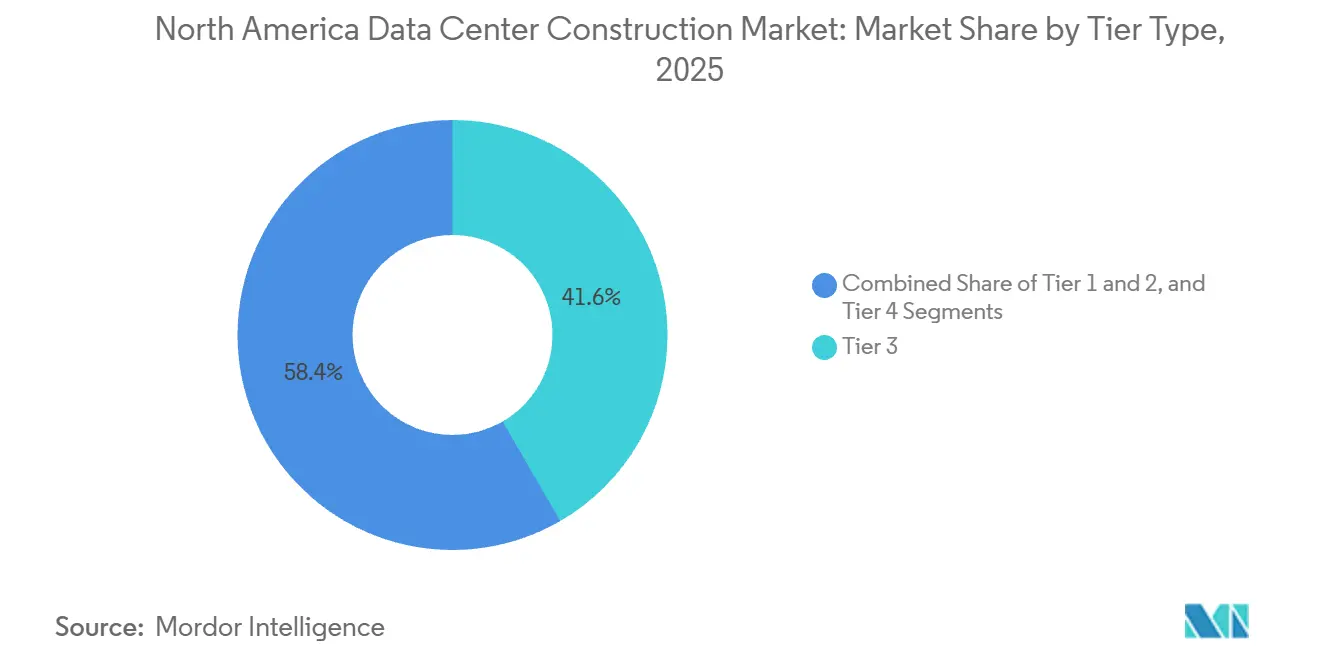
- By tier type, tier 3 facilities accounted for 41.64% of market share in 2025, whereas tier 4 builds are advancing at a 6.42% CAGR through 2031, reflecting demand for 2N+1 redundancy.
- By data center size, large-format builds held 54.43% of the North America data center construction market share in 2025, yet hyperscale campuses are pacing the field at a 6.76% growth rate.
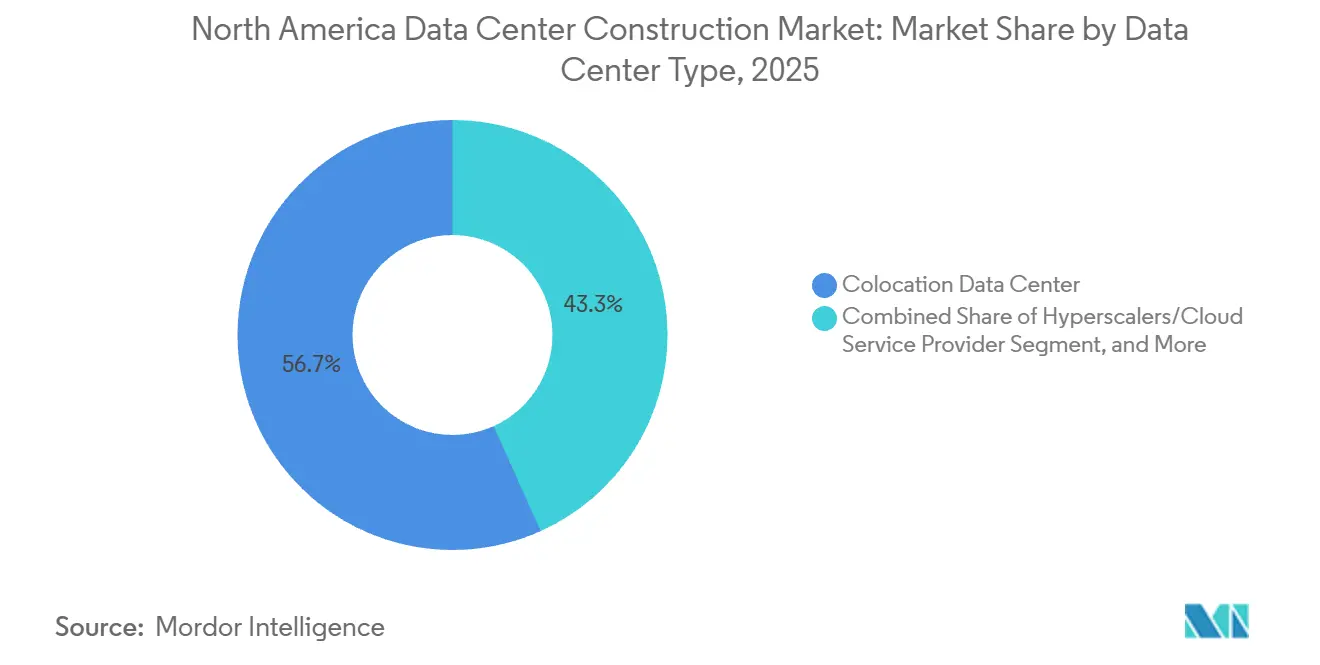
- By data center type, colocation operators accounted for 56.73% of the share in 2025, while hyperscaler and cloud service provider projects are accelerating at a 6.82% CAGR on the back of vertical integration.
- By infrastructure, electrical systems accounted for 35.38% of market share in 2025, but mechanical packages, especially liquid-cooling deployments, are expanding at 6.14% annually.
- By country, the United States accounted for 80.32% of the market share in 2025, while Mexico was the fastest riser, with 6.91% annual growth.
Note: Market size and forecast figures in this report are generated using Mordor Intelligence’s proprietary estimation framework, updated with the latest available data and insights as of 2026.
North America Data Center Construction Market Trends and Insights
Drivers Impact Analysis*
| Driver | (~) % Impact on CAGR Forecast | Geographic Relevance | Impact Timeline |
|---|---|---|---|
| Growing Cloud Applications, AI and Big Data Adoption | +1.8% | United States, Canada, with spillover to Mexico | Medium term (2-4 years) |
| Rising Hyperscale Data Center Roll-Outs | +1.5% | United States (Virginia, Texas, Arizona), Canada (Toronto, Calgary) | Short term (≤ 2 years) |
| Edge-Computing Demand Near 5G Hubs | +0.9% | United States urban centers, Canada metropolitan areas | Medium term (2-4 years) |
| Corporate Sustainability and Net-Zero Mandates | +0.7% | United States, Canada | Long term (≥ 4 years) |
| Surplus Grid Capacity in Decommissioned Coal Plant Sites | +0.5% | United States (Midwest, Appalachia) | Long term (≥ 4 years) |
| AI-Specific GPU Supply-Chain Clustering Near US Gulf Ports | +0.4% | United States (Texas, Louisiana Gulf Coast) | Medium term (2-4 years) |
| Source: Mordor Intelligence | |||
Growing Cloud Applications, AI and Big Data Adoption
Training clusters that embed 16,000-plus Nvidia H100 GPUs now draw 20-100 kW per rack, vastly outstripping the 5-10 kW seen in legacy enterprise rooms. Microsoft’s USD 100 billion Stargate project underscores a swing toward purpose-built campuses with on-site substations and liquid cooling that removes 80% of server heat at the chip. Colocation landlords are retrofitting for higher densities, yet many Tier 3 shells cannot accommodate the additional floor loading, spurring greenfield builds in power-rich regions. AI-centric growth also shifts design norms, prioritizing redundant medium-voltage feeds and 800-V DC backbones. The net result is a structural uplift in construction spending that keeps the North America data center construction market on a multi-year expansion path.
Rising Hyperscale Data Center Roll-Outs
Compass Datacenters, Centersquare, and PowerHouse collectively unveiled more than 4.8 GW of planned capacity in 2026, banking on multi-gigawatt campuses that ensure self-sufficiency from land purchase through commissioning. These operators are pre-ordering large transformers two years ahead to dodge supply chain bottlenecks flagged by the U.S. Department of Energy.[1] “Transformer Supply Chain Report 2024,” U.S. Department of Energy, energy.gov Integrated project delivery combining site prep, MEP build, and equipment installation under one contract is trimming schedules by up to 12 months. Hyperscaler presence also pulls fiber and renewable developers into the same zip codes, catalyzing local ecosystems that reinforce long-term demand. Such capital intensity is a key driver of the North America data center construction market.
Edge-Computing Demand Near 5G Hubs
More than 150,000 5G base stations installed by 2024 have set the stage for micro-data centers that live within 10-20 milliseconds of users.[2]“Ericsson Mobility Report 2024,” Ericsson, ericsson.com Modular enclosures between 50 and 500 kW can be factory-built, shipped, and brought online inside 12 months, a schedule that shields projects from craft-labor shortages. These sites often land in dense metro cores where real estate is scarce, prompting stacked designs that exploit rooftop or parking-deck footprints. Prefabrication standardizes cooling, fire, and power subsystems, enabling scaling across multiple cities at reduced cost. Edge deployments therefore widen the addressable footprint of the North America data center construction market beyond traditional hyperscale corridors.
Corporate Sustainability and Net-Zero Mandates
Google, Apple, and Meta already match 100% of data-center loads with renewables, a milestone that influences land-purchase checklists to favor wind- or solar-rich grids.[3]“Google Sustainability Report 2025,” Google, google.com Co-locating facilities with utility-scale renewables slashes transmission losses but forces the addition of battery systems that add 10-15% upfront cost. Operators now seek ISO 50001 energy-management and LEED Gold scores as table stakes, nudging contractors toward high-performance envelopes, recycled-water loops, and low-GWP refrigerants. Net-zero aspirations also encourage repurposing coal-plant brownfields that already possess substation infrastructure and rail access for heavy equipment. Sustainability targets, once peripheral, have become a core buying criterion that shapes capital flows inside the North America data center construction market.
Restraints Impact Analysis*
| Restraint | (~) % Impact on CAGR Forecast | Geographic Relevance | Impact Timeline |
|---|---|---|---|
| Escalating Power and Real-Estate Costs | -0.9% | United States (Virginia, Texas, Arizona), Canada (Toronto) | Short term (≤ 2 years) |
| Skilled Electrical and Mechanical Labor Shortage | -0.7% | United States, Canada | Medium term (2-4 years) |
| Multi-Year Lead Times for Large Power Transformers | -0.5% | United States, Canada | Medium term (2-4 years) |
| Community Opposition to High-Water-Use Cooling Systems in Arid States | -0.3% | United States (Arizona, Nevada, Utah) | Long term (≥ 4 years) |
| Source: Mordor Intelligence | |||
Escalating Power and Real-Estate Costs
Prime land in Loudoun County surpassed USD 1 million per acre in 2025 while wholesale power prices in ERCOT averaged 8.2 ¢/kWh, up 34% year-over-year. Lengthy PJM interconnection queues now top 200 GW, forcing developers to wait as long as 36 months before tapping the grid. Higher carrying costs erode colocation margins locked into fixed-price leases inked before 2024. Many builders are shifting toward secondary markets, but these areas often lack dense fiber routes, offsetting the savings in land and electricity. The near-term squeeze tempers the otherwise solid growth profile of the North America data center construction market.
Skilled Electrical and Mechanical Labor Shortage
Eighty-nine percent of U.S. contractors reported difficulty filling craft roles in 2024, with electricians and HVAC technicians in shortest supply. Meeting Tier 4 redundancy or liquid-cooling requirements calls for specialized certifications that take up to five years to earn. Labor scarcity adds 15-20% to project costs and pushes schedules out by half a year in Northern Virginia and Phoenix. Prefabrication helps but demands capital for factory lines and inventory control not every firm can finance. The talent gap, therefore, acts as a structural speed governor on the North America data center construction market.
*Our forecasts treat driver/restraint impacts as directional, not additive. The impact forecasts reflect baseline growth, mix effects, and variable interactions.
Segment Analysis
By Tier Type: Fault-Tolerant Designs Gain Momentum
Tier 4 is expected to grow at a CAGR of 6.42% during the forecast period, as financial services and cloud giants demanded 99.995% availability. Tier 3 still led in 2025 with 41.64% of the North America data center construction market share, balancing uptime and budget for e-commerce and SaaS tenants. Lithium-ion UPS modules now cut footprint 40%, letting Tier 3 operators squeeze more revenue racks per square foot. Tier 4 projects, meanwhile, adopt rotary UPS and dual utility feeds, which increase land requirements but narrow the cost premium over Tier 3. The move toward higher tiers injects engineering complexity that raises average project value, expanding the North America data center construction market pool available to contractors.
Across the forecast horizon, banking and healthcare compliance rules will keep Tier 4 growth above the headline CAGR, while edge-oriented Tier 1-2 sites persist for latency-sensitive services. The ongoing mix shift encourages vendors of generators, ATS, and switchgear to broaden product lines for multiple redundancy schemes. Consequently, the North America data center construction industry is poised to diversify its service stack, from fault-tolerant new builds to modular Tier 2 edge pods.


By Data Center Size: Hyperscale Footprints Re-Define Site Economics
Large facilities between 10 and 50 MW secured 54.43% share in 2025; however, sites exceeding 100 MW are scaling at a 6.76% CAGR. A single hyperscale campus can absorb 200 acres, altering county zoning patterns and requiring separate substations that lock up three years of transformer supply. The North America data center construction market size for these mega-projects dwarfs traditional enterprise budgets, attracting global EPC consortia. Yet small (sub-5 MW) builds remain vital for 5G edge and disaster-recovery roles, especially where urban real estate limits expansion.
Hyperscale growth is spurring molten-salt and hydrogen-ready backup systems as operators hunt for diesel alternatives. Simultaneously, modular suppliers are standardizing 2-MW blocks that stack to 10 MW, allowing medium-size entrants to compete without buying vast tracts of land. This bimodal demand pattern ensures balanced opportunity across the North America data center construction market.
By Data Center Type: Vertical Integration Reshapes Procurement
Colocation remained dominant at 56.73% in 2025, yet hyperscalers posted 6.82% growth as AWS, Azure, and Google secured power at source, insulating themselves from retail mark-ups. Hybrid offerings such as Digital Realty ServiceFabric embed cloud on-ramps inside colo cages, blurring lines between wholesale and retail models. Enterprises still co-locate for disaster-recovery but increasingly demand private suites, compelling landlords to invest in bespoke security and cooling.
Edge data centers multiply near cell towers, giving telcos a new bargaining chip in lease negotiations. This trend not only strengthens competition but also expands the total addressable spend. These factors collectively contribute to the growth of the North America data center construction market. Additionally, the increasing adoption of 5G technology is driving demand for enhanced data center infrastructure.
By Infrastructure: Liquid Cooling Drives Mechanical Upswing
Electrical gear absorbed 35.38% of 2025 budgets; however, mechanical lines are seeing a 6.14% annual rise as racks breach the 100 kW threshold. Direct-to-chip solutions from Vertiv remove 80% of server heat, cutting chilled-water loads 40% . Two-phase immersion trials in Texas slash cooling energy 90%, signaling a possible step change in design. Racks now support 800-V DC buses that trim copper use by half and raise conversion efficiency 3%.
Modular plant rooms, pre-packaged with pumps and plate exchangers, can be hoisted into place within days, significantly shortening the critical path. This approach enhances construction efficiency, enabling faster deployment of data center infrastructure. As AI lifts density norms, mechanical vendors will capture an outsized slice of incremental spend inside the North America data center construction market.
Geography Analysis
The United States accounted for 80.32% of the market share in 2025 and is projected to grow 5.7% annually through 2031. Loudoun County surpasses 2 GW of live capacity but faces 18-month queue times while Dominion upgrades the grid. Texas capitalizes on deregulated power markets, drawing USD 6 billion in 2025 commitments and locking in long-term solar PPAs that hedge against price volatility. Arizona’s 150 MW addition in 2025 demonstrates demand durability, even as water-use concerns drive air-cooled designs that add 15% to capex.
Mexico, with a 6.91% CAGR, is the fastest-growing market thanks to the Querétaro and Monterrey corridors, which offer land at one-third the price of U.S. hub land. KIO Networks earmarked USD 1.5 billion for Mexican expansion in 2025, and QTS announced plans to add 50 MW of capacity to serve cross-border latency needs. Limited fiber paths push some operators to build private links, adding USD 5-10 million per route, yet tariff exemptions and accelerated depreciation offset part of that burden.
Canada remains modest but strategic. Calgary added 30 MW in 2025 for energy-sector HPC, Toronto brought 20 MW online to satisfy privacy-driven clients, and Montreal leverages 3 ¢/kWh hydro but still battles fiber scarcity to U.S. peers. Collectively, these trends diversify geographic risk and ensure the North America data center construction market continues broad-based expansion.
Competitive Landscape
The market signals moderate concentration. AECOM, Turner, and DPR secure early-phase advisory roles that knit utilities, zoning boards, and design teams into one critical path, shaving up to a year off schedules. Mid-cap firms counter by embracing modular prefabrication, which reduces on-site labor by 40%, a key differentiator amid craft-worker shortages.
Technology moats deepen; Schneider Electric registered 12 U.S. patents in 2024 for immersion cooling and predictive thermal controls. Vendors now bundle racks, cooling, and monitoring under service-level deals that shift capex to opex, making them attractive to cloud entrants seeking quick scale. Secondary markets like Omaha and Reno lure contractors with cheaper land, although sparse fiber and labor pools temper hyperscaler appetite.
Sustainability adds a new chessboard. Builders capable of delivering LEED Gold, ISO 50001, and on-site solar secure preferential short-lists. As such credentials go mainstream, differentiation will hinge on AI-ready density packages and transformer supply contracts that lock prices two years out. These factors collectively propel continued investment within the North America data center construction market.
North America Data Center Construction Industry Leaders
DPR Construction Inc.
AECOM
Skanska USA
Whiting-Turner Contracting Company
Jacobs Solutions Inc.
- *Disclaimer: Major Players sorted in no particular order

Recent Industry Developments
- February 2026: Compass Datacenters committed USD 10 billion to a 2 GW campus in Mississippi featuring on-site solar and battery storage.
- February 2026: Centersquare announced a 1 GW Texas build, fast-tracking the first 200 MW phase for delivery in 24 months.
- January 2026: Microsoft set aside USD 80 billion for AI-ready data centers worldwide, allocating 60% to North America with a focus on liquid cooling and renewable sourcing.
- January 2026: OpenAI and Microsoft unveiled the USD 100 billion Stargate AI campus program in Texas, expected to consume 5 GW by 2028.


North America Data Center Construction Market Report Scope
A data center is a physical room, building, or facility that houses IT infrastructure used to build, run, and provide applications and services, and to store and manage the data associated with them. Under data center construction, the capital expenditure incurred while building the existing data center facilities is tracked, and the future capex is estimated based on upcoming data center facilities.
The North America Data Center Construction Market Report is Segmented by Tier Type (Tier 1, Tier 2, Tier 3, and Tier 4), Data Center Type (Colocation, Hyperscalers/Cloud Service Providers, and Enterprise and Edge Data Center), Infrastructure (Electrical Infrastructure, Mechanical Infrastructure, General Construction, and Services), Data Center Size (Small, Medium, Large, and Hyperscale), and Country (United States, Canada, and Mexico). The Market Forecasts are Provided in Terms of Value (USD).
| Tier 1 and 2 |
| Tier 3 |
| Tier 4 |
| Small |
| Medium |
| Large |
| Hyperscale |
| Colocation Data Center |
| Hyperscalers/Cloud Service Provider (CSPs) |
| Enterprise and Edge Data Center |
| Electrical Infrastructure | Power Distribution Solution |
| Power Backup Solutions | |
| Mechanical Infrastructure | Cooling Systems |
| Racks and Cabinets | |
| Servers and Storage | |
| Other Mechanical Infrastructure | |
| General Construction | |
| Services - Design and Consulting, Integration, Support and Maintenance |
| United States |
| Canada |
| Mexico |
| By Tier Type | Tier 1 and 2 | |
| Tier 3 | ||
| Tier 4 | ||
| By Data Center Size | Small | |
| Medium | ||
| Large | ||
| Hyperscale | ||
| By Data Center Type | Colocation Data Center | |
| Hyperscalers/Cloud Service Provider (CSPs) | ||
| Enterprise and Edge Data Center | ||
| By Infrastructure | Electrical Infrastructure | Power Distribution Solution |
| Power Backup Solutions | ||
| Mechanical Infrastructure | Cooling Systems | |
| Racks and Cabinets | ||
| Servers and Storage | ||
| Other Mechanical Infrastructure | ||
| General Construction | ||
| Services - Design and Consulting, Integration, Support and Maintenance | ||
| By Country | United States | |
| Canada | ||
| Mexico | ||


Key Questions Answered in the Report
How large is the North America data center construction market in 2026?
It stands at USD 25.02 billion and is on course for a 5.82% CAGR through 2031.
Which tier category is growing fastest?
Tier 4 facilities are advancing at 6.42% CAGR as fault-tolerant designs gain favor among finance and cloud operators.
Why are hyperscalers building their own data centers?
Vertical integration lets AWS, Microsoft, and Google secure land, power, and custom cooling to serve AI workloads while avoiding retail colocation costs.
What is driving Mexico’s rise in data center projects?
Nearshoring, lower land prices, and tariff incentives are lifting Mexican investment at a 6.91% annual clip.
How are sustainability goals reshaping site selection?
Operators prefer locations with direct access to wind and solar farms, often repurposing coal-plant sites that already have substations and transmission lines.
What cooling technologies are trending for AI workloads?
Direct-to-chip liquid cooling and two-phase immersion reduce energy use up to 90% versus legacy air systems, enabling densities above 100 kW per rack.
Page last updated on:


