
Market Overview
| Study Period | 2021 - 2031 |
|---|---|
| Forecast Data Period | 2026 - 2031 |
| Historical Data Period | 2021 - 2024 |
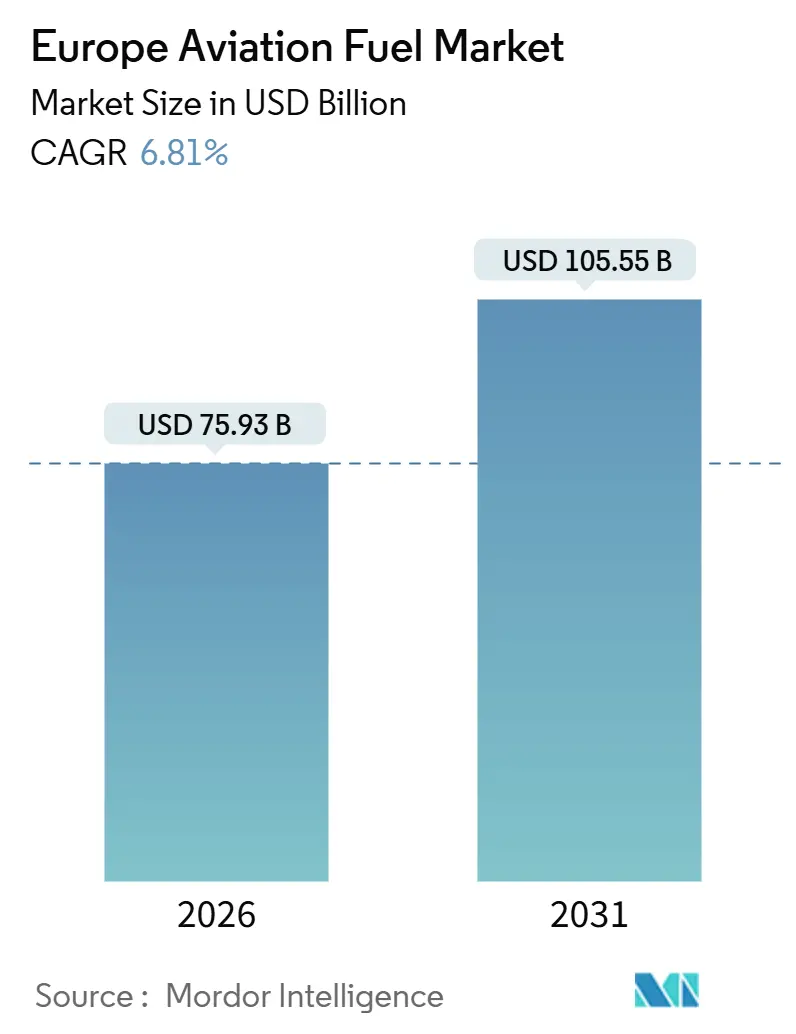
| Market Size (2026) | USD 75.93 Billion |
| Market Size (2031) | USD 105.55 Billion |
| Growth Rate (2026 - 2031) | 6.81 % |
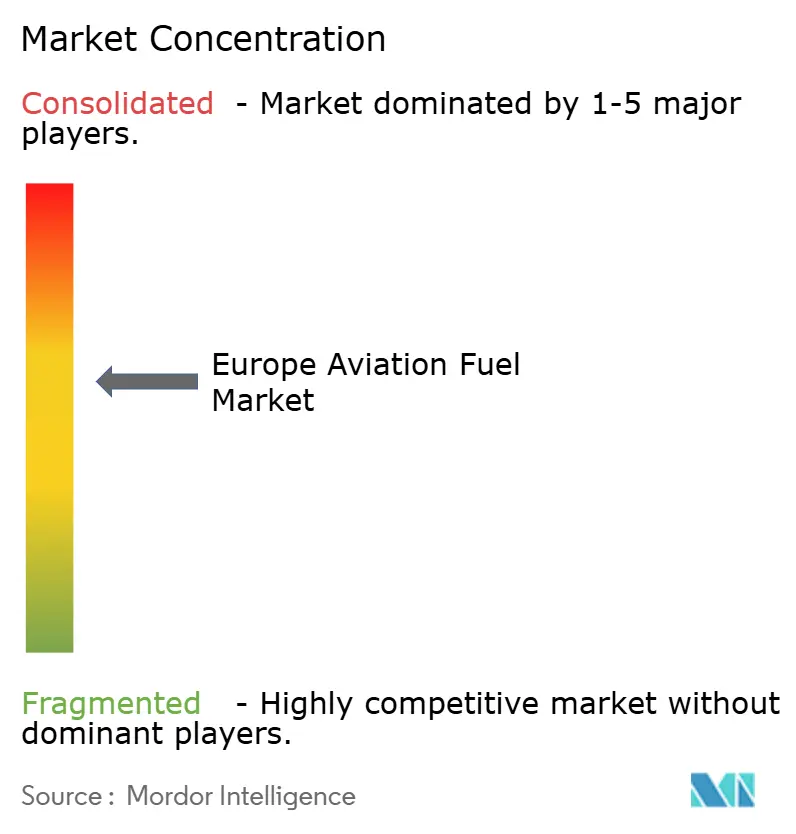
| Market Concentration | Medium |
Major Players *Disclaimer: Major Players sorted in no particular order Image © Mordor Intelligence. Reuse requires attribution under CC BY 4.0. | |
Europe Aviation Fuel Market Analysis by Mordor Intelligence
The Europe Aviation Fuel Market size is estimated at USD 75.93 billion in 2026, and is expected to reach USD 105.55 billion by 2031, at a CAGR of 6.81% during the forecast period (2026-2031).
Stronger leisure and business travel, ReFuelEU Aviation blending mandates, and long-haul narrow-body fleet deployments underpin the expansion of the European aviation fuel market. Recovery in passenger volumes lifted jet-fuel uplift across primary hubs, while cargo throughput from cross-border e-commerce kept freighter demand firm. Integrated oil majors defend hydrant networks, yet dedicated sustainable aviation fuel (SAF) producers are scaling quickly, supported by long-term offtake contracts with flagship carriers. Regional supply chains continue to diversify after Black Sea disruptions, a shift that improves energy security but tightens spot premiums, adding another layer of volatility to the European aviation fuel market.
Key Report Takeaways
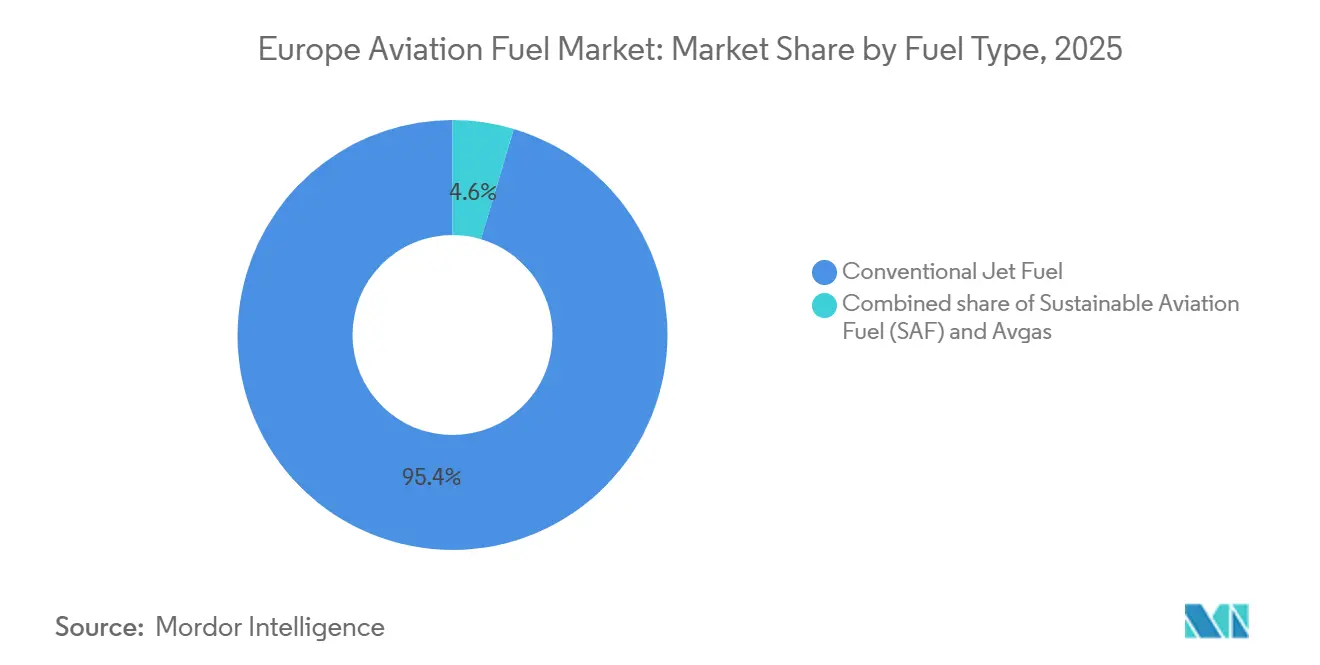
- By fuel type, conventional jet fuel led with 95.4% of the European aviation fuel market share in 2025, while sustainable aviation fuel is forecast to grow at a 25.2% CAGR through 2031.
- By aircraft type, narrow-body operations commanded a 65.9% share of the European aviation fuel market size in 2025; cargo and freighter services are advancing at a 7.9% CAGR to 2031.
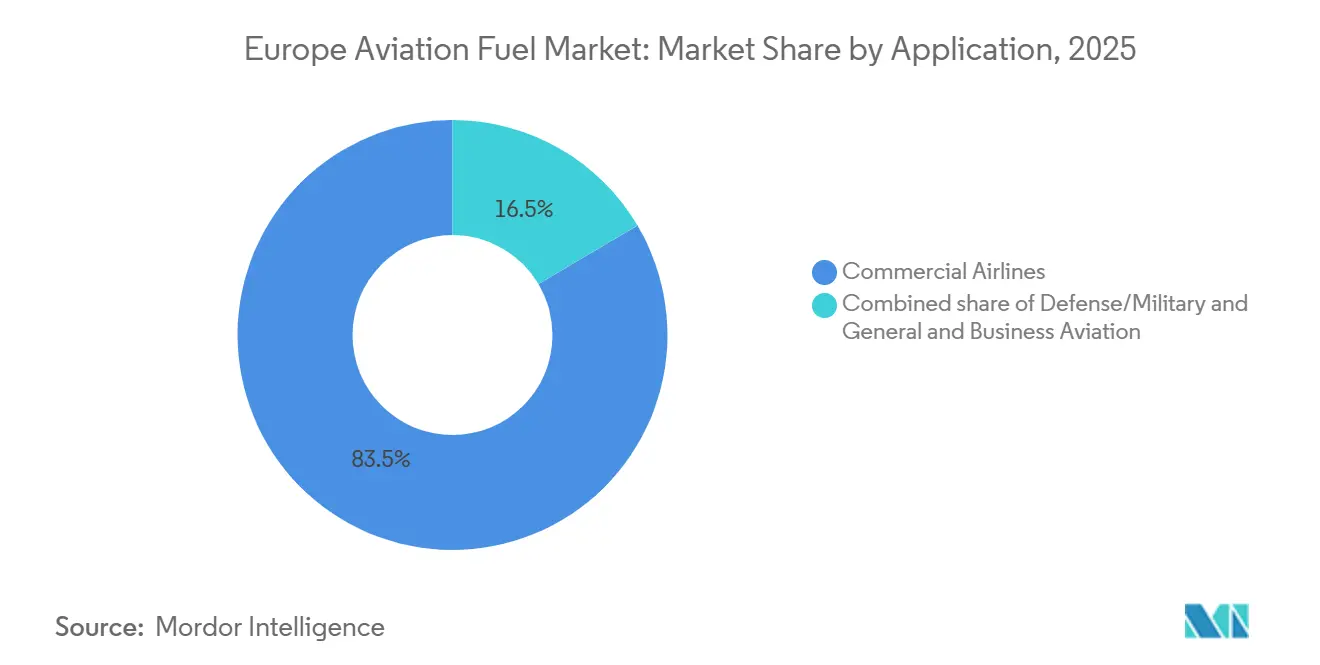
- By application, commercial airlines held 83.5% of the European aviation fuel market size in 2025 and are expanding at a 7.0% CAGR through 2031.
- By geography, the United Kingdom captured a 17.3% share of the European aviation fuel market in 2025 and is projected to post an 8.0% CAGR up to 2031.
Note: Market size and forecast figures in this report are generated using Mordor Intelligence’s proprietary estimation framework, updated with the latest available data and insights as of January 2026.
Europe Aviation Fuel Market Trends and Insights
Drivers Impact Analysis*
| Driver | (~) % Impact on CAGR Forecast | Geographic Relevance | Impact Timeline |
|---|---|---|---|
| Rebound in air-passenger traffic post-COVID-19 | +1.8% | Pan-European, strongest in UK, Spain, and Mediterranean leisure corridors | Short term (≤ 2 years) |
| EU-wide sustainable aviation fuel blending mandates | +2.1% | EU27 plus UK, Norway, and Switzerland under regulatory alignment | Medium term (2-4 years) |
| Ramp-up of long-haul narrow-body fleets in Europe | +1.3% | Western Europe core (UK, Germany, France, Benelux), expanding to Iberia and Nordics | Medium term (2-4 years) |
| Boom in cross-border e-commerce air cargo | +0.9% | Germany, Netherlands, Belgium logistics hubs; secondary growth in Poland and Czech Republic | Long term (≥ 4 years) |
| Phase-4 EU-ETS cost pass-through to fuel-efficient fleets | +0.8% | EU27 and UK, with highest impact on legacy carriers operating older fleets | Medium term (2-4 years) |
| Air-to-e-fuel PtL pilot plants reaching commercial scale | +0.6% | Nordic countries (Norway, Sweden), Germany, Spain; limited near-term impact but accelerating post-2028 | Long term (≥ 4 years) |
| Source: Mordor Intelligence | |||
Rising Air-Passenger Traffic Rebound Post-COVID-19
European carriers moved 1.1 billion passengers in 2024, surpassing pre-pandemic peaks.[1] Low-cost airlines lifted capacity by 12% to tap pent-up leisure demand, yet competitive fares compressed yields on trunk routes. Legacy operators responded by retiring older wide-bodies and accelerating A321neo and 737 MAX deliveries to cut fuel burn. The decoupling of passenger growth from fuel demand keeps pressure on suppliers to predict uplift volume accurately across a fragmented airport network. As traffic continues to normalize, the European aviation fuel market benefits from higher load factors but faces thinner margins across the airline value chain.
EU-Wide Sustainable Aviation Fuel Blending Mandates
The ReFuelEU Aviation regulation became effective in January 2025, requiring a 2% SAF share, rising to 6% by 2030 and 20% by 2035. Non-compliance triggers penalties of up to EUR 5 per liter, driving refiners and distributors to secure SAF even at premium prices. Lufthansa’s 800,000-ton SAF offtake with Shell and Air France-KLM’s 10% sourcing pledge illustrate early-mover hedging strategies. Feedstock scarcity, however, constrains supply; Europe’s used-cooking-oil pool covers only a fraction of mandated demand, forcing investment in alcohol-to-jet and Fischer-Tropsch pathways. As mandates tighten, the European aviation fuel market will hinge increasingly on advanced biofuel scalability and e-fuel economics.
Ramp-Up of Long-Haul Narrow-Body Fleets in Europe
Airbus delivered 47 A321XLR units to European airlines in 2025, enabling point-to-point links like Dublin–Boston without wide-body economics.[2] Fuel burn per seat falls roughly 30% compared with legacy 767s, reinforcing the structural shift towards single-aisle transatlantic service. Boeing’s 737 MAX 10, slated for late-2026 entry, will intensify competition and spread fuel uplift across mid-tier airports. These changes diversify demand nodes inside the European aviation fuel market, challenging distributors to balance pipeline and truck logistics.
Boom in Cross-Border E-Commerce Air Cargo
Express integrators expanded dedicated freighter fleets as European e-commerce parcel volumes rose 14.2% in 2025.[3] DHL added 12 777Fs to Leipzig, FedEx boosted intra-EU frequencies, and secondary cargo hubs in Poland and the Czech Republic absorbed overflow from Frankfurt. Higher payloads and frequent rotations elevate per-flight fuel use, offsetting efficiency gains elsewhere. Cargo’s resilience cushions the European aviation fuel market during passenger downturns, granting suppliers a counter-cyclical revenue stream.
Restraints Impact Analysis*
| Restraint | (~) % Impact on CAGR Forecast | Geographic Relevance | Impact Timeline |
|---|---|---|---|
| High crude-oil price volatility and FX risk | -1.2% | Pan-European, acute for Southern and Eastern carriers with weaker currency hedging | Short term (≤ 2 years) |
| Capacity bottlenecks in European SAF feedstocks | -0.7% | EU27 and UK; Nordic countries partially insulated by domestic biofuel industries | Medium term (2-4 years) |
| Airport hydrant-system conversion capex burden | -0.4% | Regional and secondary airports across Europe; primary hubs in UK, Germany, France less affected | Medium term (2-4 years) |
| Geopolitical disruptions to fuel logistics (Black Sea) | -0.5% | Central and Eastern Europe, with spillover effects on Western European spot markets | Short term (≤ 2 years) |
| Source: Mordor Intelligence | |||
High Crude-Oil Price Volatility and FX Risk
Brent fluctuated between USD 70–95 per barrel during 2024-2025.[4] Fuel costs climbed to 38% of Ryanair’s operating outlays, squeezing budgets of carriers lacking robust hedging books. Eastern European airlines grappled with currency depreciation against the euro, inflating dollar-denominated fuel invoices. Elevated option premiums limited hedge tenors, exposing smaller operators to spot-market swings. Persistent volatility narrows margins in the European aviation fuel market and may accelerate consolidation among financially weaker carriers.
Capacity Bottlenecks in European SAF Feedstocks
Europe produced 1.2 million tons of SAF in 2025, far short of the 6% mandate’s 6 million-ton requirement for 2030. Used-cooking-oil prices doubled to EUR 1,400 per ton amid competition from biodiesel and marine sectors. Advanced feedstocks face RED III sustainability hurdles, and power-to-liquid fuels exceed EUR 3,000 per ton in production costs. Unless new waste-based streams emerge, supply deficits could inflate SAF premiums and slow uptake, restraining overall growth of the European aviation fuel market.
*Our forecasts treat driver/restraint impacts as directional, not additive. The impact forecasts reflect baseline growth, mix effects, and variable interactions.
Segment Analysis
By Fuel Type: SAF Disruption Accelerates Despite Feedstock Constraints
Sustainable aviation fuel posted the quickest advance, expanding at a 25.2% CAGR over 2026-2031. Yet conventional kerosene retained 95.4% of 2025 consumption, highlighting the distance to full decarbonization. Shell, TotalEnergies, and Neste earmarked EUR 4.2 billion for European SAF facilities through 2027. Neste’s Rotterdam complex doubled capacity plans to 1 million tons by 2028, tapping waste animal fats and forestry residues to diversify away from limited used-cooking-oil pools. EU Emissions Trading System Phase 4 lifted carbon costs to EUR 90 per ton, adding EUR 0.23 per liter to jet-fuel prices and sharpening the airline business case for SAF.
The synthetic e-fuel sub-quota of 1.2% by 2030 spurs power-to-liquid investment, yet only three European plants are commercial today, jointly supplying below 15,000 tons. Norsk e-Fuel’s 10,000-ton Mosjøen facility delivered its first batch in 2025, showcasing potential scalability. Conventional refineries still dominate distribution infrastructure, reinforcing their short-term hold on the European aviation fuel market. However, escalating penalties and corporate ESG targets ensure a structural demand floor for SAF despite higher per-ton economics.

By Aircraft Type: Narrow-Body Efficiency Meets Cargo Surge
Narrow-body jets consumed 65.9% of the 2025 uplift. A321neo and 737 MAX families trimmed fuel burn by up to 20% per seat relative to outgoing models. Airlines leveraged the efficiency to add frequencies on city pairs previously unviable with wide-bodies, dispersing fuel demand across secondary airports. Cargo and freighter operations, though smaller in absolute liters, are forecast to grow at a 7.9% CAGR through 2031 on the back of e-commerce and express parcel flows. DHL’s Leipzig hub handled 1.4 million tons of freight in 2025, 16% above 2023, illustrating cargo’s momentum.
The European aviation fuel market size for narrow-bodies is set to climb in tandem with single-aisle range extensions, while cargo’s growth provides a high-margin niche for suppliers able to meet 24/7 turnaround schedules. Wide-body demand is softer as airlines defer A350 and 787 receipts. Regional jets remain flat, affected by up-gauging toward larger narrow-bodies. Fuel planners must, therefore, reconcile divergent trajectories within the European aviation fuel market, balancing efficiency gains against absolute volume growth across fleet segments.
By Application: Commercial Dominance with Defense Undercurrents
Commercial airlines generated 83.5% of fuel demand in 2025 and will expand at a 7.0% CAGR through 2031. Legacy network carriers embed SAF blends into premium-cabin fares, while low-cost rivals rely on financial hedges, delaying physical SAF uptake until mandates tighten. Defense aviation, although smaller, is receiving new F-35A and A330 MRTT tankers as NATO countries raise readiness after the 2022 geopolitical shocks. Each new fighter sortie adds roughly 5,000 liters of JP-8 to demand, carving a resilient pocket within the European aviation fuel market.
Business and general aviation fuel burn is stable, hampered by looming luxury-flight taxes in France and the Netherlands. As corporate travelers face scrutiny over carbon footprints, fractional-ownership firms explore SAF procurement to retain ESG-conscious clients. The European aviation fuel market size allocated to private aviation thus hinges on regulatory latitude and corporate sustainability agendas in the coming decade.
Geography Analysis
The United Kingdom represented 17.3% of revenue in 2025 and is projected to grow at an 8.0% CAGR through 2031. Heathrow and Gatwick reached a combined 104 million passengers that year, underpinning high fuel throughput. Jet Zero mandates call for 10% SAF by 2030, funding a domestic production incentive that has attracted GBP 500 million since 2024.
Germany and France followed, benefiting respectively from cargo-centric Frankfurt and SAF-rich La Mède. Frankfurt’s cargo expansion raised national fuel demand 11% in 2025, whereas Paris’s slot constraints shifted incremental traffic to Lyon and Toulouse. Italy and Spain gained from Mediterranean leisure but trail in SAF adoption due to weaker policy signals.
Nordic states punch above their weight in SAF, with Finland’s Porvoo supplying 40% of regional output. Norway’s Mosjøen e-fuel plant offers a test case for power-to-liquid scalability. Eastern European markets posted the fastest passenger growth yet rely on costly truck deliveries, limiting SAF blending outside pipeline-served hubs. The aggregate picture underscores uneven readiness across the European aviation fuel market to meet escalating decarbonization milestones.
Regulatory Landscape
The EU regulatory framework is anchored by Regulation (EU) 2023/2405 (ReFuelEU Aviation), which became effective in January 2025 and obligates fuel suppliers at Union airports to ensure minimum SAF shares, starting at 2% in 2025 and stepping up through the long-term trajectory defined in the regulation. Compliance is enforced by national competent authorities using EU-level guidance and tools, with the European Union Aviation Safety Agency (EASA) operating the digital reporting infrastructure for ReFuelEU Aviation data submission and verification.
In February 2026, EASA published its 2025 Aviation Fuels Reference Prices for ReFuelEU Aviation, providing a standardized input used by Member States when assessing penalties for non-compliance under the mandate. Reporting requires submission of official templates by 31 March each reporting year, and qualifying SAF must meet sustainability and greenhouse gas saving criteria aligned with the Renewable Energy Directive (RED), which places greater emphasis on audited feedstock chains, certification, and traceability across the European aviation fuel market.
Competitive Landscape
BP, Shell, TotalEnergies, Repsol, and Neste held roughly 60% of hydrant throughput in 2025, giving the European aviation fuel market a moderately consolidated profile. Oil majors leverage pipelines and storage to secure volumes, but refineries optimized for fossil kerosene require expensive retrofits for SAF. Strategic acquisitions, such as Shell’s 40% stake in Sweden’s Preem, illustrate a buy-versus-build pivot toward renewable capacity.
Challengers focus on feedstock control and airport-adjacent production. Repsol and Iberia’s e-fuel plant at Madrid-Barajas eliminates trucking costs and illustrates location synergy. SkyNRG aggregates supply across producers, issuing CORSIA-compliant certificates that appeal to ESG-driven airlines.
Technology differentiation is sharpening: Neste’s NEXBTL process converts waste fats at 80% lifecycle emissions savings, while LanzaJet’s alcohol-to-jet taps ethanol, easing lipid feedstock pressure. With penalties escalating under ReFuelEU, airlines lock in multiyear SAF deals to hedge exposure, tightening feedstock markets and spurring vertical integration throughout the European aviation fuel market.
Europe Aviation Fuel Industry Leaders
-
BP plc
-
Royal Dutch Shell plc
-
TotalEnergies SE
-
Repsol SA
-
Exxon Mobil Corp.
- *Disclaimer: Major Players sorted in no particular order
Market Opportunities and Future Outlook
The clearest near-to-medium term opportunity is scaling SAF production and logistics to keep pace with the ReFuelEU Aviation blending schedule and the synthetic aviation fuel sub-mandate starting in 2030. This is showing up in a build-out pipeline across multiple pathways and locations supported by existing infrastructure: in May 2026, SkyNRG and KLM began construction of the DSL-01 facility in Delfzijl (Netherlands), targeting planned capacity of 100,000 tons per year by 2028; in June 2026, Technip Energies, Airbus, Safran, and Tereos formed the Rebound joint venture to develop a 160,000-ton/year alcohol-to-jet SAF project at the Port of Dunkirk (France). Taken together, these moves point to demand pull from mandates and a shift toward port and industrial-cluster siting to improve feedstock access and export/import flexibility.
A second opportunity is de-risking power-to-liquid e-SAF through firm, low-carbon power arrangements and hydrogen integration, addressing a known constraint for synthetic fuel scale-up in Europe. In July 2026, H4 Marseille Fos (Hy2gen, H2V) and EDF secured power supply for an e-SAF project at Fos-sur-Mer (France), targeting 75,000 tons/year from 2032, while NorSAF and KBR (May 2026) signed a licensing agreement for PureSAF technology for a planned 100,000-ton/year facility in Liepaja (Latvia) targeting 2031. Beyond the EU, geographic alignment under similar rules also widens compliance-driven addressable demand, including Switzerland applying ReFuelEU Aviation from 1 January 2026 to Zurich and Geneva airports, which supports certificate-backed SAF distribution.
Recent Industry Developments
- July 2026: Technip Energies, Airbus, Safran, and Tereos formed the Rebound joint venture to develop a 160,000 ton/year alcohol-to-jet SAF plant at the Port of Dunkirk in France. The project structure brings technology, aviation demand-side credibility, and feedstock linkage into one platform, supporting bankability under ReFuelEU Aviation compliance demand.
- April 2026: TotalEnergies and SARIA closed project financing for the Grandpuits biorefinery project in France, designed for about 230,000 tons per year of sustainable aviation fuel capacity. The financing milestone advances conversion of legacy refining assets into SAF supply infrastructure, strengthening local availability for major French and neighboring European airport systems.
- February 2026: Air bp signed a multi-year agreement with Airbus to supply conventional jet fuel and SAF for Airbus operations in Germany and Spain, covering activities such as aircraft delivery and flight testing. The deal expands certified SAF access at operational sites outside large airline hubs and increases the role of OEM-linked demand in European aviation fuel procurement.
Research Methodology Framework and Report Scope
Market Definition and Coverage
For this report, the market covers revenues earned from aviation fuels supplied for aircraft operations across Europe, including conventional jet fuel, sustainable aviation fuel blends, and aviation gasoline, as these fuels are uplifted for commercial, defense, and business flying.
Scope exclusions: This sizing does not count crude oil extraction, refinery margin breakdowns, or non-aviation ground fuels used at airports.
Segmentation Overview
- By Fuel Type
- Conventional Jet Fuel
- Sustainable Aviation Fuel (SAF)
- Avgas
- By Aircraft Type
- Narrow-body
- Wide-body
- Regional Jets and Turboprops
- Cargo/Freighters
- By Application
- Commercial Airlines
- Defense/Military Aviation
- General and Business Aviation
- By Geography
- United Kingdom
- Germany
- France
- Italy
- Spain
- NORDIC Countries
- Russia
- Rest of Europe
Data Sources, Market Sizing, and Validation
Desk Research
Desk research helped set the demand context and kept the model anchored to real flight activity and fuel supply signals. We referenced public aviation statistics and policy documents, such as Eurostat energy and transport series, EASA safety and fleet activity releases, EUROCONTROL traffic updates, and IEA oil product balances that include jet fuel lines.
To align volumes and the pricing logic, we also reviewed customs and trade data where available, airport and airline disclosures, and reputable press coverage that discusses jet fuel supply tightness, SAF blending mandates, and capacity changes. In parallel, we used paid subscriptions for company financials and intelligence, plus shipment-level trade views and patent databases when clarifying supply pathways and commercialization timing. The sources named here are illustrative and not exhaustive, and additional public references were also used to collect data, validate assumptions, and clarify open questions.
Primary Interviews and Surveys
Primary work focused on validating how uplift volumes, fuel specs, and pricing mechanics differ by country and the airport network, which is where desk sources can be thin. We spoke with a mix of fuel suppliers, airline procurement and operations teams, airport fuel consortium participants, and logistics and storage stakeholders across major hubs and route corridors within Europe. We then used these inputs to tighten assumptions and resolve data gaps.
Distribution of primary research fieldwork respondents
| Company type | Respondent position |
|---|---|
| Top tier: 29% | CXOs: 12% |
| Mid tier: 51% | Functional/Unit leaders: 39% |
| Smaller Players: 20% | Managers: 49% |
Market-Sizing & Forecasting
The core sizing logic starts with a top-down build that reconstructs Europe aviation fuel demand from flight activity and aircraft usage, and then converts that demand into revenue using fuel-type shares and price benchmarks. Where the market is less transparent, we corroborate totals through selective bottom-up checks, such as sampled uplift volumes at major hubs, supplier revenue roll-ups from public financials, and channel checks on SAF availability and blending practices.
Key inputs used in the model include commercial flight movements and seat capacity trends, fleet mix changes across narrow-body and wide-body aircraft, estimated fuel burn by aircraft category, SAF blend rates driven by regulation and voluntary airline targets, and jet fuel and avgas pricing movements with currency timing aligned to the year of consumption. Forecasting uses scenario analysis supported by expert consensus on traffic recovery, refinery and import balance, and the pace at which SAF supply scales, and then the assumptions are stress-tested so that short-term volatility does not overstate the long-run curve. Where bottom-up views cannot cover every country, gaps are handled by scaling from comparable airport networks and route structures, followed by checks against independent traffic and energy series.
Data Validation & Update Cycle
Outputs are validated through multiple passes, starting with consistency checks between implied fuel volume and observable traffic indicators, and then moving to reasonableness tests on pricing and mix shifts. We also run variance checks by major country groups and by application, so unexpected spikes are reviewed, explained, and corrected before sign-off.
The model and written findings go through step-by-step analyst reviews, and re-contacts are triggered when large deviations show up in uplift trends, SAF mandate changes, or major supply disruptions. The report is refreshed annually, and material events can trigger interim updates, followed by a final pre-delivery review so clients receive the latest view available.
Mordor Intelligence's Europe Aviation Fuel Market Size Measured Against Other Published Estimates
Published market sizes for Europe aviation fuel often differ even when they describe the same general value chain, because the included fuel basket and end-use boundary can shift in small but important ways. Differences usually come from whether the value is limited to jet fuel only, how blended SAF volumes are priced versus conventional fuel, and which countries are grouped under Europe for the total.
By checking uplift-linked traffic indicators and refreshing SAF blend rates and country-level price benchmarks, Mordor Intelligence keeps the value aligned to in-scope aviation consumption at airports, instead of relying on refinery output or trade balances alone.
Benchmark comparison
| Source | Market Size | Gaps in Research Methodology |
|---|---|---|
| Mordor Intelligence | USD 75.93 B (2026) | |
| Trade Journal A | USD 34.20 B (2024) | Uses a jet fuel only lens and a shorter time snapshot, and it can exclude defense and general aviation uplift, which reduces the total market value versus a full aviation fuel basket. |
| Regional Consultancy B | USD 55.27 B (2024) | Focuses on commercial aircraft fuel spend, and it typically applies a simplified pricing approach that does not fully separate conventional jet fuel, SAF blends, and avgas, leading to different value totals. |
The spread is mainly explained by scope and pricing mechanics rather than arithmetic errors. When fuel type coverage, end-use inclusion, and price timing are made explicit, the resulting market value becomes easier to reproduce and more stable for planning across airlines, airports, and fuel suppliers.
Key Questions Answered in the Report
What is the projected value of the Europe aviation fuel market by 2031?
The Europe aviation fuel market is forecast to reach USD 105.55 billion by 2031, growing at a 6.81% CAGR from 2026 to 2031.
How significant is sustainable aviation fuel adoption in Europe?
SAF accounted for a small portion of 2025 demand but is expected to grow at a 25.2% CAGR, spurred by EU blending mandates and airline offtake agreements.
Which aircraft segment drives the most fuel consumption in Europe?
Narrow-body jets led with 65.9% of 2025 fuel uptake, a share likely to rise as single-aisle aircraft gain transatlantic range.
Why is the United Kingdom the fastest-growing national market?
Jet Zero policy targets 10% SAF by 2030, Heathrow’s heavy traffic, and robust long-haul demand propel the UK’s 8.0% CAGR through 2031.
Which companies dominate Europe’s aviation fuel supply?
BP, Shell, TotalEnergies, Repsol, and Neste together manage about 60% of hydrant throughput, though SAF specialists such as LanzaJet and SkyNRG are rapidly scaling.