United States Agricultural Biologicals Market Size and Share
Market Overview
| Study Period | 2021 - 2031 |
|---|---|
| Forecast Data Period | 2026 - 2031 |
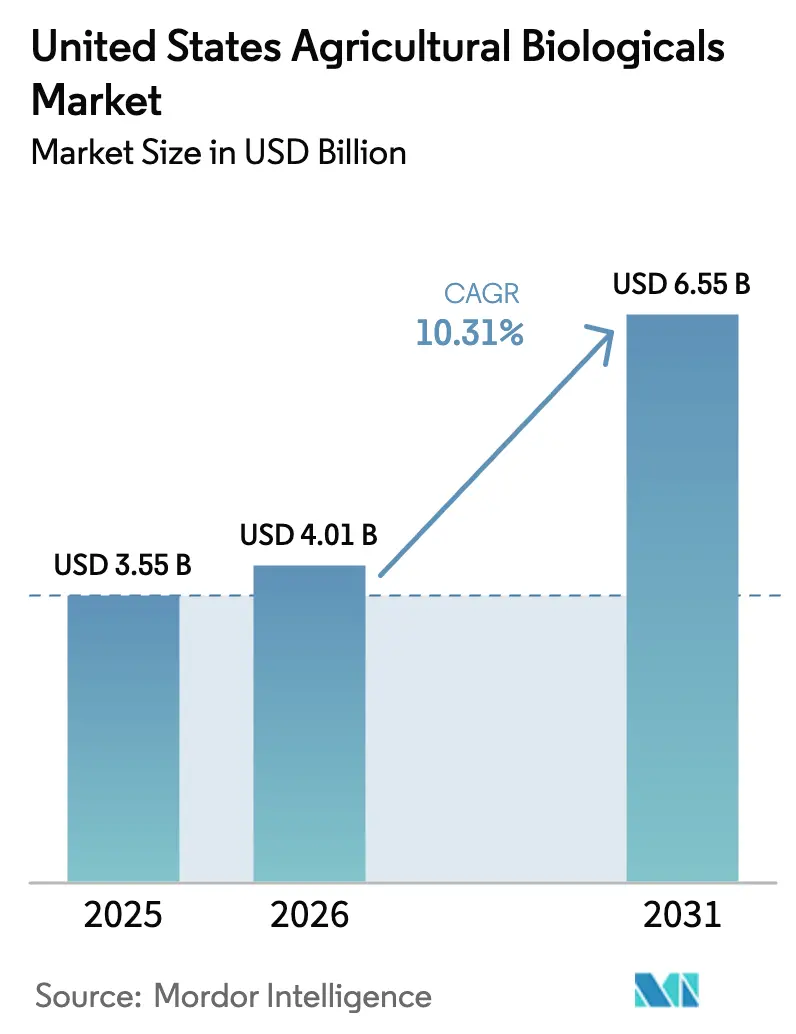
| Base Year Market Size (2025) | USD 3.55 Billion |
| Market Size (2026) | USD 4.01 Billion |
| Market Size (2031) | USD 6.55 Billion |
| Growth Rate (2026 - 2031) | 10.31% CAGR |
| Market Concentration | Medium |
Major Players *Disclaimer: Major Players sorted in no particular order Image © Mordor Intelligence. Reuse requires attribution under CC BY 4.0. | |
United States Agricultural Biologicals Market Analysis by Mordor Intelligence
The United States agricultural biologicals market size was valued at USD 3.55 billion in 2025 and is estimated to grow from USD 4.01 billion in 2026 to USD 6.55 billion by 2031, at a CAGR of 10.31% during the forecast period (2026-2031). Growers are shifting capital from synthetic inputs toward microbial and seaweed-based solutions as herbicide resistance spreads and Environmental Protection Agency reviews intensify. Retail buyers require residue-free produce, which pushes even conventional farms to adopt biologicals. Carbon programs now reward soil-health practices that rely on inoculants, turning a cost line into a revenue line. On-farm fermentation and decentralized production shorten supply chains, lowering landed costs for live microbes and improving product viability in remote counties.
Key Report Takeaways
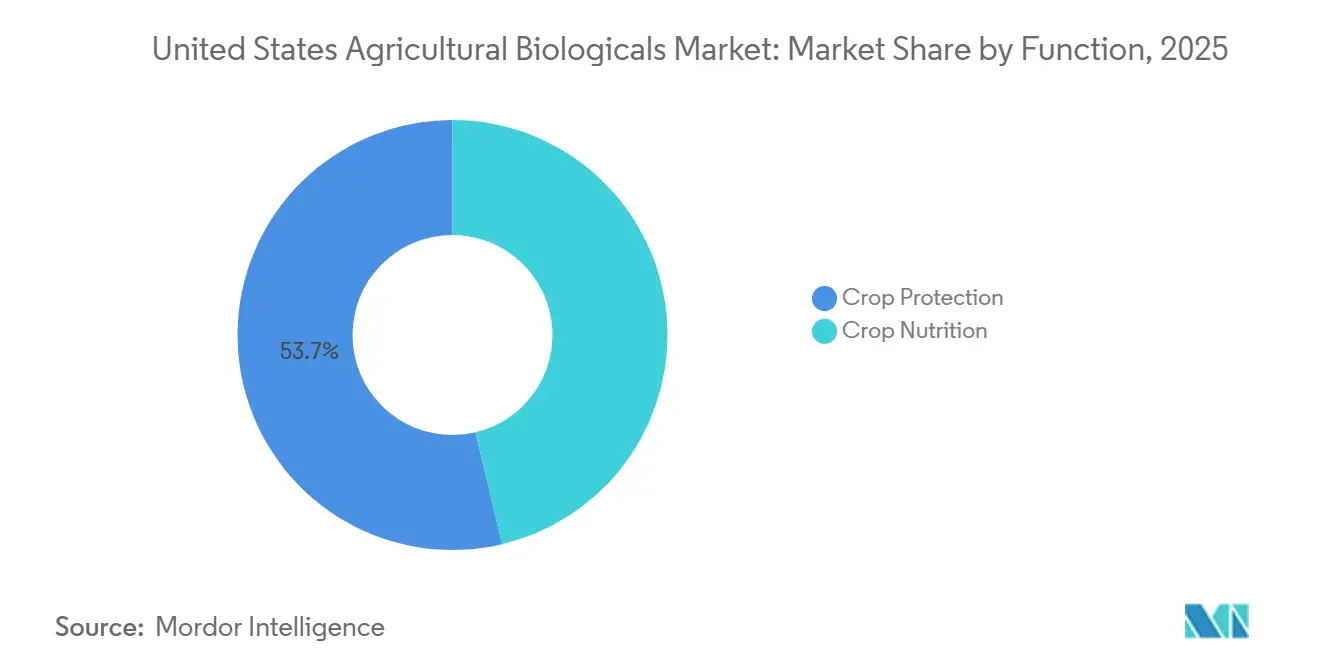
- By function, crop protection were largest segment, held 53.7% of the United States agricultural biologicals market share in 2025, while crop nutrition is the fastest growing segment, expanding at 10.5% CAGR through 2031.
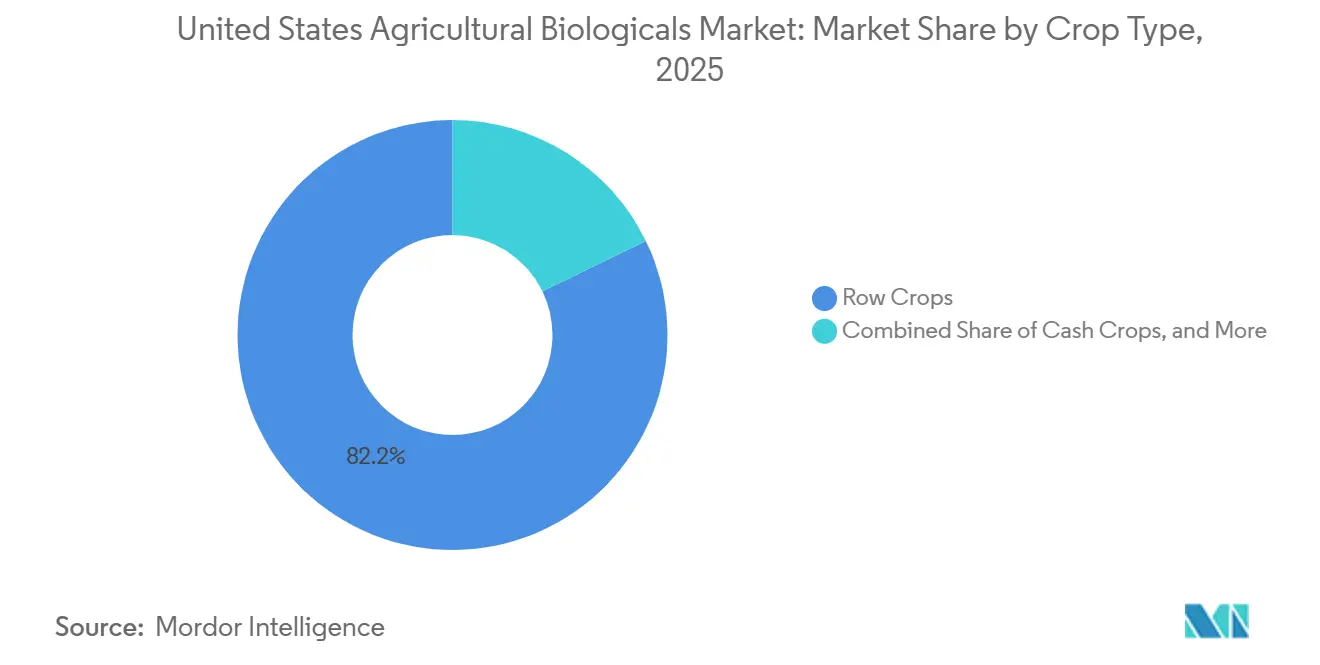
- By crop type, Row crops are the largest segment, commanded 82.2% of the United States agricultural biologicals market size in 2025, and are the fastest growing at 10.4% CAGR through 2031.
Note: Market size and forecast figures in this report are generated using Mordor Intelligence’s proprietary estimation framework, updated with the latest available data and insights as of January 2026.
United States Agricultural Biologicals Market Trends and Insights
Drivers Impact Analysis*
| Driver | (~) % Impact on CAGR Forecast | Geographic Relevance | Impact Timeline |
|---|---|---|---|
| Rising consumer demand for organic produce | +2.1% | Pacific and Northeast retail channels | Medium term (2-4 years) |
| Favorable United States Department of Agriculture (USDA) and Environmental Protection Agency (EPA) regulatory support for bio-based inputs | +1.8% | National programs under United States Department of Agriculture (USDA and Environmental Protection Agency (EPA) Part 174 | Short term (≤2 years) |
| Growing resistance to synthetic agrochemicals | +1.5% | Cotton and soybean zones across the South and Midwest | Medium term (2-4 years) |
| Expansion of row-crop biological trait integration | +1.3% | Corn Belt pilots in Iowa, Illinois and Nebraska | Long term (≥4 years) |
| Carbon-credit monetization linked to biological adoption | +1.0% | Early traction in California and voluntary markets nationwide | Medium term (2-4 years) |
| Rapid growth of on-farm fermentation and custom blends | +0.9% | Cooperative networks in the Midwest and Pacific specialty-crop regions | Long term (≥4 years) |
| Source: Mordor Intelligence | |||


Rising Consumer Demand for Organic Produce
The growing consumer preference for organic and sustainably produced food is a significant structural driver of the United States agricultural biologicals market. Over the past decade, consumers in the United States have increasingly emphasized food safety, environmental sustainability, and reduced chemical residues. As reported by the Organic Trade Association (OTA), retail sales of organic fresh fruits and vegetables have shown significant growth in recent years, reflecting increasing consumer demand for organic produce[1]Source: Organic Trade Association, “Organic Produce Performance Report,” ota.com. This trend has led to increased retail shelf space for certified organic produce and stricter procurement requirements from major grocery chains. Since synthetic pesticides and fertilizers are restricted under organic certification standards, biological crop protection products, biofertilizers, and biostimulants have become critical inputs for organic growers. As organic acreage expands, demand for biological solutions grows in proportion, driving sustained, long-term market growth.
Growing Resistance to Synthetic Agrochemicals
The development of resistance to traditional herbicides, fungicides, and insecticides is driving growers to adopt diversified pest management strategies. Prolonged use of single-mode-of-action chemicals has led to the emergence of resistant weed species, fungal pathogens, and insect populations in key United States crop systems. This resistance diminishes the effectiveness of chemical solutions, increases production costs, and affects yield stability. Biological products provide alternative or complementary modes of action that can be incorporated into resistance management programs, thereby prolonging the effectiveness of synthetic chemicals. For instance, multi-site fungicide resistance in soybean rust and Fusarium head blight isolates is prompting growers to use Bacillus- and Trichoderma-based biofungicides. Consequently, the United States agricultural biologicals market is gaining from the shift away from reliance on single-pathway chemistries.
Expansion of Row-Crop Biological Trait Integration
Biological adoption was traditionally focused on specialty crops such as fruits and vegetables. Technological advancements, such as precision agriculture technologies and automated machinery, have facilitated their integration into large-acreage row crops such as corn, soybeans, and cotton. Seed treatment platforms now commonly include microbial inoculants, nitrogen-fixing bacteria, and stress-mitigation biostimulants, which are being commercialized on a larger scale. As the consistency and compatibility of biological formulations improve, their adoption across millions of row-crop acres is driving an increase in total market value. Major agribusiness corporations are making significant investments in biological research and development to complement their existing chemical portfolios. This integration supports bundled product offerings and enhances farmer accessibility through established distribution networks.
Carbon-Credit Monetization Linked to Biological Adoption
The development of agricultural carbon markets introduces a financial incentive for the adoption of biological inputs. Biological soil amendments and biofertilizers promote regenerative practices, including reduced reliance on synthetic nitrogen, increased soil carbon sequestration, and improved microbial biodiversity. These advancements enable farms to participate in voluntary carbon markets, creating additional income opportunities. Furthermore, biological inputs contribute to reducing greenhouse gas emissions linked to fertilizer production and application. As a result, carbon monetization supports the adoption of biological inputs beyond their conventional agronomic advantages.
Restraints Impact Analysis*
| Restraint | (~) % Impact on CAGR Forecast | Geographic Relevance | Impact Timeline |
|---|---|---|---|
| Performance variability across agro-climatic zones | −1.4% | Arid South and alkaline Midwest soils | Short term (≤2 years) |
| Limited shelf life and cold-chain dependencies | −1.1% | Rural counties distant from distribution hubs | Medium term (2-4 years) |
| Shortage of qualified biological application specialists | −0.8% | South and Midwest acreage with low adviser density | Medium term (2-4 years) |
| Emerging patent thickets limiting strain commercialization | −0.6% | National, affecting smaller formulators | Long term (≥4 years) |
| Source: Mordor Intelligence | |||
Performance Variability Across Agro-Climatic Zones
Biological efficacy is often influenced by environmental conditions, including temperature, soil pH, moisture, and microbial competition. Mycorrhizal colonization collapses in high-phosphorus soils common to continuous corn, reducing payback for many growers. Heat above 32 degrees Celsius can drop microbial viability below label counts within hours, which explains sporadic yield responses in Southern cotton. Because results fluctuate, farmers often insist on side-by-side strips before they commit budget. Manufacturers are therefore bundling multiple strains and encapsulating spores to buffer environmental stress, yet higher formulation costs partially offset savings over synthetics and restrain progress in the United States agricultural biologicals market.
Limited Shelf Life and Cold-Chain Dependencies
Live microbes must reach the farm within 90 days of packaging and stay below 4 degrees Celsius, adding 12-15% to landed cost relative to chemicals with a multiyear shelf life. Rural retail lacks cold rooms, so growers either risk inventory loss or pay expedited freight. Freeze-thaw events during winter transit can reduce colony counts by up to 50%. Lyophilized and encapsulated formats promise 18 months of ambient stability but add a high per-acre cost to the price tag. Direct-to-farm refrigerated routes work in dense California valleys yet underperform in low-volume Great Plains counties. Until storage solutions scale, the cold-chain burden will cap expansion speed in the United States agricultural biologicals market.
*Our forecasts treat driver/restraint impacts as directional, not additive. The impact forecasts reflect baseline growth, mix effects, and variable interactions.
Segment Analysis
By Function: Biofertilizer Leads Revenue, Biostimulants Drive Growth
Crop protection were largest segment, held 53.7% of the United States agricultural biologicals market share in 2025, driven by the use of biopesticides and biocontrol agents to address herbicide and insecticide resistance in crops such as corn, soybean, wheat, and cotton. In the crop protection segment, biopesticides, including biofungicides, bioinsecticides, and bioherbicides, accounted for the largest market share. This is due to the increasing adoption of formulations such as Bacillus subtilis and Beauveria bassiana by growers to combat pathogens and pests resistant to synthetic chemicals.
The crop nutrition segment is the fastest-growing category, with a projected CAGR of 10.5% through 2031. The segment includes products such as biofertilizers, biostimulants, and organic fertilizers, with organic fertilizers being the most widely used category. Biostimulants, such as seaweed extracts, amino acids, and humic substances, enhance stress tolerance and nutrient uptake in specialty crops. Their adoption in row crops remains limited due to inconsistent field performance in conventional production systems. This growth is primarily attributed to nitrogen-fixing inoculants and biostimulants, which help reduce reliance on synthetic fertilizers, especially during periods of high anhydrous ammonia prices. In 2025, BASF SE received Environmental Protection Agency (EPA) approval for isocycloseram, a broad-spectrum contact bioinsecticide targeting lepidopteran pests and other insects affecting specialty crops[2]Source: United States Environmental Protection Agency, “EPA Registers Isocycloseram for Crop Protection,” epa.gov.


By Crop Type: Row Crops Dominate Value, Horticulture Grows Faster
By crop type, Row crops are the largest segment, commanded 82.2% of the United States agricultural biologicals market size in 2025, and are the fastest growing at 10.4% CAGR through 2031. This growth reflects the extensive acreage of corn, soybean, wheat, and cotton production systems. According to the Food and Agriculture Organization Corporate Statistical Database (FAOSTAT), the United States corn acreage was 31,851,130 hectares in 2022, and increased to 33,547,180 hectares by 2024[3]Source: Food and Agriculture Organization, “FAOSTAT Cropland Dataset 2024,” fao.org. Wheat acreage lags in biological adoption due to lower per-acre revenue and limited availability of products tailored to cool-season cereals. The dominance of this segment highlights the transition of biologicals from premium specialty-crop inputs to cost-management tools for large-scale grain and oilseed operations, addressing input-cost inflation and resistance-management challenges.
Horticultural crops, including vegetables, berries, tree fruits, and nuts, captured a smaller share of agricultural biologicals expenditure in 2025, despite higher per-acre spending. This is due to their limited total acreage compared to row crops. In California, vegetable and berry operations utilize biopesticides such as Beauveria bassiana and Bacillus subtilis formulations to address pests include thrips, aphids, and powdery mildew. Florida citrus growers adopted biocontrol agents to manage Asian citrus psyllid and citrus greening, though the efficacy of these agents remains partial and requires integration with cultural practices. Greenhouse tomato and pepper production in Arizona and the Pacific Northwest relied.
Geography Analysis
The South region, which includes Texas, Georgia, Florida, and the Carolinas, are hold significant position. Its growth was primarily driven by cotton and peanut growers adopting Bacillus-based seed treatments and biofungicides to manage seedling diseases and soil-borne pathogens. Florida's citrus operations also utilized biocontrol agents to combat Asian citrus psyllid, a vector of citrus greening. The efficacy of these agents remains partial and requires integration with cultural practices and area-wide pest management strategies. Adoption in the region faces challenges, including performance variability in high-temperature, low-organic-matter soils and limited cold-chain infrastructure in rural areas. These constraints highlight the need for formulation innovations to maintain microbial viability under heat stress exceeding 32 degrees Celsius.
The Midwest region led the United States' agricultural biologicals demand in 2025, with corn and soybean growers integrating nitrogen-fixing inoculants into row-crop acres. States, including Iowa, Illinois, and Nebraska, spearheaded adoption, supported by cooperative networks that implemented on-farm fermentation systems capable of producing fresh microbials within 48 hours of application. These systems significantly reduced input costs. Additionally, fertilizer price volatility, including high peaks in anhydrous ammonia prices, accelerated grower interest in biological alternatives that reduce synthetic nitrogen applications per acre.
The Pacific region, comprising California, Washington, and Oregon, saw specialty-crop growers applying biostimulants and biocontrol agents across acres of vegetables, berries, tree fruits, and nuts. Retailer residue-testing mandates from companies such as Whole Foods Market and Costco encouraged conventional strawberry and lettuce growers to adopt biopesticides, even outside certified-organic operations, to avoid detectable synthetic residues that could lead to supply-chain rejections. Additionally, greenhouse tomato and pepper producers in the Pacific Northwest utilized macrobials, such as predatory mites and parasitic wasps, to manage whitefly and aphid infestations without disrupting pollinator activity.
Competitive Landscape
The United States agricultural biologicals market is moderately concentrated, as the top five companies significant of 2025 revenue. Top players include Corteva Agriscience, Bayer AG, Novonesis Group, Valent BioSciences LLC, and BASF SE. Corteva Agriscience and BioWorks Inc. are advancing biological solutions through extensive research and development, particularly in biofertilizers, biopesticides, and biostimulants. Strategic partnerships and collaborations are increasingly prevalent, enabling companies to leverage complementary strengths and expand their market presence.
The competitive landscape is influenced by varying levels of specialization among market participants. While some companies focus exclusively on biological solutions, others maintain diversified portfolios of agricultural products. Market entry barriers are moderately high due to stringent regulatory requirements and substantial investments in research and development. The industry is gradually transitioning from traditional distribution models to more integrated approaches, with companies fostering direct relationships with end users and offering tailored solutions for specific crop and regional needs. This trend reflects the evolving dynamics of the agricultural biologicals market.
Despite ongoing developments, gaps remain in areas such as cool-season cereals, alkaline soils, and open-field microbial deployment. Companies that address shelf-life challenges without relying on cold chain logistics could unlock significant opportunities in regions such as the Great Plains and Delta. Cooperative production models are also emerging as a potential disruptor to traditional brand loyalty, as farmers increasingly associate quality with local production. Over the forecast period, the United States agricultural biologicals market is projected to remain a competitive arena, characterized by the interplay between global patent portfolios and localized fermentation networks.
United States Agricultural Biologicals Industry Leaders
Corteva Agriscience
Bayer AG
Novonesis Group
Valent BioSciences LLC
BASF SE
- *Disclaimer: Major Players sorted in no particular order

Recent Industry Developments
- May 2025: Syngenta AG inaugurated a new biologicals production facility in Orangeburg, South Carolina, United States. This major capital investment is designed to support the production of 16,000 metric tons of plant biostimulants annually.
- February 2025: Syngenta AG, a global leader in the development of biological products for agricultural applications, is expanding its research and development capabilities in this field. The company announced its acquisition of the Novartis repository of natural compounds and genetic strains for agricultural use. This acquisition provides Syngenta with access to a valuable source of novel leads for agricultural research and enhances its integrated capabilities in bioengineering, data science, fermentation, downstream processing, and analytics.
- March 2023: Sumitomo Chemical Co., Ltd. (SCC) acquired FBSciences Holdings, Inc. (FBS) through its wholly owned subsidiary, Valent Biosciences LLC (VBC). This acquisition aims to further expand the company's biorationals business.


United States Agricultural Biologicals Market Report Scope
Agricultural biologicals are products derived from natural materials, including microorganisms, plants, and organic matter. These products enhance crop productivity, health, and resilience while promoting sustainability. The United States Agricultural Biologicals Market is Segmented by Function (Crop Nutrition and Crop Protection) and by Crop Type (Cash Crops, Horticultural Crops, and Row Crops). The Market Forecasts are Provided in Terms of Value (USD) and Volume (Metric Tons).
| Crop Nutrition | Biofertilizer | Azospirillum |
| Azotobacter | ||
| Mycorrhiza | ||
| Phosphate Solubilizing Bacteria | ||
| Rhizobium | ||
| Other Biofertilizer | ||
| Biostimulants | Amino Acids | |
| Fulvic Acid | ||
| Humic Acid | ||
| Protein Hydrolysates | ||
| Seaweed Extracts | ||
| Other Biostimulants | ||
| Organic Fertilizer | Manure | |
| Meal Based Fertilizers | ||
| Oilcakes | ||
| Other Organic Fertilizer | ||
| Crop Protection | Biocontrol Agents | Macrobials |
| Microbials | ||
| Biopesticides | Biofungicides | |
| Bioherbicides | ||
| Bioinsecticides | ||
| Other Biopesticides | ||
| Cash Crops |
| Horticultural Crops |
| Row Crops |
| Function | Crop Nutrition | Biofertilizer | Azospirillum |
| Azotobacter | |||
| Mycorrhiza | |||
| Phosphate Solubilizing Bacteria | |||
| Rhizobium | |||
| Other Biofertilizer | |||
| Biostimulants | Amino Acids | ||
| Fulvic Acid | |||
| Humic Acid | |||
| Protein Hydrolysates | |||
| Seaweed Extracts | |||
| Other Biostimulants | |||
| Organic Fertilizer | Manure | ||
| Meal Based Fertilizers | |||
| Oilcakes | |||
| Other Organic Fertilizer | |||
| Crop Protection | Biocontrol Agents | Macrobials | |
| Microbials | |||
| Biopesticides | Biofungicides | ||
| Bioherbicides | |||
| Bioinsecticides | |||
| Other Biopesticides | |||
| Crop Type | Cash Crops | ||
| Horticultural Crops | |||
| Row Crops | |||


Market Definition
- AVERAGE DOSAGE RATE - The average application rate is the average volume of agricultural biologicals applied per hectare of farmland in the respective region/country.
- CROP TYPE - Crop type includes Row crops (Cereals, Pulses, Oilseeds), Horticultural Crops (Fruits and vegetables) and Cash Crops (Plantation Crops, Fibre Crops and Other Industrial Crops)
- FUNCTION - Agricultural biological products provide crops with essential nutrients, prevent or control abiotic & biotic stresses, and enhance soil quality.
- TYPE - The Crop Nutrition function of agricultural biologicals includes organic fertilizer and Biofertilizer, whereas the Crop Protection function includes Biostimulants, Biopesticides and Biocontrol Agents.
| Keyword | Definition |
|---|---|
| Cash Crops | Cash crops are non-consumable crops sold as a whole or part of the crop to manufacture end-products to make a profit. |
| Integrated Pest Management (IPM) | IPM is an environment-friendly and sustainable approach to control pests in various crops. It involves a combination of methods, including biological controls, cultural practices, and selective use of pesticides. |
| Bacterial biocontrol agents | Bacteria used to control pests and diseases in crops. They work by producing toxins harmful to the target pests or competing with them for nutrients and space in the growing environment. Some examples of commonly used bacterial biocontrol agents include Bacillus thuringiensis (Bt), Pseudomonas fluorescens, and Streptomyces spp. |
| Plant Protection Product (PPP) | A plant protection product is a formulation applied to crops to protect from pests, such as weeds, diseases, or insects. They contain one or more active substances with other co-formulants such as solvents, carriers, inert material, wetting agents or adjuvants formulated to give optimum product efficacy. |
| Pathogen | A pathogen is an organism causing disease to its host, with the severity of the disease symptoms. |
| Parasitoids | Parasitoids are insects that lay their eggs on or within the host insect, with their larvae feeding on the host insect. In agriculture, parasitoids can be used as a form of biological pest control, as they help to control pest damage to crops and decrease the need for chemical pesticides. |
| Entomopathogenic Nematodes (EPN) | Entomopathogenic nematodes are parasitic roundworms that infect and kill pests by releasing bacteria from their gut. Entomopathogenic nematodes are a form of biocontrol agents used in agriculture. |
| Vesicular-arbuscular mycorrhiza (VAM) | VAM fungi are mycorrhizal species of fungus. They live in the roots of different higher-order plants. They develop a symbiotic relationship with the plants in the roots of these plants. |
| Fungal biocontrol agents | Fungal biocontrol agents are the beneficial fungi that control plant pests and diseases. They are an alternative to chemical pesticides. They infect and kill the pests or compete with pathogenic fungi for nutrients and space. |
| Biofertilizers | Biofertilizers contain beneficial microorganisms that enhance soil fertility and promote plant growth. |
| Biopesticides | Biopesticides are natural/bio-based compounds used to manage agricultural pests using specific biological effects. |
| Predators | Predators in agriculture are the organisms that feed on pests and help control pest damage to the crops. Some common predator species used in agriculture include ladybugs, lacewings, and predatory mites. |
| Biocontrol agents | Biocontrol agents are living organisms used to control pests and diseases in agriculture. They are alternatives to chemical pesticides and are known for their lesser impact on the environment and human health. |
| Organic Fertilizers | Organic fertilizer is composed of animal or vegetable matter used alone or in combination with one or more non-synthetically derived elements or compounds used for soil fertility and plant growth. |
| Protein hydrolysates (PHs) | Protein hydrolysate-based biostimulants contain free amino acids, oligopeptides, and polypeptides produced by enzymatic or chemical hydrolysis of proteins, primarily from vegetal or animal sources. |
| Biostimulants/Plant Growth Regulators (PGR) | Biostimulants/Plant Growth Regulators (PGR) are substances derived from natural resources to enhance plant growth and health by stimulating plant processes (metabolism). |
| Soil Amendments | Soil Amendments are substances applied to soil that improve soil health, such as soil fertility and soil structure. |
| Seaweed Extract | Seaweed extracts are rich in micro and macronutrients, proteins, polysaccharides, polyphenols, phytohormones, and osmolytes. These substances boost seed germination and crop establishment, total plant growth and productivity. |
| Compounds related to biocontrol and/or promoting growth (CRBPG) | Compounds related to biocontrol or promoting growth (CRBPG) are the ability of a bacteria to produce compounds for phytopathogen biocontrol and plant growth promotion. |
| Symbiotic Nitrogen-Fixing Bacteria | Symbiotic nitrogen-fixing bacteria such as Rhizobium obtain food and shelter from the host, and in return, they help by providing fixed nitrogen to the plants. |
| Nitrogen Fixation | Nitrogen fixation is a chemical process in soil which converts molecular nitrogen into ammonia or related nitrogenous compounds. |
| ARS (Agricultural Research Service) | ARS is the U.S. Department of Agriculture's chief scientific in-house research agency. It aims to find solutions to agricultural problems faced by the farmers in the country. |
| Phytosanitary Regulations | Phytosanitary regulations imposed by the respective government bodies check or prohibit the importation and marketing of certain insects, plant species, or products of these plants to prevent the introduction or spread of new plant pests or pathogens. |
| Ectomycorrhizae (ECM) | Ectomycorrhiza (ECM) is a symbiotic interaction of fungi with the feeder roots of higher plants in which both the plant and the fungi benefit through the association for survival. |


Research Methodology
Mordor Intelligence follows a four-step methodology in all our reports.
- Step-1: Identify Key Variables: In order to build a robust forecasting methodology, the variables and factors identified in Step-1 are tested against available historical market numbers. Through an iterative process, the variables required for market forecast are set and the model is built on the basis of these variables.
- Step-2: Build a Market Model: Market-size estimations for the forecast years are in nominal terms. Inflation is not a part of the pricing, and the average selling price (ASP) is kept constant throughout the forecast period.
- Step-3: Validate and Finalize: In this important step, all market numbers, variables and analyst calls are validated through an extensive network of primary research experts from the market studied. The respondents are selected across levels and functions to generate a holistic picture of the market studied.
- Step-4: Research Outputs: Syndicated Reports, Custom Consulting Assignments, Databases & Subscription Platforms.


