North America Agricultural Biologicals Market Size and Share
Market Overview
| Study Period | 2018 - 2031 |
|---|---|
| Forecast Data Period | 2026 - 2031 |
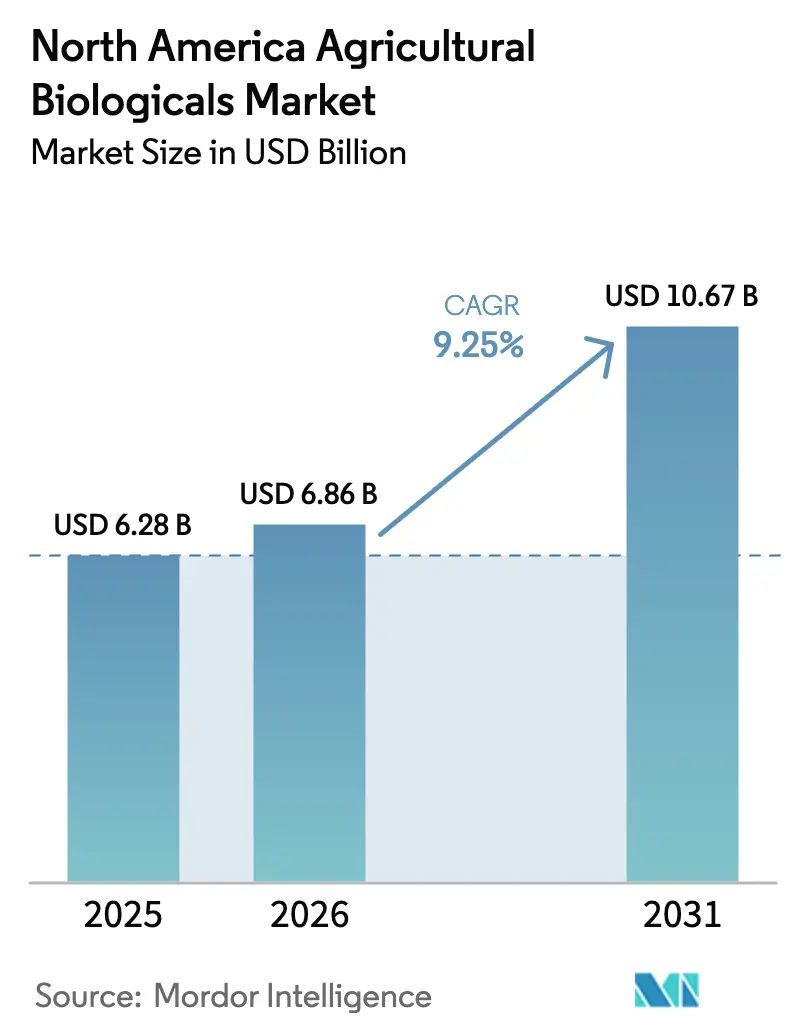
| Base Year Market Size (2025) | USD 6.28 Billion |
| Market Size (2026) | USD 6.86 Billion |
| Market Size (2031) | USD 10.67 Billion |
| Growth Rate (2026 - 2031) | 9.25% CAGR |
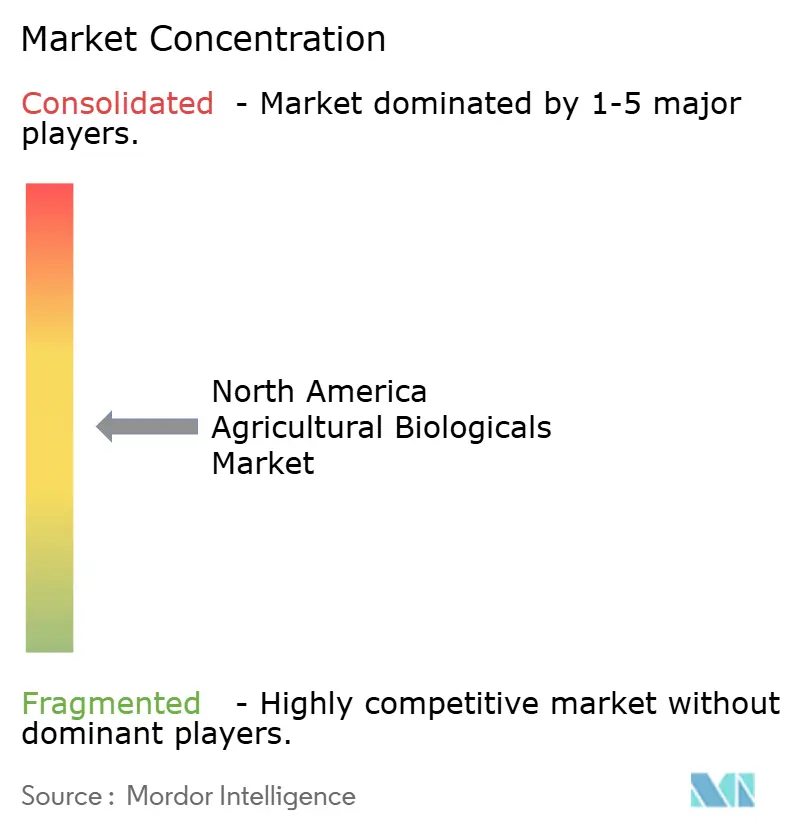
| Market Concentration | Medium |
Major Players *Disclaimer: Major Players sorted in no particular order Image © Mordor Intelligence. Reuse requires attribution under CC BY 4.0. | |
North America Agricultural Biologicals Market Analysis by Mordor Intelligence
The North America agricultural biologicals market size was valued at USD 6.28 billion in 2025 and estimated to grow from USD 6.86 billion in 2026 to reach USD 10.67 billion by 2031, at a CAGR of 9.25% during the forecast period (2026-2031). Sustained regulatory crackdowns on synthetic pesticides, rising demand for residue-free produce, and steady expansion of certified organic acreage continue to push biological inputs from niche to mainstream. Key risks include variable field performance under diverse environmental conditions and higher per-acre costs compared to conventional products. Supply chain constraints in manufacturing biological products at scale present additional challenges, particularly for live microbial formulations requiring cold storage infrastructure. Consolidation among crop-protection majors adds scale, while start-ups utilize artificial intelligence to identify novel strains that can withstand harsh field conditions. Precision agriculture tools now enable variable-rate application of live microbes, improving both efficacy and farm economics. Together, these dynamics create a multi-faceted growth runway that competitors are racing to secure.
Key Report Takeaways
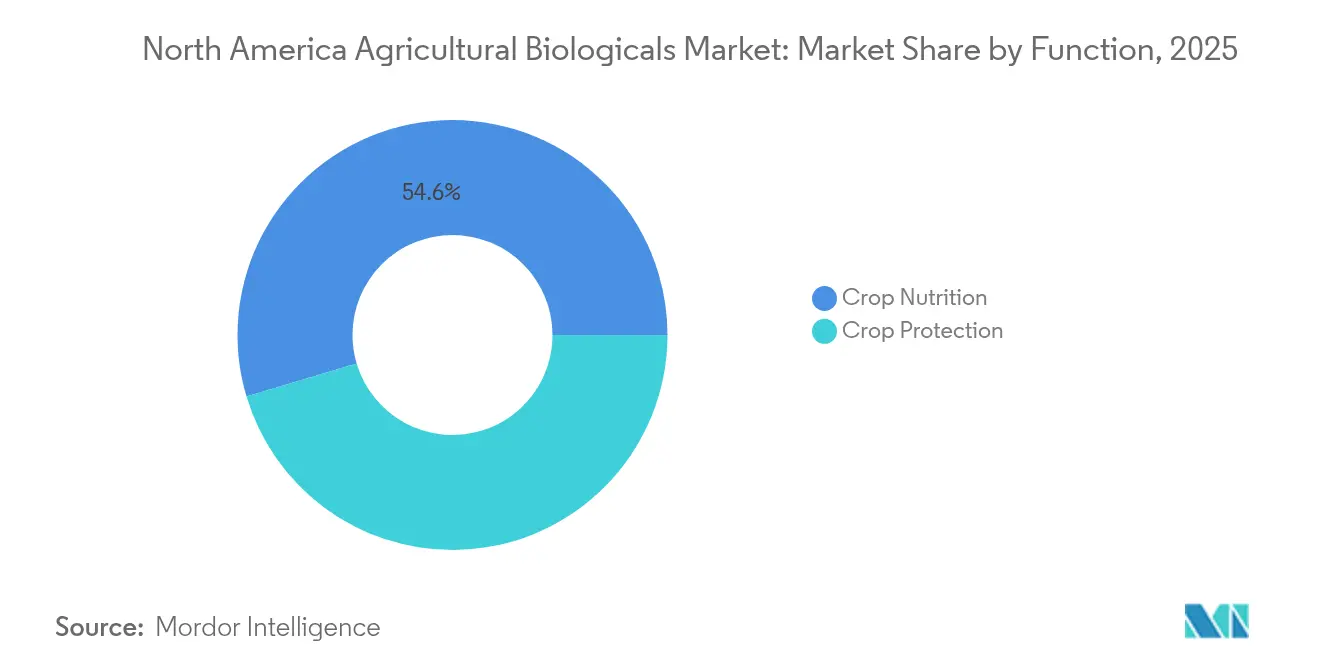
- By function, crop nutrition solutions led with 54.62% revenue share in 2025, while crop protection is projected to advance at a 9.84% CAGR through 2031.
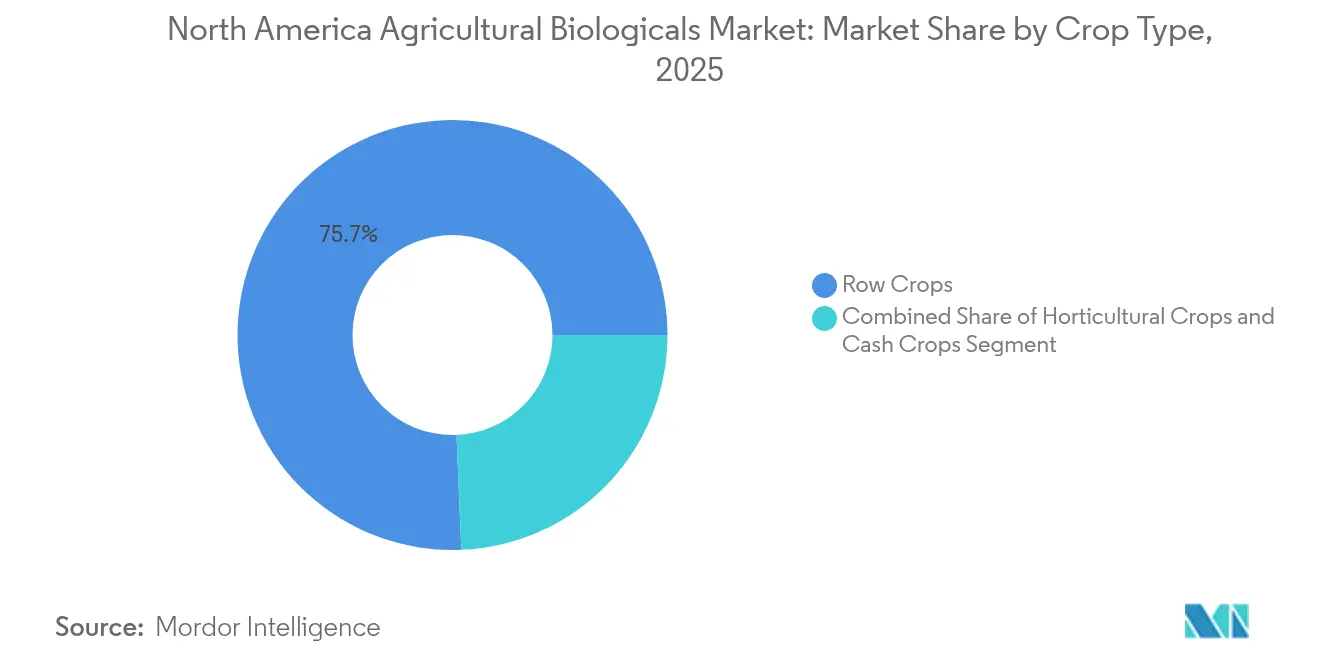
- By crop type, row crops accounted for 75.65% of the North America agricultural biologicals market share in 2025 and are expanding at a 9.62% CAGR through 2031.
- By geography, the United States held a 55.42% share of the North America agricultural biologicals market size in 2025, and Canada records the fastest projected CAGR at 10.21% through 2031.
Note: Market size and forecast figures in this report are generated using Mordor Intelligence’s proprietary estimation framework, updated with the latest available data and insights as of 2026.
North America Agricultural Biologicals Market Trends and Insights
Drivers Impact Analysis*
| DRIVER | (~) % Impact on CAGR Forecast | Geographic Relevance | Impact Timeline |
|---|---|---|---|
| Rising Demand for Organic and Sustainable Agriculture | +2.1% | United States, Canada, Mexico | Medium term (2-4 years) |
| Stringent Regulations on Chemical Pesticides | +1.8% | United States and Canada | Short term (≤ 2 years) |
| Increasing Pest Resistance to Conventional Chemicals | +1.4% | Corn and soybean belts | Long term (≥ 4 years) |
| Integration with Precision Agriculture Technologies | +1.2% | Midwest and Prairie regions | Medium term (2-4 years) |
| Growing Consumer Awareness and Demand for Residue-free Produce | +0.9% | Urban retail markets | Long term (≥ 4 years) |
| Advancements in Microbial Research and Formulation Technologies | +0.7% | Research hubs in North Carolina and Saskatchewan | Long term (≥ 4 years) |
| Source: Mordor Intelligence | |||


Rising Demand for Organic and Sustainable Farming
Certified organic acreage climbed 5.6% across the region in 2024, topping 5.4 million acres.[1]“Census of Agriculture 2022,” USDA NASS, usda.govPremiums of 30-40% on organic corn and soybeans help farmers recoup the higher per-acre costs of bio-inputs. State programs in California and Iowa add compliance mandates that favor biologicals. Carbon credit schemes now reward microbial inoculants that sequester measurable soil carbon. EPA (Environmental Protection Agency) recognition of OMRI-listed products shortens approval queues, removing a historic adoption hurdle.
Stricter Regulations on Chemical Pesticides
Environmental Protection Agency canceled or restricted 47 active ingredients in 2024, eliminating entire mode-of-action classes from grower toolkits.[3]“Pesticide Registration,” EPA, epa.govA new fast-track review trims biological registration timelines to 12-18 months. Export partners tightened maximum residue limits, forcing fruit and vegetable growers to pivot toward zero-synthetic programs. CFIA aligned with EPA rules to simplify cross-border sales, while Mexico’s SENASICA began mirroring the policy shift.
Increasing Pest Resistance to Conventional Chemicals
More than 600 arthropod species show resistance to at least one pesticide class, with corn rootworm and soybean aphid now requiring alternative controls.[2] “Pest and Pesticide Management,” FAO, fao.org Yield losses tied to resistance exceeded USD 1.8 billion in 2024. University extension bulletins recommend rotating synthetic and biological modes of action, speeding up biocontrol use. Resistance monitoring programs in Iowa and Ontario confirm microbes’ ability to delay resistance buildup.
Integration with Precision Agriculture Technologies
Variable-rate sprayers cover 23% of row-crop acres, enabling targeted microbial delivery that lifts field-level returns. IoT-linked storage tanks track product viability in real time, avoiding temperature abuse. Data platforms merge weather, soil, and pest models to recommend exact spray windows. Early adopters report input cost reductions of 15% without sacrificing yields. The development of IoT-enabled storage and handling systems for biological products addresses cold chain requirements while providing real-time monitoring of product viability. Machine learning algorithms are being deployed to optimize biological product selection based on field-specific conditions, pest pressure history, and economic return projections.
Restraints Impact Analysis*
| Restraint | (~) % Impact on CAGR Forecast | Geographic Relevance | Impact Timeline |
|---|---|---|---|
| Higher Cost Compared to Conventional Products | -1.3% | Commodity-crop regions | Short term (≤ 2 years) |
| Variable Efficacy Under Different Environmental Conditions | -0.8% | Arid and high-temperature zones | Medium term (2-4 years) |
| Limited Farmer Awareness and Technical Knowledge | -0.6% | Rural counties with low extension coverage | Long term (≥ 4 years) |
| Shorter Shelf Life and Storage Challenges | -0.4% | Remote distribution hubs | Medium term (2-4 years) |
| Source: Mordor Intelligence | |||
Higher Cost Compared to Conventional Products
Per-acre biological programs still cost 40–60% more than traditional chemistries in corn and soy. Price gaps narrow in specialty crops where bio-premiums offset inputs. Manufacturing scale remains limited, though recent capacity expansions promise incremental cost relief and improved formulation efficiency, supported by downstream partnerships and localized production investments. Manufacturing scale limitations for biological products prevent the cost reductions typically achieved through economies of scale in synthetic chemical production, maintaining structural cost disadvantages.
Variable Efficacy Under Different Environmental Conditions
Extreme heat or drought can slash microbial performance by 30% according to peer-reviewed greenhouse tests. Precision timing and improved coatings mitigate but do not eliminate the risk. Growers demand rock-solid ROI data before switching wholesale, especially in water-stressed regions where inconsistent field results hinder confidence and slow commercial adoption. The development of climate-resilient formulations and application timing optimization based on weather forecasting is addressing these challenges, but adoption rates remain constrained by grower concerns about consistent performance.
*Our forecasts treat driver/restraint impacts as directional, not additive. The impact forecasts reflect baseline growth, mix effects, and variable interactions.
Segment Analysis
By Function: Nutrition Solutions Maintain Leadership
Crop nutrition solutions claimed a 54.62% slice of the North America agricultural biologicals market in 2025. Biofertilizers that fix nitrogen or solubilize phosphate cut synthetic fertilizer use by up to 25%, giving growers immediate cost savings. Biostimulants based on seaweed and amino acids lift fruit-set and stress tolerance in grapes and berries. The North America agricultural biologicals market size for crop protection products is slated to grow at a 9.84% CAGR, driven by the rapid entry of microbial insecticides that meet residue limits. Blended “one-jug” offerings that combine nutrition and protection simplify application passes, a clear edge in tight farm calendars.
Nutrient-driven soil-health programs underpin long-term yield stability, which resonates with carbon credit protocols rewarding organic matter gains. Consortium inoculants deliver multiple soil services in a single application. Biopesticides enjoy an expedited EPA path that keeps regulatory costs in check, letting new entrants challenge incumbents on innovation rather than scale.


By Crop Type: Row Crops Dominate Adoption
Row crops held 75.65% of the North America agricultural biologicals market share in 2025. The segment is expanding at a 9.62% CAGR as variable-rate rigs spread live microbes across millions of acres of corn, soybeans, and wheat. The North America agricultural biologicals market size for horticultural crops, though smaller, commands premium margins because retailers pay extra for residue-free labels. Cash crops such as cotton adopt bio-fungicides to secure export clearance into stricter markets. Turf and ornamentals sustain steady demand in urban centers where water-quality ordinances restrict synthetic run-off.
Field-level trials show corn yield lifts of 3-5% from PGPR inoculants under moderate drought. Soybeans respond well to rhizobial updates that shorten nodulation time in cooler spring soils. In berries, bio-fungicides targeting Botrytis cinerea cut post-harvest losses by 15%. Product pipelines increasingly tailor microbes to specific crop–soil–climate combinations, raising efficacy and justifying higher price points.
Geography Analysis
The United States controlled 55.42% of the market value in 2025, driven by strong policy support and a broad dealer network. Midwest row-crop operators integrate biologicals with RTK-guided sprayers over 12 million acres. California drives high-value demand where organic lettuce, almond, and strawberry growers rely on OMRI-listed inputs to meet export and domestic retail codes. Federal cost-share programs under NRCS allocated funds to bio-input adoption in 2024.
Canada records the fastest projected CAGR at 10.21% through 2031. Canada contributes meaningful upside with Prairie grain growers trialing cold-tolerant microbes that survive spring chills. The Canadian organic rulebook rates biologicals as first-choice inputs, and provincial grants cover up to 50% of product costs, accelerating uptake. Collaborative research teams in Saskatchewan and Ontario fast-track strain discoveries suited to shorter seasons.
Mexico's agricultural biologicals market is experiencing gradual expansion, primarily concentrated in export-oriented production systems that require sustainable production practices for international buyers. Mexico adds a smaller yet strategic layer, dominated by export-focused avocado and berry clusters that must pass U.S. residue audits. SENASICA is harmonizing its approval process with EPA norms, albeit at a slower pace. Capacity building through extension field schools aims to bridge technical gaps among smallholders.
Competitive Landscape
Market concentration is moderate. The North America agricultural biologicals market exhibits moderate concentration with increasing consolidation as major agrochemical companies acquire specialized biological firms to build integrated product portfolios. Strategic acquisitions have intensified competition, with established players like BASF, Bayer, and Corteva leveraging acquisition strategies to rapidly expand biological capabilities rather than developing internal research programs. The competitive dynamics favor companies with strong regulatory expertise and established distribution networks, as EPA's FIFRA registration requirements create significant barriers for new entrants lacking regulatory experience.
White-space opportunities exist in specialized application areas such as soil-applied biologicals for precision agriculture systems and consortium-based products that combine multiple beneficial microorganisms. Technology differentiation has become the primary competitive advantage, with companies investing heavily in strain isolation, genetic characterization, and formulation technologies to develop products with superior field performance and environmental stability.
Strategic collaborations are common. BASF tripled fermentation capacity in North Carolina to ease supply bottlenecks. Distribution pacts between European bio-specialists and U.S. farm retailers grant quick entry without heavy capital outlay. Competition increasingly shifts toward service-layer differentiation: agronomic advice, on-farm diagnostics, and performance guarantees.
North America Agricultural Biologicals Industry Leaders
Corteva Agriscience
Bayer AG
BASF SE
Syngenta Group
FMC Corporation
- *Disclaimer: Major Players sorted in no particular order

Recent Industry Developments
- October 2024: Corteva completed the Symborg acquisition, adding nitrogen-fixing microbes to its seed-treatment line. This acquisition is anticipated to strengthen the agricultural biologicals market in North America by enhancing sustainable farming practices and improving crop productivity.
- May 2024: EPA approved 12 new biological registrations in a single month, the highest on record. This development is anticipated to bolster the North American agricultural biologicals market by accelerating the availability of innovative solutions and supporting sustainable farming practices.
- July 2022: A new granular inoculant called LALFIX START SPHERICAL Granule was launched, which combines Bacillus velezensis, a plant growth-promoting microbe, with two distinct rhizobium strains. This powerful and well-tested PGPM boosts phosphorus solubilization and improves root mass.


North America Agricultural Biologicals Market Report Scope
Crop Nutrition and Crop Protection are covered as segments by Function. Cash Crops, Horticultural Crops, and Row Crops are covered as segments by Crop Type. Canada, Mexico, and United States are covered as segments by Country.
| Crop Nutrition | Biofertilizer | Azospirillum |
| Azotobacter | ||
| Mycorrhiza | ||
| Phosphate Solubilizing Bacteria | ||
| Rhizobium | ||
| Other Biofertilizer | ||
| Biostimulants | Amino Acids | |
| Fulvic Acid | ||
| Humic Acid | ||
| Protein Hydrolysates | ||
| Seaweed Extracts | ||
| Other Biostimulants | ||
| Organic Fertilizer | Manure | |
| Meal Based Fertilizers | ||
| Oilcakes | ||
| Other Organic Fertilizer | ||
| Crop Protection | Biocontrol Agents | Macrobials |
| Microbials | ||
| Biopesticides | Biofungicides | |
| Bioherbicides | ||
| Bioinsecticides | ||
| Other Biopesticides | ||
| Cash Crops |
| Horticultural Crops |
| Row Crops |
| Canada |
| Mexico |
| United States |
| Rest of North America |
| Function | Crop Nutrition | Biofertilizer | Azospirillum |
| Azotobacter | |||
| Mycorrhiza | |||
| Phosphate Solubilizing Bacteria | |||
| Rhizobium | |||
| Other Biofertilizer | |||
| Biostimulants | Amino Acids | ||
| Fulvic Acid | |||
| Humic Acid | |||
| Protein Hydrolysates | |||
| Seaweed Extracts | |||
| Other Biostimulants | |||
| Organic Fertilizer | Manure | ||
| Meal Based Fertilizers | |||
| Oilcakes | |||
| Other Organic Fertilizer | |||
| Crop Protection | Biocontrol Agents | Macrobials | |
| Microbials | |||
| Biopesticides | Biofungicides | ||
| Bioherbicides | |||
| Bioinsecticides | |||
| Other Biopesticides | |||
| Crop Type | Cash Crops | ||
| Horticultural Crops | |||
| Row Crops | |||
| Country | Canada | ||
| Mexico | |||
| United States | |||
| Rest of North America | |||


Market Definition
- AVERAGE DOSAGE RATE - The average application rate is the average volume of agricultural biologicals applied per hectare of farmland in the respective region/country.
- CROP TYPE - Crop type includes Row crops (Cereals, Pulses, Oilseeds), Horticultural Crops (Fruits and vegetables) and Cash Crops (Plantation Crops, Fibre Crops and Other Industrial Crops)
- FUNCTION - Agricultural biological products provide crops with essential nutrients, prevent or control abiotic & biotic stresses, and enhance soil quality.
- TYPE - The Crop Nutrition function of agricultural biologicals includes organic fertilizer and Biofertilizer, whereas the Crop Protection function includes Biostimulants, Biopesticides and Biocontrol Agents.
| Keyword | Definition |
|---|---|
| Cash Crops | Cash crops are non-consumable crops sold as a whole or part of the crop to manufacture end-products to make a profit. |
| Integrated Pest Management (IPM) | IPM is an environment-friendly and sustainable approach to control pests in various crops. It involves a combination of methods, including biological controls, cultural practices, and selective use of pesticides. |
| Bacterial biocontrol agents | Bacteria used to control pests and diseases in crops. They work by producing toxins harmful to the target pests or competing with them for nutrients and space in the growing environment. Some examples of commonly used bacterial biocontrol agents include Bacillus thuringiensis (Bt), Pseudomonas fluorescens, and Streptomyces spp. |
| Plant Protection Product (PPP) | A plant protection product is a formulation applied to crops to protect from pests, such as weeds, diseases, or insects. They contain one or more active substances with other co-formulants such as solvents, carriers, inert material, wetting agents or adjuvants formulated to give optimum product efficacy. |
| Pathogen | A pathogen is an organism causing disease to its host, with the severity of the disease symptoms. |
| Parasitoids | Parasitoids are insects that lay their eggs on or within the host insect, with their larvae feeding on the host insect. In agriculture, parasitoids can be used as a form of biological pest control, as they help to control pest damage to crops and decrease the need for chemical pesticides. |
| Entomopathogenic Nematodes (EPN) | Entomopathogenic nematodes are parasitic roundworms that infect and kill pests by releasing bacteria from their gut. Entomopathogenic nematodes are a form of biocontrol agents used in agriculture. |
| Vesicular-arbuscular mycorrhiza (VAM) | VAM fungi are mycorrhizal species of fungus. They live in the roots of different higher-order plants. They develop a symbiotic relationship with the plants in the roots of these plants. |
| Fungal biocontrol agents | Fungal biocontrol agents are the beneficial fungi that control plant pests and diseases. They are an alternative to chemical pesticides. They infect and kill the pests or compete with pathogenic fungi for nutrients and space. |
| Biofertilizers | Biofertilizers contain beneficial microorganisms that enhance soil fertility and promote plant growth. |
| Biopesticides | Biopesticides are natural/bio-based compounds used to manage agricultural pests using specific biological effects. |
| Predators | Predators in agriculture are the organisms that feed on pests and help control pest damage to the crops. Some common predator species used in agriculture include ladybugs, lacewings, and predatory mites. |
| Biocontrol agents | Biocontrol agents are living organisms used to control pests and diseases in agriculture. They are alternatives to chemical pesticides and are known for their lesser impact on the environment and human health. |
| Organic Fertilizers | Organic fertilizer is composed of animal or vegetable matter used alone or in combination with one or more non-synthetically derived elements or compounds used for soil fertility and plant growth. |
| Protein hydrolysates (PHs) | Protein hydrolysate-based biostimulants contain free amino acids, oligopeptides, and polypeptides produced by enzymatic or chemical hydrolysis of proteins, primarily from vegetal or animal sources. |
| Biostimulants/Plant Growth Regulators (PGR) | Biostimulants/Plant Growth Regulators (PGR) are substances derived from natural resources to enhance plant growth and health by stimulating plant processes (metabolism). |
| Soil Amendments | Soil Amendments are substances applied to soil that improve soil health, such as soil fertility and soil structure. |
| Seaweed Extract | Seaweed extracts are rich in micro and macronutrients, proteins, polysaccharides, polyphenols, phytohormones, and osmolytes. These substances boost seed germination and crop establishment, total plant growth and productivity. |
| Compounds related to biocontrol and/or promoting growth (CRBPG) | Compounds related to biocontrol or promoting growth (CRBPG) are the ability of a bacteria to produce compounds for phytopathogen biocontrol and plant growth promotion. |
| Symbiotic Nitrogen-Fixing Bacteria | Symbiotic nitrogen-fixing bacteria such as Rhizobium obtain food and shelter from the host, and in return, they help by providing fixed nitrogen to the plants. |
| Nitrogen Fixation | Nitrogen fixation is a chemical process in soil which converts molecular nitrogen into ammonia or related nitrogenous compounds. |
| ARS (Agricultural Research Service) | ARS is the U.S. Department of Agriculture's chief scientific in-house research agency. It aims to find solutions to agricultural problems faced by the farmers in the country. |
| Phytosanitary Regulations | Phytosanitary regulations imposed by the respective government bodies check or prohibit the importation and marketing of certain insects, plant species, or products of these plants to prevent the introduction or spread of new plant pests or pathogens. |
| Ectomycorrhizae (ECM) | Ectomycorrhiza (ECM) is a symbiotic interaction of fungi with the feeder roots of higher plants in which both the plant and the fungi benefit through the association for survival. |


Research Methodology
Mordor Intelligence follows a four-step methodology in all our reports.
- Step-1: Identify Key Variables: In order to build a robust forecasting methodology, the variables and factors identified in Step-1 are tested against available historical market numbers. Through an iterative process, the variables required for market forecast are set and the model is built on the basis of these variables.
- Step-2: Build a Market Model: Market-size estimations for the forecast years are in nominal terms. Inflation is not a part of the pricing, and the average selling price (ASP) is kept constant throughout the forecast period.
- Step-3: Validate and Finalize: In this important step, all market numbers, variables and analyst calls are validated through an extensive network of primary research experts from the market studied. The respondents are selected across levels and functions to generate a holistic picture of the market studied.
- Step-4: Research Outputs: Syndicated Reports, Custom Consulting Assignments, Databases & Subscription Platforms.


