Ethylene Vinyl Acetate Market Size and Share
Market Overview
| Study Period | 2021 - 2031 |
|---|---|
| Market Volume (2026) | 5.08 Million tons |
| Market Volume (2031) | 6.52 Million tons |
| Growth Rate (2026 - 2031) | 5.10% CAGR |
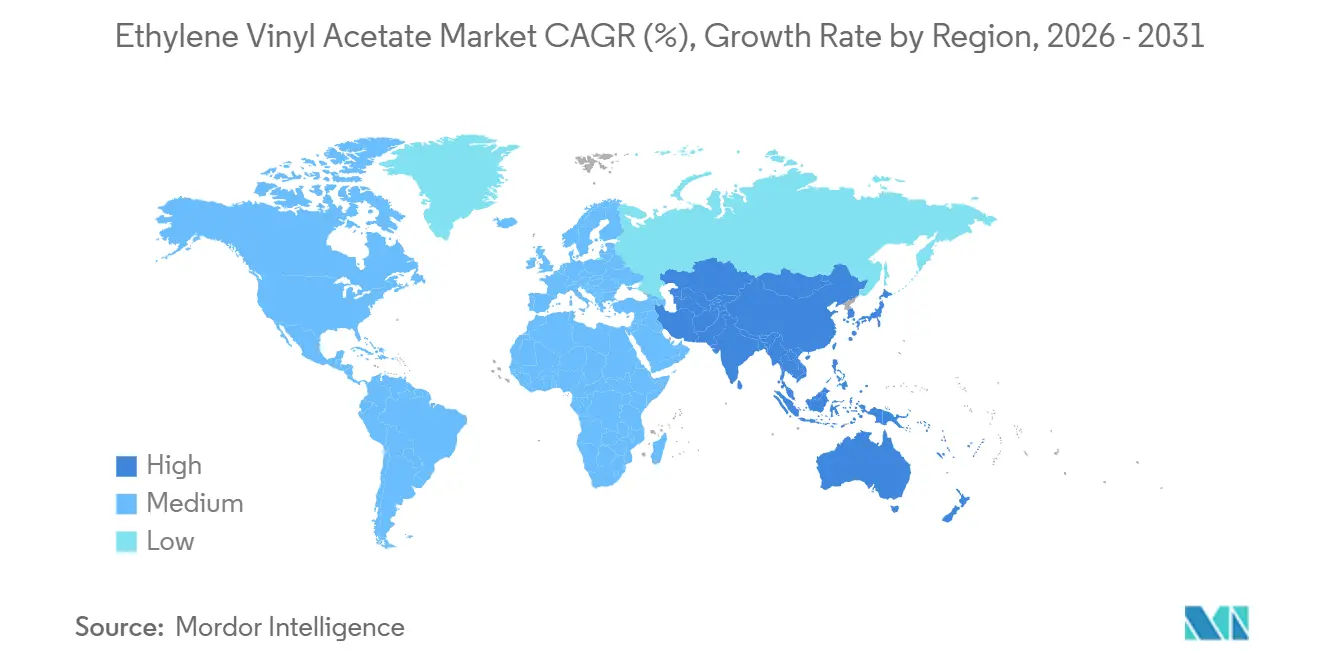
| Fastest Growing Market | Asia Pacific |
| Largest Market | Asia Pacific |
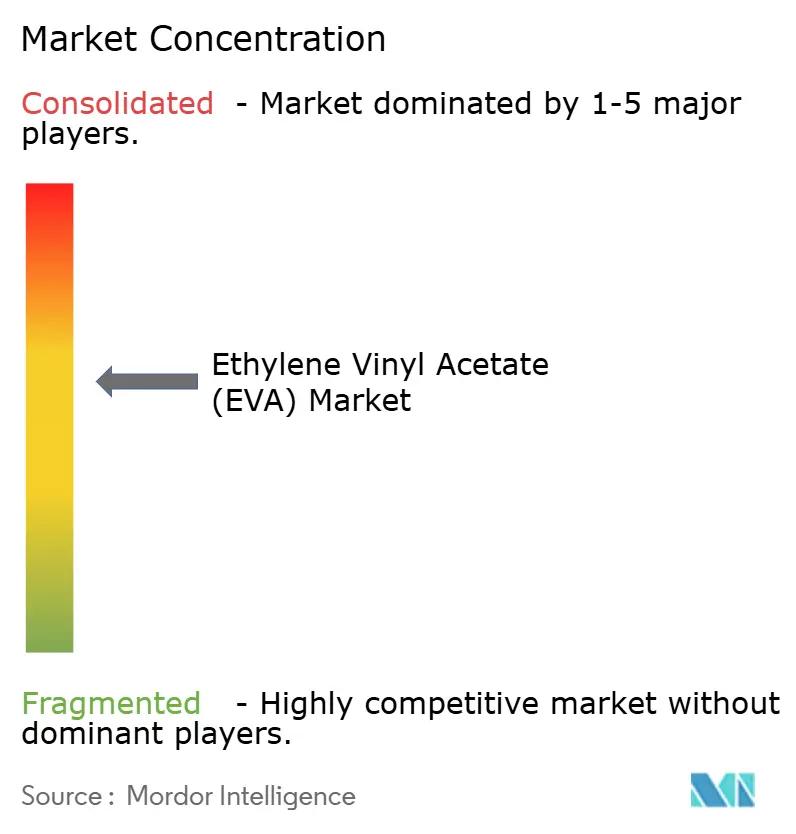
| Market Concentration | Medium |
Major Players *Disclaimer: Major Players sorted in no particular order Image © Mordor Intelligence. Reuse requires attribution under CC BY 4.0. | |

Ethylene Vinyl Acetate Market Analysis by Mordor Intelligence
The Ethylene Vinyl Acetate Market size was valued at 4.84 million tons in 2025 and is estimated to grow from 5.08 million tons in 2026 to reach 6.52 million tons by 2031, at a CAGR of 5.10% during the forecast period (2026-2031). Persistent growth stems from solar‐photovoltaic encapsulants, Asian footwear foam production, and the migration of e-commerce packaging toward recyclable multilayer films. However, the industry wrestles with feedstock swings in ethylene and vinyl acetate monomer (VAM), as well as substitution threats from polyolefin elastomers (POE) and thermoplastic polyurethanes (TPU). Integrated petrochemical groups maintain margin resilience by backward integrating into ethylene and VAM, while smaller converters face intense competition from rising Korean and Chinese capacities. Bio‐based and recycled grades, meanwhile, create premium niches as regulators demand circular content.
Key Report Takeaways
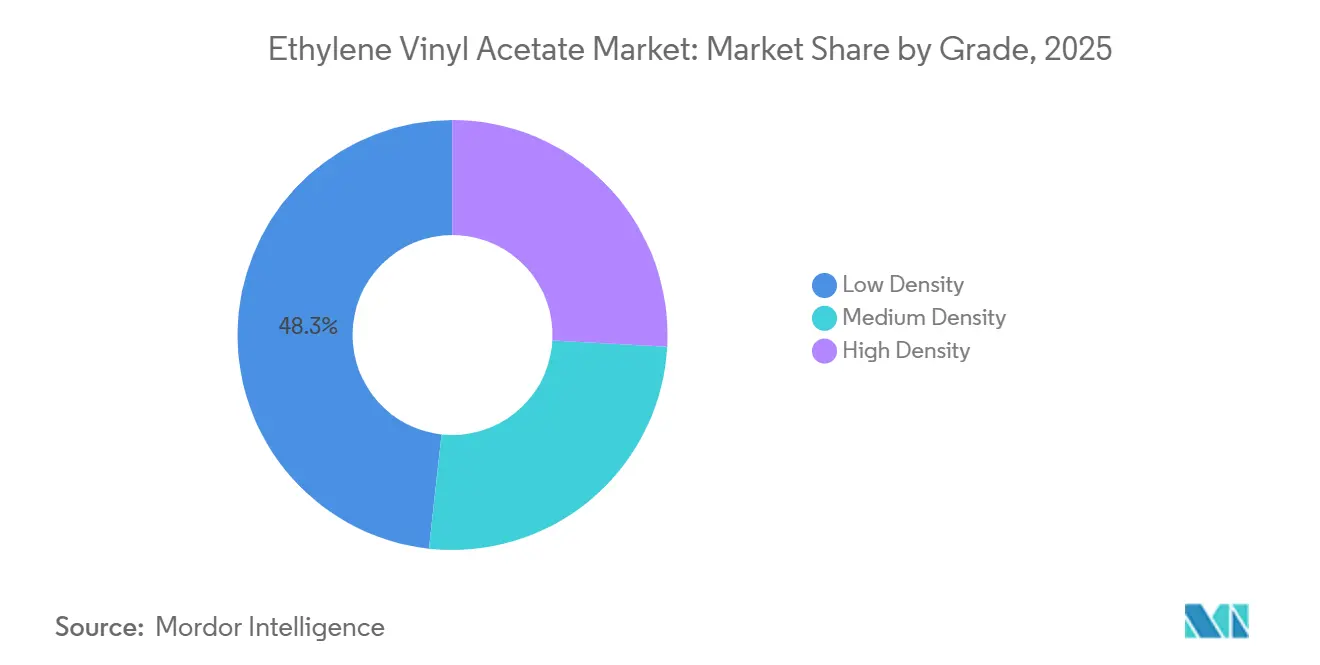
- By grade, low-density EVA held 48.25% of the ethylene vinyl acetate market share in 2025; high-density grades are forecast to grow at a 6.46% CAGR through 2031.
- By application, films accounted for 44.90% of the ethylene vinyl acetate market size in 2025, while solar cell encapsulation is set to expand at a 7.01% CAGR to 2031.
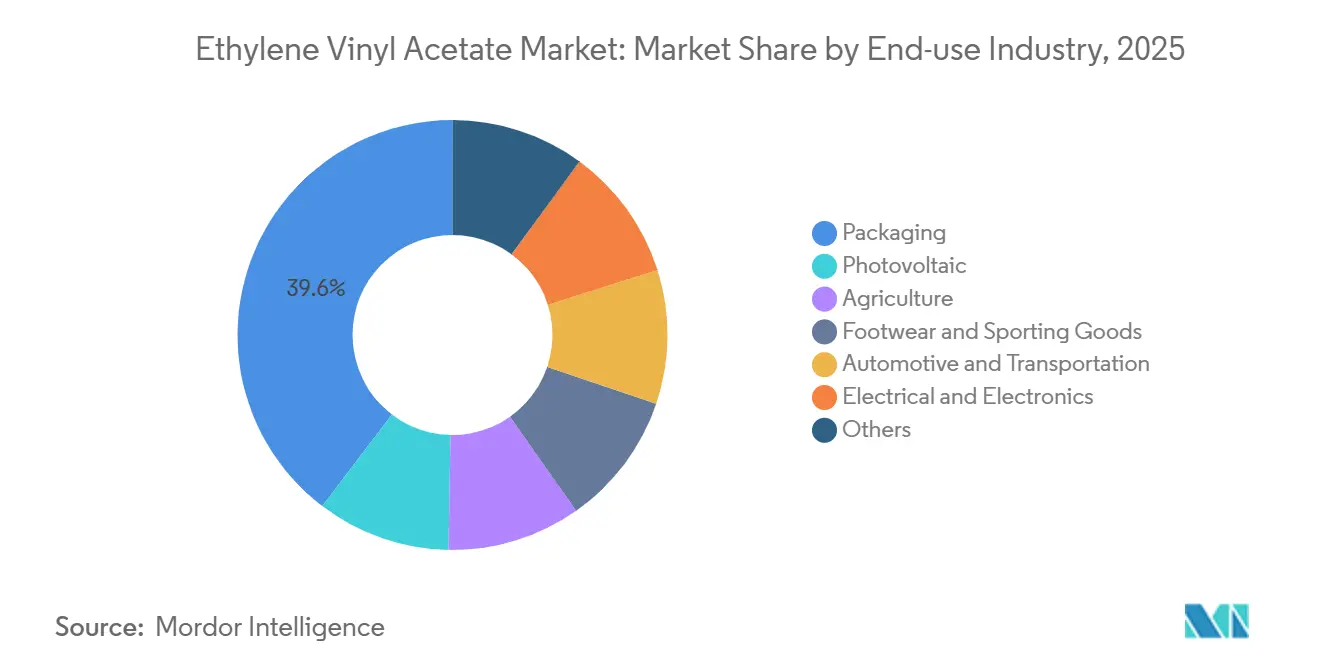
- By end-use, packaging led with 39.64% revenue share in 2025; photovoltaic applications will post the fastest 6.59% CAGR between 2026 and 2031.
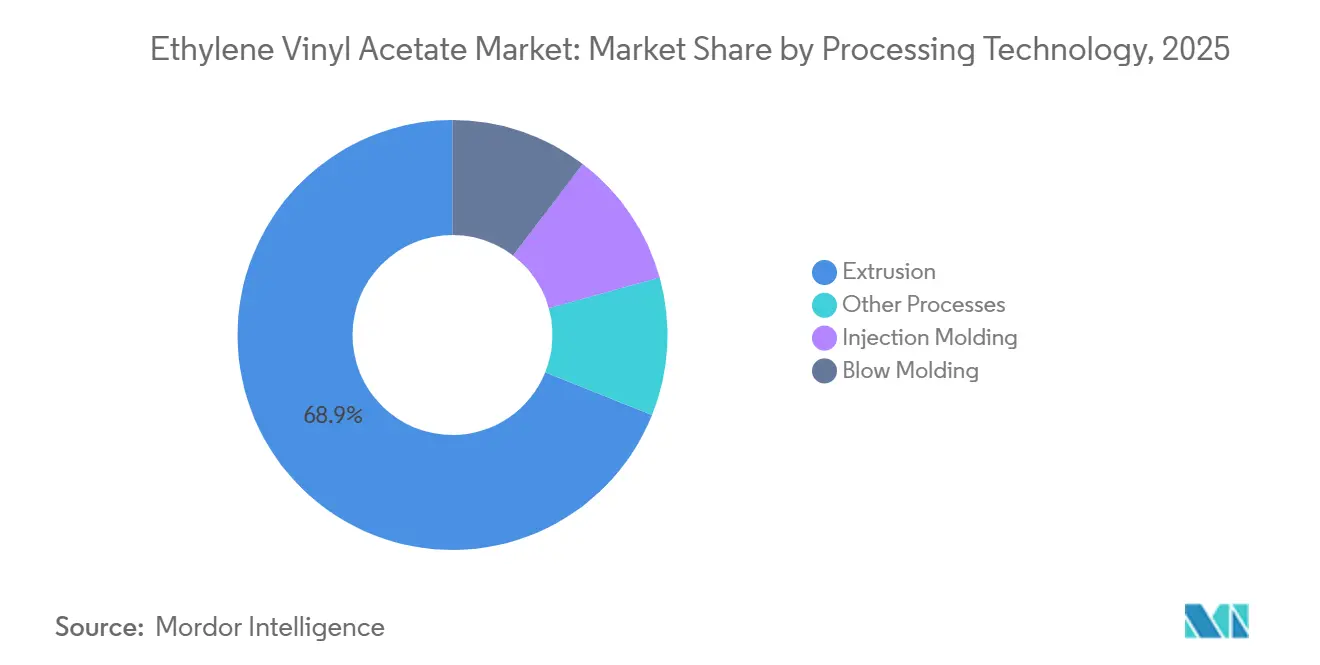
- By processing technology, extrusion captured 68.94% share of the ethylene vinyl acetate market size in 2025 and is advancing at a 6.18% CAGR through 2031.
- Asia-Pacific commanded 63.11% of the ethylene vinyl acetate market share in 2025 and is projected to grow at a 6.51% CAGR to 2031.
Note: Market size and forecast figures in this report are generated using Mordor Intelligence’s proprietary estimation framework, updated with the latest available data and insights as of January 2026.
Global Ethylene Vinyl Acetate Market Trends and Insights
Driver Impact Analysis*
| Drivers | (~) % Impact on CAGR Forecast | Geographic Relevance | Impact Timeline |
|---|---|---|---|
| Surge in Asian footwear output based on lightweight EVA foams | +1.2% | APAC core (India, Vietnam, China), spill-over to Southeast Asia | Medium term (2-4 years) |
| Packaging shift to recyclable multilayer EVA films in North America | +0.8% | North America and EU | Long term (≥ 4 years) |
| Rapid solar-PV build-out boosting high-VA EVA encapsulants | +1.9% | Global, with concentration in APAC, Middle East, Southern Europe | Short term (≤ 2 years) |
| APAC e-commerce explosion driving demand for EVA hot-melt adhesives | +0.7% | APAC core, emerging in Latin America | Medium term (2-4 years) |
| Autoclave-route EVA capacity expansions lowering unit costs | +0.5% | Global, led by China, Middle East, North America | Long term (≥ 4 years) |
| Source: Mordor Intelligence | |||
Surge in Asian Footwear Output Based on Lightweight EVA Foams
India’s footwear sector consumes roughly 55% of domestic EVA, dominated by injection-molded soles and lightweight sandals that reduce shipping costs and improve comfort. Contract manufacturing is shifting from China’s coastal hubs to Vietnam and Indonesia, lifting regional demand for compression-molded EVA foams. Patent filings in 2024–2025 document multi-hardness formulations that lower shrinkage and enable tighter tolerances for automated assembly lines[1]Chinese National Intellectual Property Administration, “EVA Sole Patents,” cnipa.gov.cn. ISO 9001-certified plants achieve consistent density profiles essential for robotic footwear insertion. Yet TPU midsoles are encroaching on premium running shoes because they deliver higher energy return and can be reground, aligning with circular-economy mandates[2]BASF, “Polyurethane Footwear Solutions,” basf.com. Producers able to deliver ultra-light, high-rebound EVA grades at competitive prices will protect their share in the mass-market segment.
Packaging Shift to Recyclable Multilayer EVA Films in North America
Extended producer responsibility laws in California, Colorado, Maine, and Oregon levy fees on non-recyclable packaging, prompting converters to redesign multilayer films around recyclable structures that retain EVA tie-layers below 5 wt%. The European Union’s Packaging and Packaging Waste Regulation 2025/40 ramps recycled-content requirements to 35% by 2030 and 65% by 2040. Dow and Valoregen’s circular-feedstock deal will supply 15,000 t per year of certified content, while Mura Technology targets 600,000 t of advanced-recycling output by 2030. Celanese lifted Edmonton capacity by 35% in 2023 to meet recyclable-film demand. Brand owners paying eco-modulated fees favor resins that carry ISCC PLUS certificates, ensuring traceable circular attribution.
Rapid Solar-PV Build-Out Boosting High-VA EVA Encapsulants
Solar levelized costs below USD 0.03/kWh in high-irradiance regions are inducing multi-GW procurement pipelines. China produced 800 GW of modules in 2024, yet Longi Green Energy posted a RMB 5.26 billion loss on a 60% price collapse, showing that volume growth does not equate to profitability. High-VA EVA (28%–33% VA) remains the dominant encapsulant at 42% share, prized for optical clarity and adhesion. However, Dow’s ENGAGE POE limits power loss to 0.3% over 25 years versus 35% for conventional EVA, expanding POE share to 11%–14%. India’s antidumping duties of USD 537–1,559/ton on EVA imports fragment supply chains and underscore security-of-supply risk. Suppliers investing in autoclave capacity and localized feedstocks can ride the solar wave while defending margins.
APAC E-Commerce Explosion Driving Demand for EVA Hot-Melt Adhesives
China shipped more than 120 billion parcels in 2024, and India’s e-commerce parcel count is rising at double digits as digital payments proliferate. EVA hot-melt bonds recycled carton board at conveyor speeds above 1,000 boxes per hour without solvents, suiting automated warehouses. Nevertheless, polyolefin-based adhesives offer superior heat resistance in tropical hubs that regularly exceed 40 °C. Celanese expanded its Nanjing vinyl-acetate-ethylene line by 70,000 t in April 2024 to feed Southeast Asian hot-melt formulators. Multinationals now audit suppliers for ISO 14001 compliance, making environmental certification a qualifying hurdle.
Restraint Impact Analysis*
| Restraints | (~) % Impact on CAGR Forecast | Geographic Relevance | Impact Timeline |
|---|---|---|---|
| Ethylene and VAM feedstock price volatility | -0.9% | Global, acute in import-dependent regions (Europe, Southeast Asia) | Short term (≤ 2 years) |
| EU and US single-use-plastic crackdowns | -0.6% | EU, North America, spill-over to export-oriented Asian producers | Medium term (2-4 years) |
| POE and TPU gaining share in solar and footwear | -0.7% | Global, concentrated in premium segments (high-efficiency modules, athletic footwear) | Long term (≥ 4 years) |
| Source: Mordor Intelligence | |||
Ethylene and VAM Feedstock Price Volatility
Spot ethylene averaged USD 835-845/t CFR Southeast Asia in September 2025, down 15% year-on-year as new crackers came online in China and the Middle East. VAM tracks acetic acid and ethylene, creating dual exposure that strains non-integrated EVA players. Korean majors cut more than 3.66 million t of ethylene output in December 2025, pushing operating rates below 70% and idling crackers at LG Chem, Lotte Chemical, and Hanwha Solutions. Europe faces added cost from the Carbon Border Adjustment Mechanism in 2026, punishing fossil-based feedstocks. Dow’s Fort Saskatchewan net-zero ethylene project aims to decouple margins from fossil volatility by 2029. Long-term ethane or bio-naphtha contracts will differentiate cost leaders from spot buyers.
EU and US Single-Use-Plastic Crack-Downs
The EU Single-Use Plastics Directive bans several disposable items and requires 90% bottle-collection rates by 2029, creating a cost pass-through to resin producers. The new Packaging and Packaging Waste Regulation grades films for recyclability and demands 35% recycled content by 2030, penalizing multilayer laminates lacking circular design. California SB 54 similarly obliges brand owners to finance collection schemes, raising non-recyclable formats’ unit cost by up to USD 0.05. REACH preregistration for VAM adds laboratory and dossier expenses that smaller EVA producers struggle to absorb. Firms forging chemical-recycling partnerships secure certified circular feedstock that satisfies regulators and unlocks premium pricing.
*Our forecasts treat driver/restraint impacts as directional, not additive. The impact forecasts reflect baseline growth, mix effects, and variable interactions.
Segment Analysis
By Grade: Premium Solar Needs Lift High-Density EVA
High-density EVA achieved a 6.46% CAGR outlook through 2031 as bifacial and heterojunction solar modules require 28%–33% VA content to guarantee optical transmission and adhesion across 25 years, placing the segment ahead of overall ethylene vinyl acetate market growth. Low-density resin, dominant at 48.25% in 2025, underpins commodity films and mass-market footwear that value melt-flow indices above 20 g/10 min for fast cycle times. Tubular reactors supply these grades at lower capital cost, maintaining competitiveness in price-sensitive packaging. Medium-density EVA bridges hot-melt adhesives and wire-cable jacketing, where flow and cohesive strength must balance. ISCC PLUS-certified biomass EVA from Dow-Mitsui, launched in September 2024, offers a drop-in replacement across density tiers for brand owners disclosing Scope 3 emissions. Compliance with US FDA 21 CFR 177.1350 and EU Reg 10/2011 caps VA content at 50% and sets migration limits, forcing solar-grade suppliers to validate low residual monomer levels.
Localization plays heavily in China, which hit 70% solar-grade self-sufficiency in 2023 and pursues 85% by 2030, cutting import reliance on South Korean and Japanese producers subject to Indian antidumping duties. BASF-YPC plans a 300,000 ton expansion in Nanjing, leveraging LyondellBasell tubular technology to service both domestic solar and export customers. Low-density resin faces substitution from TPU midsoles in high-performance sports shoes but retains primacy in cost-driven markets. Agricultural greenhouse films continue to specify medium-density EVA with UV stabilizers to extend service life beyond five seasons in Mediterranean climates.


By Application: Solar Encapsulation Surges Past Films
Solar encapsulation will accelerate at 7.01% through 2031, overtaking flat film volume as global photovoltaic installations surpass 400 GW annually. The ethylene vinyl acetate market size for films remains significant at 44.90% in 2025, serving snack packaging, greenhouse covers, and laminated safety glass, yet its trajectory slows under single-use-plastic restrictions. Adhesives capture logistics tailwinds from e-commerce, although POE systems are winning share where heat resistance is vital. Foams for sandals, yoga mats, and buoyancy aids remain a mature arena; innovation now focuses on multi-color injection molding and anti-shrinkage additives. Other uses, including photovoltaic cables and LCD protective sheets, depend on evolving IEC and ISO standards that favor low-VOC resins.
Films intended for EU markets must incorporate 35% recycled content by 2030 and meet design-for-recycling Grade A, motivating converters to adopt mono-material polyethylene structures with EVA tie-layers kept below 5 wt%. Hot-melt formulators are purging phthalates in line with the ZDHC Restricted Substances List, pushing EVA producers to certify low-migration additive packages. Foam suppliers in athletic footwear are now balancing density reduction against rebound energy to compete with TPU’s 60% return benchmark.
By End-Use Industry: Photovoltaics Redraw Demand Mix
Photovoltaic installations will post a 6.59% CAGR, making them the fastest-growing end-use and reshaping the ethylene vinyl acetate market. Packaging still led at 39.64% in 2025, but extended producer responsibility fees are dampening growth. Agriculture leverages EVA greenhouse films that maintain photosynthetically active radiation transmission while filtering UV, extending crop cycles in Spain, Turkey, and Morocco. Footwear and sporting goods continue to buy EVA for lightness, though TPU captures premium niches requiring high energy return and recyclability. Automotive wire harnesses adopt EVA insulation compliant with IEC 62930 for rooftop PV cables, while electronics manufacturers specify clean-room-produced EVA for LCD protection films.
China’s 800 GW module output in 2024 signaled solar scale, yet Longi’s loss proved that volume does not guarantee profit. Indian antidumping measures raise localized resin prices, prompting domestic capacity expansion. Packaging converters tracking EU rules are negotiating long-term supply of certified circular EVA to avoid surcharges. Footwear brands now audit supplier factories for ISO 14001, consolidating orders among plants demonstrating low VOC emissions and tight density control.
By Processing Technology: Extrusion Remains Unassailable
Extrusion captured 68.94% of 2025 volume and will rise at 6.18% CAGR, reflecting high-throughput production of films and foams. Injection molding remains important for footwear soles and thin-wall parts but demands higher mold investment. Blow molding is confined to buoyancy aids and toys due to EVA’s melt viscosity, while compression molding continues in thick sheet foams. Celanese’s Edmonton debottleneck in 2023 added extrusion-grade capacity tailored to recyclable film converters. BASF-YPC’s forthcoming line will use tubular extrusion to supply medium- and high-density solar encapsulant resin. ISCC PLUS biomass EVA now offers processors a drop-in option without altering extruder screws or temperature profiles. Injection molders target melt-flow index optimization to shorten cycles, and Chinese patents reveal anti-shrinkage agents enabling multi-color soles with consistent dimensions. Industry 4.0 retrofits—melt-pressure sensors and AI-driven predictive maintenance—help converters cut scrap, lower energy use, and pull ahead of legacy plants.
Geography Analysis
Asia-Pacific contributed 63.11% of global ethylene vinyl acetate market volume in 2025 and will grow at 6.51% through 2031, buoyed by Chinese solar dominance and Indian footwear manufacturing. China operated 2.45 million tons of annual EVA capacity at 90.66% utilization in December 2023, yet still imported high-VA grades, prompting northwest coal-to-olefins investments. Zhenhai’s 1.5 million t ethylene expansion in 2024 and the Gulei Phase 2 cracker slated for 2025 reinforce upstream integration. South Korean players slashed 3.66 million t ethylene in 2025 due to oversupply, pressuring operating rates. Japanese producers such as Dow-Mitsui and Tosoh specialize in high-purity solar resin for export to Southeast Asia. India’s antidumping tariffs protect domestic EVA capacity but raise module production costs, accelerating interest in local autoclave projects.
North America held a mid-teens share in 2025. Celanese’s 35% Edmonton lift readied supply for recyclable film makers navigating new state EPR laws. Dow’s net-zero Fort Saskatchewan ethylene facility, planned for 2029 start-up, aims to shield margins from carbon taxes. Braskem’s USD 800 million Rio de Janeiro expansion will add 220,000 tons of ethylene by 2028 but hinges on financing stability. Mexico’s proximity to U.S. OEMs anchors automotive wiring demand, while greenhouse film consumption rises in high-value horticulture.
Europe’s share remains in the low double digits, constrained by strict waste and carbon rules. The Packaging and Packaging Waste Regulation demands 35% recycled content and could classify non-recyclable films as Grade C, triggering penalties. REACH dossiers for VAM drive compliance overhead. Germany and Italy still use EVA in rooftop solar and agriculture, but processors must certify low migration for food packaging. The Middle East is building integrated chains, exemplified by ADNOC’s Ruwais expansion and Saudi Aramco’s Jafurah field, preparing export barrels for Asia. South America experiences episodic growth, with Brazil’s agriculture films offsetting economic volatility; Argentine inflation curbs import capability despite greenhouse demand.

Competitive Landscape
The ethylene vinyl acetate market is moderately consolidated. Integrated groups enjoy feedstock control and global distribution, while regional Chinese companies erode price through capacity additions. Strategic moves revolve around low-cost geography expansions (northwest China coal-to-olefins, Middle East ethane-rich sites), certified circular feedstock agreements (Dow–Valoregen, Dow–Mura), and high-VA solar encapsulant innovation to mitigate POE substitution. Bio-based and recycled grades command 10%–15% premiums and help producers penetrate regulated packaging and footwear niches. Technology focus splits between tubular reactors for commodity films and autoclave units for narrow-MW solar grades. ISO 9001 and ISO 14001 certification, plus REACH VAM registration, form the license to operate in global value chains. Industry 4.0 controls cut defect rates, favoring producers who retrofit legacy lines before smaller rivals can match costs.
Ethylene Vinyl Acetate Industry Leaders
Exxon Mobil Corporation
Sinopec Yanshan Petrochemical Company
LOTTE Chemical Corporation
Dow
LG Chem
- *Disclaimer: Major Players sorted in no particular order

Recent Industry Developments
- September 2024: Dow-Mitsui Polychemicals began marketing EVAFLEX biomass EVA and MIRASON biomass LDPE, both ISCC PLUS-certified under mass-balance accounting, for flexible packaging and footwear applications.
- May 2024: The Dow-Mitsui Chiba plant secured ISCC PLUS certification, enabling biomass-attributed EVA production for Asia-Pacific customers.
- April 2024: Celanese completed a 70,000 ton per year vinyl-acetate-ethylene expansion at Nanjing JV to serve Southeast Asian hot-melt adhesive compounders.


Research Methodology Framework and Report Scope
Market Definitions and Key Coverage
Our study defines the ethylene-vinyl acetate (EVA) market as all newly produced low, medium, and high-density copolymer resins obtained by high-pressure co-polymerization of ethylene and vinyl acetate. The scope captures bulk resin volumes sold to converters for films, foams, photovoltaic encapsulants, adhesives, wire and cable jackets, and related applications.
(Exclusion) Finished consumer goods that merely contain EVA, such as footwear or laminated glass, are not valued within our baseline, thereby avoiding double counting.
Segmentation Overview
- By Grade
- Low Density
- Medium Density
- High Density
- By Application
- Films
- Adhesives
- Foams
- Solar Cell Encapsulation
- Other Applications
- By End-use Industry
- Packaging
- Photovoltaic
- Agriculture
- Footwear and Sporting Goods
- Automotive and Transportation
- Electrical and Electronics
- Others
- By Processing Technology
- Extrusion
- Injection Molding
- Blow Molding
- Other Processes
- By Geography
- Asia-Pacific
- China
- India
- Japan
- South Korea
- Rest of Asia-Pacific
- North America
- United States
- Canada
- Mexico
- Europe
- Germany
- United Kingdom
- France
- Italy
- Rest of Europe
- South America
- Brazil
- Argentina
- Rest of South America
- Middle East and Africa
- Saudi Arabia
- United Arab Emirates
- South Africa
- Egypt
- Rest of Middle East and Africa
- Asia-Pacific
Detailed Research Methodology and Data Validation
Primary Research
Mordor analysts next interviewed plant engineers, masterbatch formulators, packaging converters, and solar module lamination specialists across Asia-Pacific, North America, and Europe. Their insights on vinyl acetate content preferences, contract prices, and offtake seasonality allowed us to tighten loss factors and regional demand splits before finalizing the model.
Desk Research
We began with public statistical repositories, UN Comtrade trade codes for 390130, Eurostat PRODCOM, and the USGS Mineral Yearbook, so our base supply picture rested on traceable import-export and production filings. Industry associations such as SolarPower Europe, PlasticsEurope, and the China Plastics Processing Industry Association then helped us cross-check photovoltaic sheet and flexible packaging demand. Company 10-Ks, investor decks, and patent landscapes were mined through D&B Hoovers and Dow Jones Factiva for capacity additions, planned shutdowns, and price disclosures that sharpen unit value ranges. This list is illustrative; many other credible open publications fed our desk validation.
Market-Sizing & Forecasting
We start with a top-down production plus net trade reconstruction of global resin availability and then corroborate totals through selective bottom-up checks such as sampled average selling price multiplied by output from six major producers. Key variables like crude to naphtha spreads, vinyl acetate monomer costs, solar PV installation rates, footwear pair production, and regional packaging film tonnage drive our demand pool. A multivariate regression with ARIMA overlays projects each variable and feeds our five-year forecast, while gap patches, for example, unreported tolling volumes, are bridged using converter survey ratios agreed in primary calls.
Data Validation & Update Cycle
Every quarter we run variance screens that flag deviations over two standard deviations from historical price volume pairs. Findings pass through a senior analyst peer review, and material events, such as new 200 ktpa plant start-ups and trade tariffs, trigger interim refreshes; otherwise, the full dataset is rebuilt annually before report release.
Why Mordor's Ethylene Vinyl Acetate Baseline Stands Firm
Published figures often differ because firms toggle between weight and value metrics, bundle downstream goods, or rely on outdated capacity tables. We disclose our unit weight baseline and refresh it yearly, which, coupled with converter interviews, gives clients a dependable anchor.
Key gap drivers elsewhere include revenue-based sizing that folds in EVA-rich finished items, older base years, and lighter anomaly screening; currency conversions at fixed rates also widen spreads when resin pricing is volatile.
Benchmark comparison
| Market Size | Anonymized source | Primary gap driver |
|---|---|---|
| 4.84 million tons (2025) | Mordor Intelligence | |
| USD 12.07 billion (2024) | Global Consultancy A | Values finished goods and uses static average prices; refresh cycle biennial |
| USD 9.7 billion (2021) | Industry Association B | Older base year and partial regional coverage |
| USD 8.31 billion (2023) | Trade Journal C | Excludes high VA specialty grades and applies ex-factory pricing only |
These comparisons show that while others swing high or low depending on scope choices, Mordor's disciplined resin only, volume first build delivers a transparent, reproducible baseline that decision makers can confidently adjust for their unique value conversions.


Key Questions Answered in the Report
How large is the ethylene vinyl acetate market in 2026?
It is estimated at 5.08 million tons in 2026 and is forecast to climb to 6.52 million tons by 2031.
Which segment grows fastest within EVA applications?
Solar cell encapsulation is projected to expand at a 7.01% CAGR through 2031 as global PV installations soar.
What region dominates EVA demand?
Asia-Pacific controls 63.11% of global volume, led by China’s solar module output and India’s footwear industry.
Why is EVA facing substitution in solar modules?
POE encapsulants eliminate acetic-acid-induced degradation, reducing 25-year power loss from 35% to 0.3% in field trials.
How are regulations shaping EVA packaging demand?
By 2030, EU and U.S. EPR laws mandate recycled content, pushing converters to embrace circular EVA grades.
What drives EVA price volatility?
Fluctuating ethylene and VAM feedstock costs, amplified by regional oversupply and new carbon levies in Europe.
Page last updated on:


