Ethylene Glycol Market Size and Share
Market Overview
| Study Period | 2021 - 2031 |
|---|---|
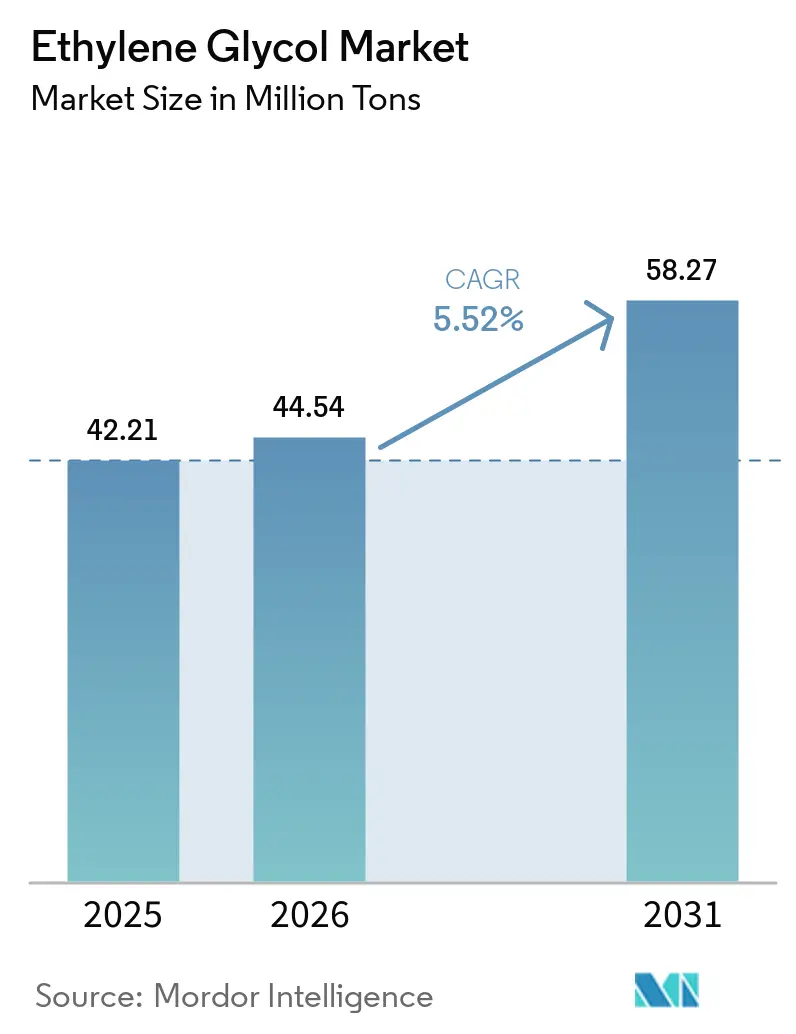
| Market Volume (2026) | 44.54 Million tons |
| Market Volume (2031) | 58.27 Million tons |
| Growth Rate (2026 - 2031) | 5.52% CAGR |
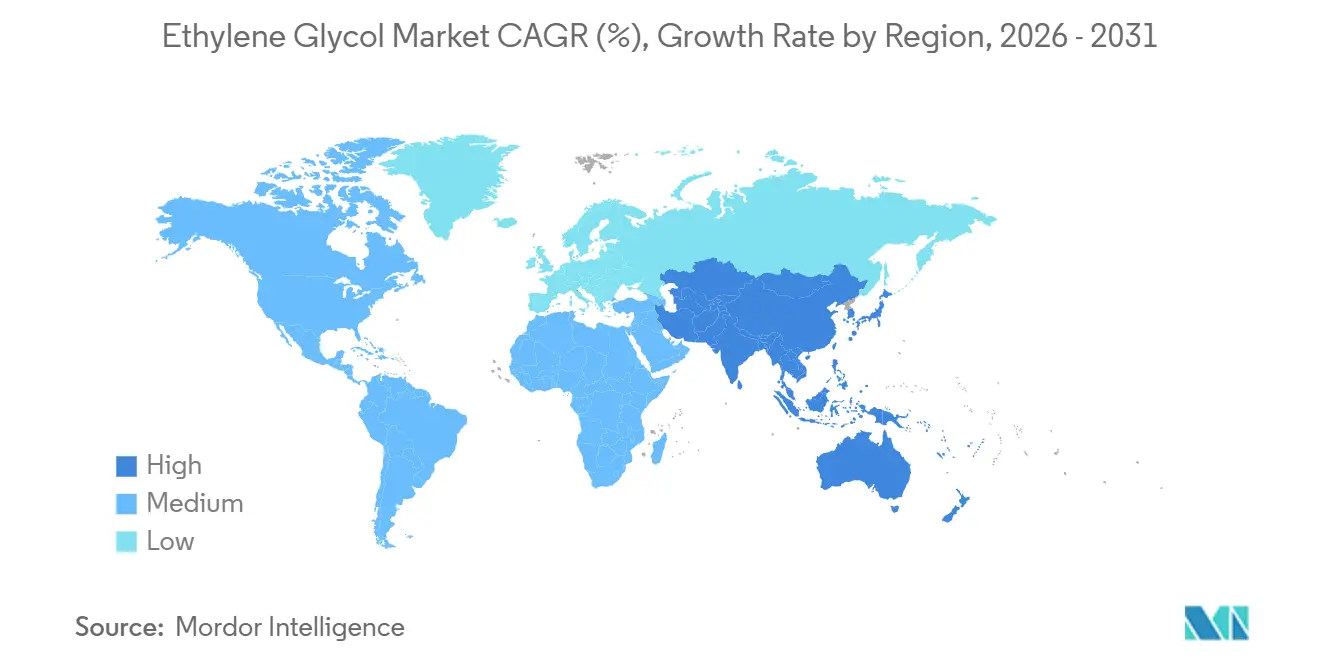
| Fastest Growing Market | Asia Pacific |
| Largest Market | Asia Pacific |
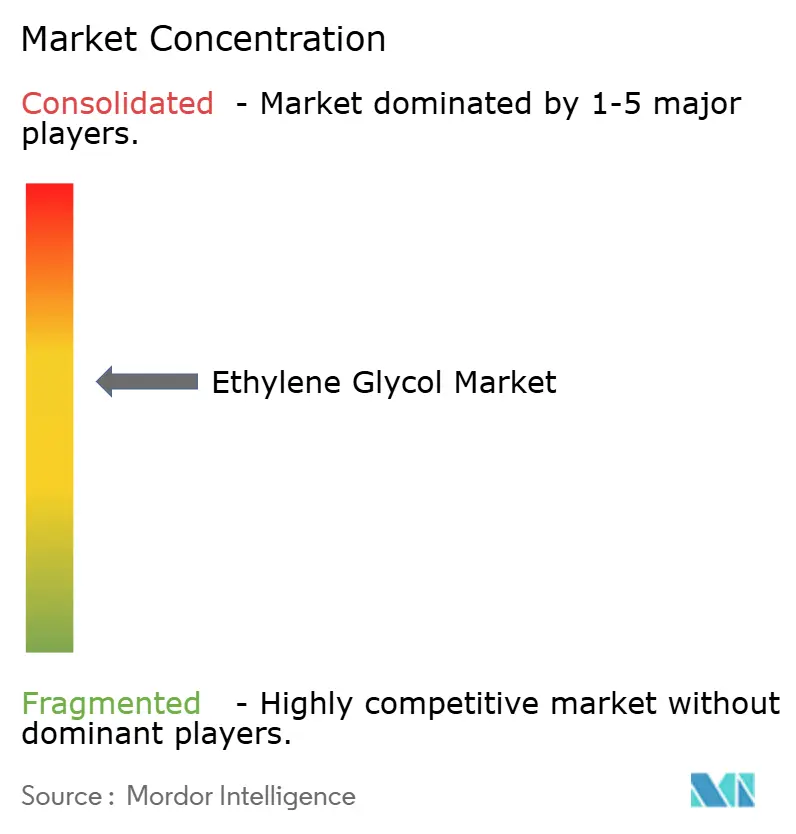
| Market Concentration | Medium |
Major Players *Disclaimer: Major Players sorted in no particular order Image © Mordor Intelligence. Reuse requires attribution under CC BY 4.0. | |
Ethylene Glycol Market Analysis by Mordor Intelligence
The Ethylene Glycol Market size is projected to expand from 42.21 Million tons in 2025 and 44.54 Million tons in 2026 to 58.27 Million tons by 2031, registering a CAGR of 5.52% between 2026 to 2031. Rising demand for battery-electric-vehicle (BEV) coolant blends, chemical-recycled monoethylene glycol (rMEG) loops, and bio-based routes is balancing the decline in virgin PET consumption in developed regions. Asia-Pacific continues to be a key supply region, with China’s self-sufficiency expected to reach 99% by 2030, reducing its import dependency even as new coastal mega-crackers add low-cost capacity. North American producers are benefiting from shale-gas economics; Dow’s expanded ethylene supply to MEGlobal’s Oyster Creek unit has enhanced feedstock flexibility for both domestic antifreeze demand and export polyester streams. Meanwhile, policy-driven circularity goals in the European Union and California are accelerating the adoption of recycled content, encouraging converters to shift toward chemically recycled feedstocks to sustain margins.
Key Report Takeaways
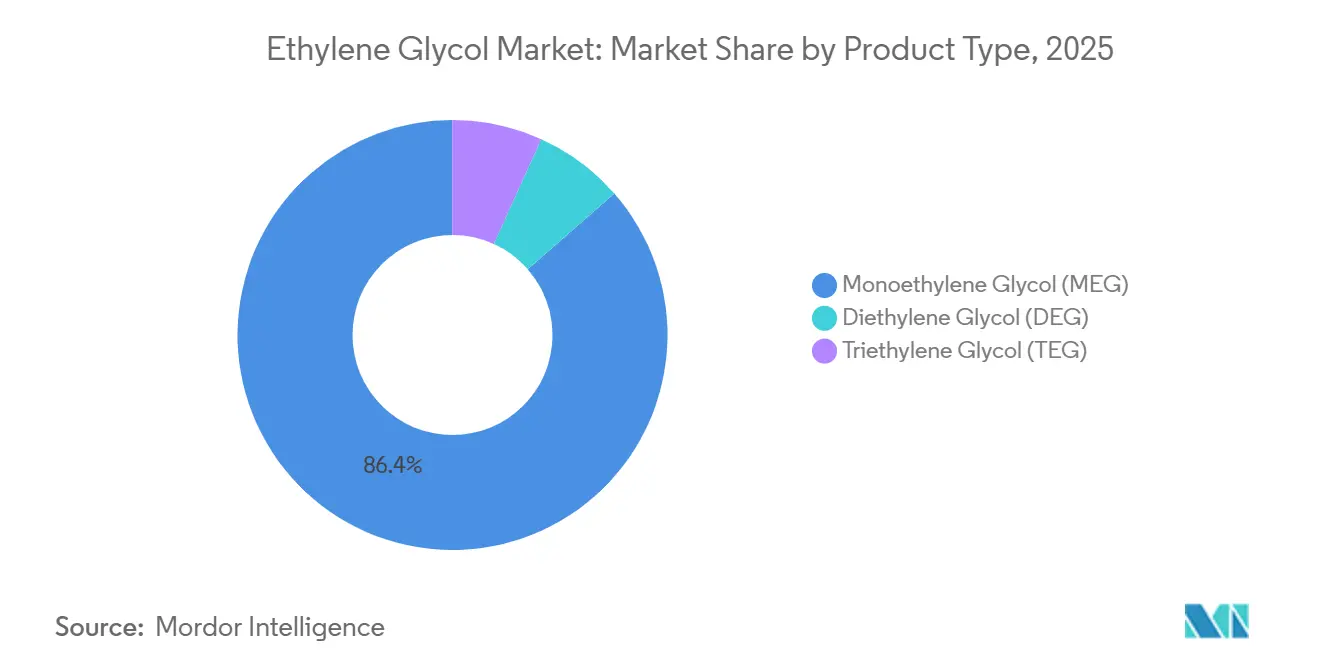
- By product type, monoethylene glycol (MEG) led with 86.44% of the ethylene glycol market share in 2025, while diethylene glycol (DEG) is forecast to expand at an 8.47% CAGR through 2031.
- By manufacturing process, the ethylene-oxide route led with 77.79% of the ethylene glycol market share in 2025, while the bio-based route is forecast to expand at a 9.23% CAGR through 2031.
- By application, polyester fiber led with 46.57% of the ethylene glycol market share in 2025, while PET is forecast to expand at a 5.89% CAGR through 2031.
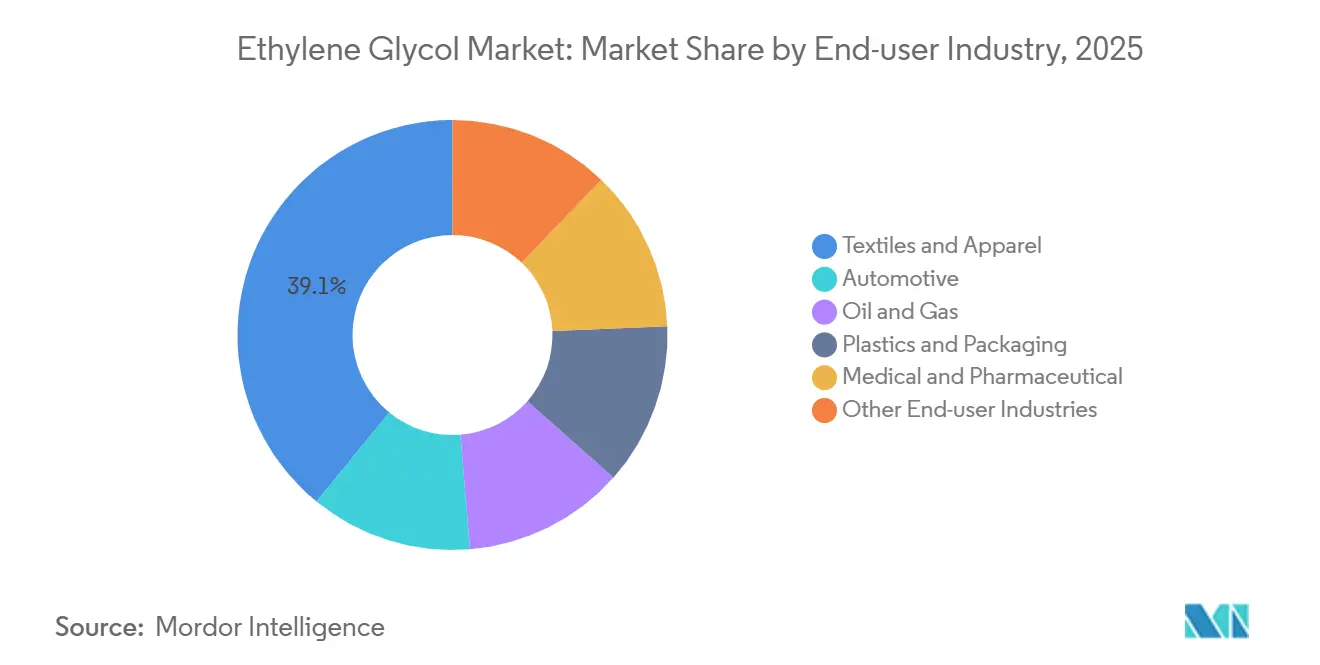
- By end-user industry, textiles and apparel accounted for 39.11% of the ethylene glycol market share in 2025, while automotive is advancing at a 6.03% CAGR through 2031.
- By geography, Asia-Pacific accounted for 59.22% of the ethylene glycol market share in 2025 and is advancing at a 5.78% CAGR through 2031.
Note: Market size and forecast figures in this report are generated using Mordor Intelligence’s proprietary estimation framework, updated with the latest available data and insights as of January 2026.
Market Trends and Insights
Drivers Impact Analysis of Ethylene Glycol Market*
| Driver | (~) % Impact on CAGR Forecast | Geographic Relevance | Impact Timeline |
|---|---|---|---|
| Electric vehicle thermal-management coolant demand surge | +0.8% | Global, with early concentration in China, North America, EU | Medium term (2-4 years) |
| Mega-cracker capacity additions in Asia | +1.2% | Asia-Pacific core (China, South Korea, Saudi Arabia-Asia export corridors) | Short term (≤ 2 years) |
| Accelerating shift to bio-based MEG | +0.6% | North America, Europe, with pilot/commercial scale-up in Brazil, India | Long term (≥ 4 years) |
| AI-optimized demand-forecasting boosts inventory pull-through | +0.4% | Global, led by North America and Europe integrated producers | Medium term (2-4 years) |
| On-purpose rMEG from chemical recycling loops | +0.5% | Europe, North America, India (Loop-Ester JV), with policy-driven adoption | Long term (≥ 4 years) |
| Source: Mordor Intelligence | |||
Electric Vehicle Thermal-Management Coolant Demand Surge
Liquid-cooled battery packs, power electronics, and e-motors in BEVs generally require 50–60% ethylene-glycol–water mixtures for temperature regulation. Tesla’s 2026 Model Y manuals specify HTF-LS for North America, G48 for Europe, and LC100 for China, all within the 50–60% concentration range to ensure corrosion resistance and thermal efficiency[1]Tesla, “2026 Model Y Service Manual,” tesla.com. As 800-volt drivetrains become more common, vehicle-level glycol volumes are increasing, driving long-term growth in the ethylene glycol market. Chinese OEMs like BYD are already incorporating multiple glycol circuits per vehicle, while U.S. gigafactories are customizing coolant grades to prevent cross-contamination. While dielectric immersion coolants may find niche applications in high-performance vehicles, mainstream electrified fleets continue to rely on water-glycol mixtures, ensuring steady demand growth.
Mega-Cracker Capacity Additions in Asia
Six large ethylene complexes planned for start-up between late 2025 and 2027 in China and South Korea are expected to add over 3 million tons of new MEG nameplate capacity. Saudi Aramco and Sinopec’s 1.8-million-ton cracker at the YASREF refinery exemplifies the shift toward liquids-to-chemicals production, utilizing advantaged crude feedstocks for glycols and derivatives. Short-term oversupply may reduce Chinese operating rates by 1–2 percentage points, but integrated cost advantages allow coal-to-MEG producers to maintain throughput despite narrower margins. This additional capacity improves regional availability for downstream polyester exporters and helps stabilize raw material costs for fiber spinners.
Accelerating Shift to Bio-Based MEG
Brand-owner commitments to decarbonize polyester supply chains are driving demand for bio-MEG, supported by firm offtake agreements. Sustainea’s USD 400 million Lafayette, Indiana plant, co-located with a corn-dextrose supplier, is set to begin production in 2028 and represents the first of three planned facilities with a combined capacity of 700,000 tons per year of renewable MEG. The drop-in compatibility of bio-MEG allows existing PET production lines to switch feedstocks with minimal conversion barriers. Competing technologies, such as hardwood feedstocks and sugar-to-glycolaldehyde cracking, are advancing to pilot scale, with life-cycle analyses indicating up to 70% CO₂ reductions compared to naphtha-based MEG. However, feedstock price volatility remains a concern, though policy incentives under the U.S. Inflation Reduction Act improve the economic viability of biogenic carbon.
AI-Optimized Demand Forecasting Boosts Inventory Pull-Through
Dow’s use of machine-learning algorithms has reduced its global ethylene inventory by 15% while improving forecast accuracy, freeing up working capital across its ethylene glycol portfolio. These AI models analyze variables such as supplier lead times, feedstock costs, and downstream demand to optimize production and shipment schedules. Early adopters have reported improved service levels and fewer lost-sales incidents, strengthening customer relationships. As subscription-based platforms expand, automated replenishment is expected to reach mid-tier producers, driving a shift toward data-driven operational agility.
Restraints Impact Analysis of Ethylene Glycol Market*
| Restraint | (~) % Impact on CAGR Forecast | Geographic Relevance | Impact Timeline |
|---|---|---|---|
| EU REACH limits on DEG workplace exposure | -0.3% | Europe, with compliance spillover to multinational producers | Short term (≤ 2 years) |
| Virgin-PET demand erosion after 2028 recycling mandates | -0.7% | Europe, California, with gradual adoption in other OECD markets | Medium term (2-4 years) |
| Carbon-pricing shocks on coal-to-MEG projects | -0.5% | China (national ETS), with potential extension to India, ASEAN | Medium term (2-4 years) |
| Source: Mordor Intelligence | |||
EU REACH Limits on DEG Workplace Exposure
The Health Council of the Netherlands has recommended an 8-hour exposure limit of 70 mg/m³ for diethylene glycol (DEG), with a skin notation indicating dermal absorption risks[2].Health Council of the Netherlands, “Diethylene Glycol Health-Based OEL,” government.nl Variations in national limits, ranging from Denmark’s 11 mg/m³ to the UK’s 101 mg/m³, complicate compliance and increase costs for ventilation, monitoring, and personal protective equipment. As a result, downstream users, such as brake-fluid and solvent blenders, may shift toward propylene glycol or higher-purity MEG derivatives, potentially reducing DEG’s growth prospects within the ethylene glycol market.
Virgin-PET Demand Erosion After 2028 Recycling Mandates
European Union regulations require 30% recycled content in PET bottles by 2030, while California’s phased targets are driving earlier adoption of recycled PET (rPET). Coca-Cola’s 50% increase in rPET usage between 2020 and 2024 illustrates how brand commitments are translating into tangible resin substitution. However, the closure of multiple U.S. recyclers in 2025, due to price competition from low-cost Asian rPET imports, reflects the challenges facing the market. Overall, virgin PET demand in OECD markets is plateauing, reducing monoethylene glycol consumption in these regions.
*Our forecasts treat driver/restraint impacts as directional, not additive. The impact forecasts reflect baseline growth, mix effects, and variable interactions.
Ethylene Glycol Market Segment Analysis
By Product Type:
MEG Commands Bulk Volume While DEG Rides Brake-Fluid UpsideMonoethylene glycol captured 86.44% of 2025 shipments, anchored by polyester fiber and PET resin chains. The segment’s absolute volume rise keeps the ethylene glycol market size on a solid trajectory, even as MEG’s proportional share edges lower due to faster-growing specialties. Diethylene glycol is projected to grow at a 8.47% CAGR to 2031, energized by higher-spec brake fluids that rely on methyl diglycol and methyl triglycol, both manufactured via DEG intermediates. Triethylene glycol remains a stable niche tied to natural-gas dehydration; its fortunes mirror upstream drilling cycles.
Capacity investments echo these trends. BASF’s Zhanjiang methyl-glycols plant, starting late-2025, will channel DEG feed into modern brake-fluid grades for China’s expanding auto parc. Regulatory toxicity scrutiny, however, could constrain DEG, nudging formulators toward safer propylene glycol alternatives in food and pharma uses. As specialty blends claim a price premium, balanced portfolios help producers buffer swings in commodity MEG margins and sustain ethylene glycol market share leadership.


By Manufacturing Process:
Ethylene-Oxide Route Dominates, Bio-Based Route Scales FastThe ethylene-oxide process supplied 77.79% of the 2025 output, leveraging cracker integration and advantaged ethane in North America. Coal-to-MEG supplied much of China’s incremental volume over the last decade but now faces tightening carbon costs and lower run rates. Approximately 1.5 million tons of coal-based capacity is unlikely to restart, trimming future supply slack.
Bio-based route is the fastest-growing slice at a 9.23% CAGR to 2031. Sustainea’s Lafayette project exemplifies scalable, drop-in renewable MEG compatible with legacy PET assets, and UPM’s hardwood-based BioPura could deliver negative-carbon glycols mid-term. Demonstration units employing MOSAIK sugar-cracking chemistry are distributing samples to polyester brands evaluating full-cycle CO₂ metrics. As buyers embed Scope 3 targets into procurement, premiums for verified low-carbon glycols may cement bio-MEG as a mainstream supply tier within the ethylene glycol market.
By Application:
Polyester Fiber Holds the Crown, but PET AcceleratesPolyester fiber represented 46.57% of the 2025 demand. Fast-fashion growth in South Asia and sustained exports from China keep spinner utilization high, though recycled-content mandates begin to reshape feedstock mixes. Virgin PET resin for bottles grows more slowly, tempered by rPET adoption, yet emerging markets in Africa and ASEAN still lift absolute tonnage. Antifreeze and coolant formulations are the standout riser, as BEVs standardize high-glycol coolant circuits.
Industrial films, sheets, and coatings absorb steady volumes, but policy-driven circularity opens dual sourcing between virgin and chemically recycled MEG. Collective shifts in these downstream outlets ensure the ethylene glycol market size continues its balanced expansion even as legacy drivers mature.
By End-user Industry:
Textiles and Apparel Mature, Automotive Electrifies GrowthTextiles and apparel held 39.11% of offtake in 2025, reflecting polyester’s ubiquity in garments and home furnishings. Export-driven mills in China added 14.58 million tons of polyester product exports, up 13.5% year-over-year, underpinning regional MEG pull. Yet future upside tilts toward automotive.
Each BEV incorporates multiple glycol loops for battery, inverter, and motor cooling, pushing the automotive industry to the fastest 6.03% CAGR through 2031. Oil-and-gas dehydration, medical cryoprotectants, and construction materials form smaller but sticky demand pods that diversify producer revenue.
Geography Analysis
APAC Ethylene Glycol Market
Asia-Pacific accounted for 59.22% of the 2025 volume and is forecast to expand at a 5.78% CAGR to 2031. China’s near-self-sufficiency compresses imports, while 2026 start-ups add short-term pressure on margins. Saudi Arabia supplied over half of China’s MEG imports in 2024–2025, leveraging cost-advantaged liquids-to-chemicals complexes such as the YASREF expansion. India’s polyester uptick and Reliance Industries’ domestic price increases signal tightening balances in South Asia.
North America Ethylene Glycol Market
North America enjoys shale-gas cost leadership. Dow’s 100,000 tons per year ethylene supply boost to MEGlobal’s Oyster Creek unit and ExxonMobil–SABIC’s 1.1 million tons per year MEG line reinforce the region’s export posture. Sustainea’s bio-MEG plant introduces a renewable stream that aligns with U.S. corporate decarbonization agendas.
Europe Ethylene Glycol Market
Europe battles high energy costs; over 50 chemical sites either closed or curtailed between 2023 and mid-2025. INEOS’ Cologne shutdown of propylene glycol in October 2025 illustrates margin pressure, while EU circular-economy statutes nudge investment toward chemical recycling. Import-reliance for glycols is therefore inching upward.
South America and MEA Ethylene Glycol Market
South America and the Middle-East and Africa capture smaller share. Indorama Ventures’ 4,000 tons per year Lagos rPET plant, slated for 2027, underpins Africa’s first large-scale recycled-glycol value chain. Saudi Aramco’s USD 100 billion liquids-to-chemicals roadmap further entrenches Middle-East export heft, ensuring the ethylene glycol market retains globally balanced supply nodes.

Competitive Landscape
The top 5 producers, including SABIC, Dow, China Petrochemical Corporation, Reliance Industries, and Shell, deliver a moderately concentrated ethylene glycol market. SABIC’s 700,000 tons per year Jubail United expansion and the ExxonMobil-SABIC Gulf Coast joint venture illustrate scale benefits and integration into cracker feed. Dow’s AI-enabled supply-chain optimization, which trimmed ethylene inventory by 15%, signals a technology frontier likely to widen performance gaps.
Disruptors center on circular pathways. Loop Industries and Ester Industries aim for 23,000 tons per year of rMEG in India by 2027, while LanzaTech’s gas-fermentation platform pursues waste-gas-to-ethanol-to-MEG conversions, albeit still seeking commercial viability. Bio-route innovators such as Sustainea and UPM Biochemicals are locking in offtakes with apparel brands keen on verified low-carbon fibers. Concurrently, Japan’s cracker consolidation, Mizushima closure, and Osaka Petrochemical upgrade illustrate high-cost asset rationalization amid declining domestic demand.
Low-carbon process technology is emerging as a differentiator. Technip Energies’ modular cracker furnaces capable of 100% hydrogen firing, now in FEED for INEOS Antwerp, promise CO₂ footprints under half the current European top-decile benchmark, signaling future licensee interest for glycol feed integration.
Ethylene Glycol Industry Leaders
Dow
SABIC
Shell plc
China Petrochemical Corporation
Reliance Industries Limited
- *Disclaimer: Major Players sorted in no particular order
Ethylene Glycol Market Companies Covered in this Report
- BASF
- China Petrochemical Corporation
- Dow
- Equate Petrochemical Company
- Formosa Plastics Corporation, U.S.A.
- Indorama Ventures Public Company Limited
- INEOS
- LOTTE Chemical Corporation
- Mitsubishi Chemical Group Corporation
- PTT Global Chemical Public Company Limited
- Reliance Industries Limited
- SABIC
- Sasol
- Shell plc
- Technip Energies N.V.

Recent Industry Developments in Ethylene Glycol Market
- June 2024: Technip Energies and Shell Catalysts & Technologies signed a technology transfer agreement to expedite the commercialization of the Bio-2-Glycols technology, which enabled the production of bio-based Mono Ethylene Glycol (MEG) from glucose. This partnership integrated Shell's research and development capabilities with Technip Energies' expertise to support lower-carbon polyester production.
- May 2024: INEOS completed the acquisition of LyondellBasell's Ethylene Oxide and Derivatives business in Bayport, Texas, for USD 700 million. The acquisition included a 375 kt ethylene glycol plant, strengthening INEOS's position in the U.S. market and improving its cost-efficient production capabilities.


Global Ethylene Glycol Market Report Scope
Ethylene glycol is a colorless, odorless, sweet-tasting, and highly toxic viscous liquid primarily used as an automotive antifreeze, de-icing fluid, and as a raw material for PET plastics and polyester fibers. It functions by significantly lowering the freezing point and raising the boiling point of water-based solutions.
The Ethylene Glycol Market is segmented into product type, manufacturing process, application, end-user industry, and geography. By product type, the market is segmented into monoethylene glycol (MEG), diethylene glycol (DEG), and triethylene glycol (TEG). By manufacturing process, the market is segmented into ethylene-oxide route, coal-to-MEG (CTM), and bio-based route. By application, the market is segmented into polyester fiber, PET, antifreeze and coolant, industrial films and sheets, and other applications. By end-user industry, the market is segmented into textiles and apparel, automotive, oil and gas, plastics and packaging, medical and pharmaceutical, and other end-user industries. The report also covers the market size and forecasts for ethylene glycol in 16 countries across major regions. For each segment, the market sizing and forecasts have been done on the basis of volume (tons).
Segmentation Overview
| Monoethylene Glycol (MEG) |
| Diethylene Glycol (DEG) |
| Triethylene Glycol (TEG) |
| Ethylene-Oxide Route |
| Coal-to-MEG (CTM) |
| Bio-Based Route |
| Polyester Fibre |
| PET |
| Antifreeze and Coolant |
| Industrial Films and Sheets |
| Other Applications |
| Textiles and Apparel |
| Automotive |
| Oil and Gas |
| Plastics and Packaging |
| Medical and Pharmaceutical |
| Other End-user Industries |
| Asia-Pacific | China |
| India | |
| Japan | |
| South Korea | |
| ASEAN Countries | |
| Rest of Asia-Pacific | |
| North America | United States |
| Canada | |
| Mexico | |
| Europe | Germany |
| United Kingdom | |
| France | |
| Italy | |
| Russia | |
| Rest of Europe | |
| South America | Brazil |
| Argentina | |
| Rest of South America | |
| Middle-East and Africa | Saudi Arabia |
| South Africa | |
| Rest of Middle-East and Africa |
| By Product Type | Monoethylene Glycol (MEG) | |
| Diethylene Glycol (DEG) | ||
| Triethylene Glycol (TEG) | ||
| By Manufacturing Process | Ethylene-Oxide Route | |
| Coal-to-MEG (CTM) | ||
| Bio-Based Route | ||
| By Application | Polyester Fibre | |
| PET | ||
| Antifreeze and Coolant | ||
| Industrial Films and Sheets | ||
| Other Applications | ||
| By End-user Industry | Textiles and Apparel | |
| Automotive | ||
| Oil and Gas | ||
| Plastics and Packaging | ||
| Medical and Pharmaceutical | ||
| Other End-user Industries | ||
| By Geography | Asia-Pacific | China |
| India | ||
| Japan | ||
| South Korea | ||
| ASEAN Countries | ||
| Rest of Asia-Pacific | ||
| North America | United States | |
| Canada | ||
| Mexico | ||
| Europe | Germany | |
| United Kingdom | ||
| France | ||
| Italy | ||
| Russia | ||
| Rest of Europe | ||
| South America | Brazil | |
| Argentina | ||
| Rest of South America | ||
| Middle-East and Africa | Saudi Arabia | |
| South Africa | ||
| Rest of Middle-East and Africa | ||


Key Questions Answered in the Report
What is the size of the ethylene glycol market?
The ethylene glycol market stands at 44.54 million tons in 2026 and is forecast to reach 58.27 million tons by 2031, expanding at a 5.52% CAGR from 2026 to 2031.
Which application dominates ethylene glycol consumption in 2025?
Polyester fiber leads with 46.57% of 2025 demand owing to its widespread use in apparel and home textiles.
How are electric vehicles influencing ethylene glycol demand?
BEVs use 50–60% glycol-water coolants in battery and power-electronics loops, driving the automotive segment at a 6.03% CAGR to 2031.
What role will the bio-based route play through 2031?
Bio-based route is the fastest-growing manufacturing process segment at a 9.23% CAGR through 2031, fueled by projects like Sustainea’s 700,000 tons per year program that enables low-carbon polyester production.
Page last updated on:


