Ethylbenzene Market Size and Share
Market Overview
| Study Period | 2021 - 2031 |
|---|---|
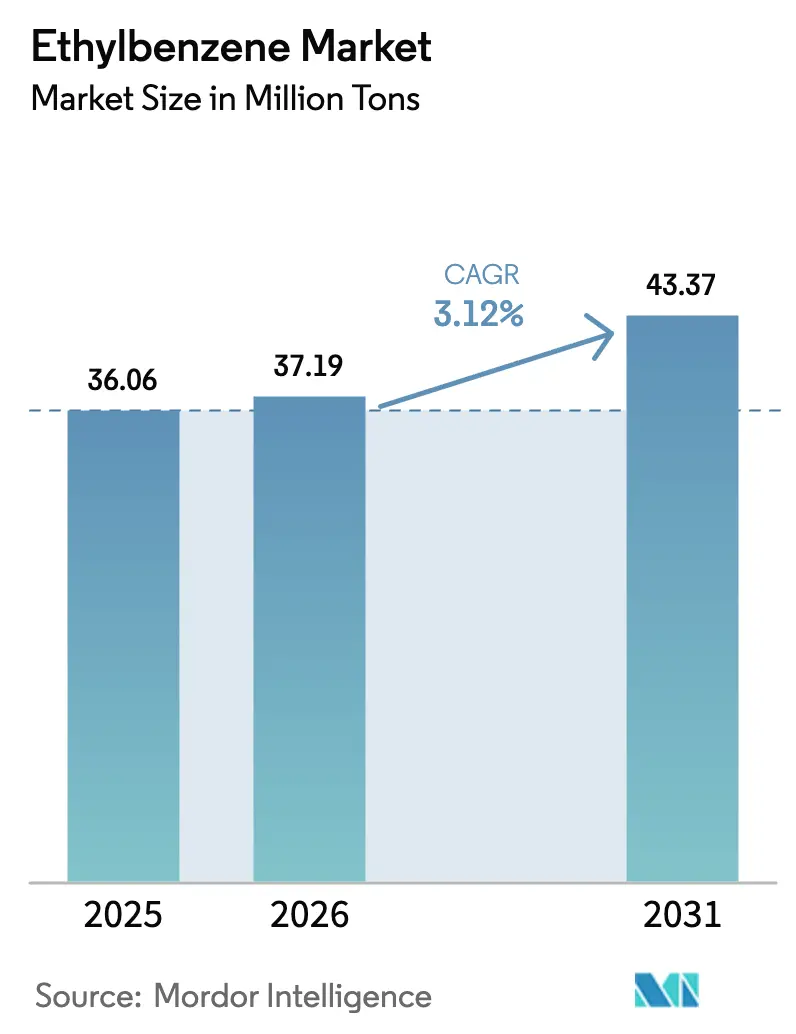
| Market Volume (2026) | 37.19 Million tons |
| Market Volume (2031) | 43.37 Million tons |
| Growth Rate (2026 - 2031) | 3.12% CAGR |
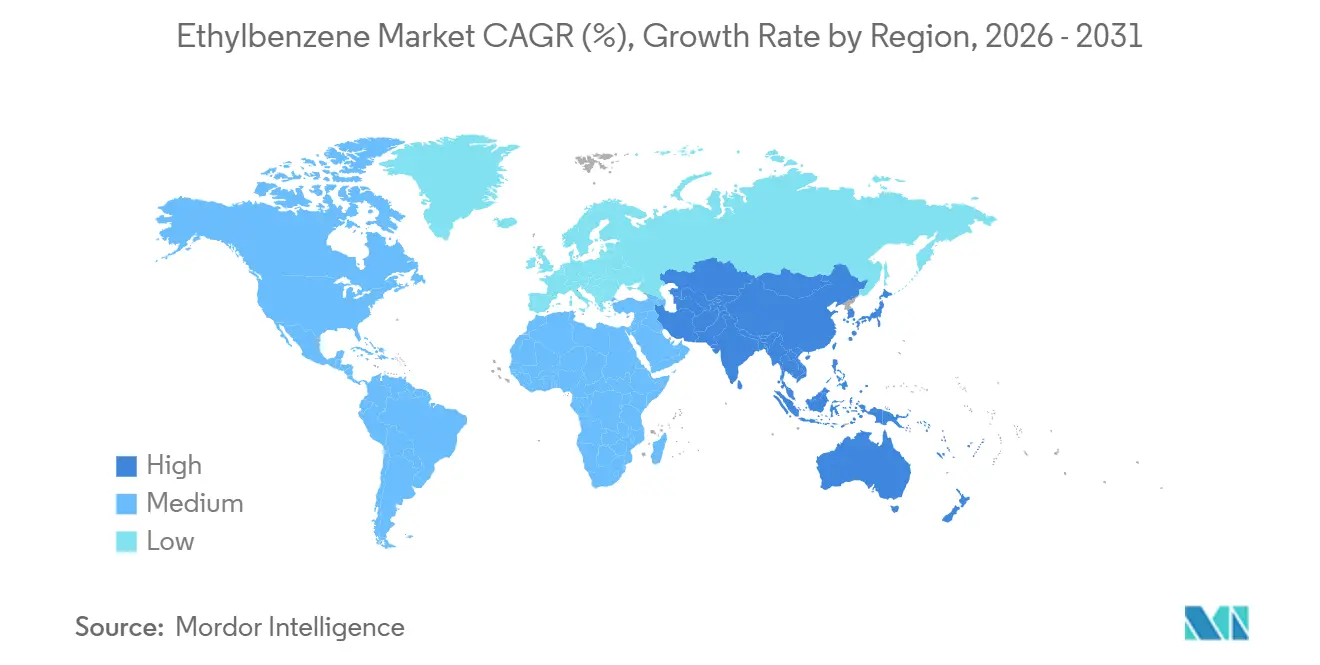
| Fastest Growing Market | Asia Pacific |
| Largest Market | Asia Pacific |
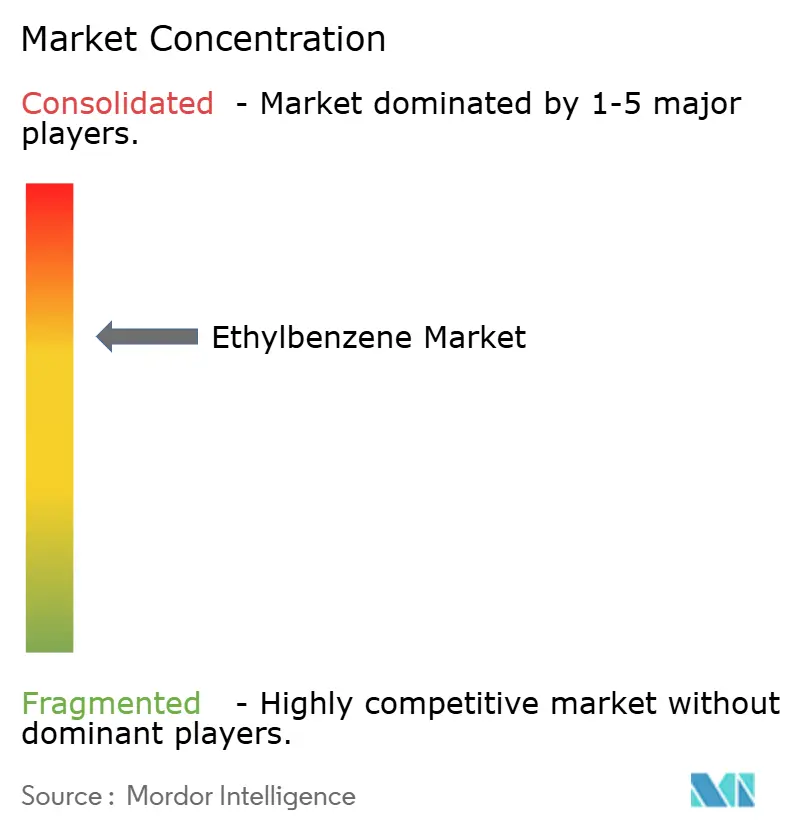
| Market Concentration | Medium |
Major Players *Disclaimer: Major Players sorted in no particular order Image © Mordor Intelligence. Reuse requires attribution under CC BY 4.0. | |
Ethylbenzene Market Analysis by Mordor Intelligence
The Ethylbenzene Market size is projected to be 36.06 million tons in 2025, 37.19 million tons in 2026, and reach 43.37 million tons by 2031, growing at a CAGR of 3.12% from 2026 to 2031. Robust capacity additions inside integrated refinery-petrochemical hubs across Asia-Pacific, especially in China and India, underpin this steady expansion even as legacy North American and European plants confront margin compression and mounting regulatory costs. Low-cost ethane and advantaged naphtha feedstocks enable large regional players to run crackers at competitive rates, crowding out high-cost standalone producers. The packaging sector’s appetite for polystyrene and ABS continues to pull incremental volumes while automotive lightweighting keeps ABS (Acrylonitrile Butadiene Styrene) and SBR (Styrene-Butadiene Rubber) demand resilient. Persistent volatility in benzene and crude oil prices, however, forces producers to optimize operating rates tightly, and tightening VOC (Volatile Organic Compound) emission norms in the United States and Europe are inflating compliance spending by 10-15% on average.
Key Report Takeaways
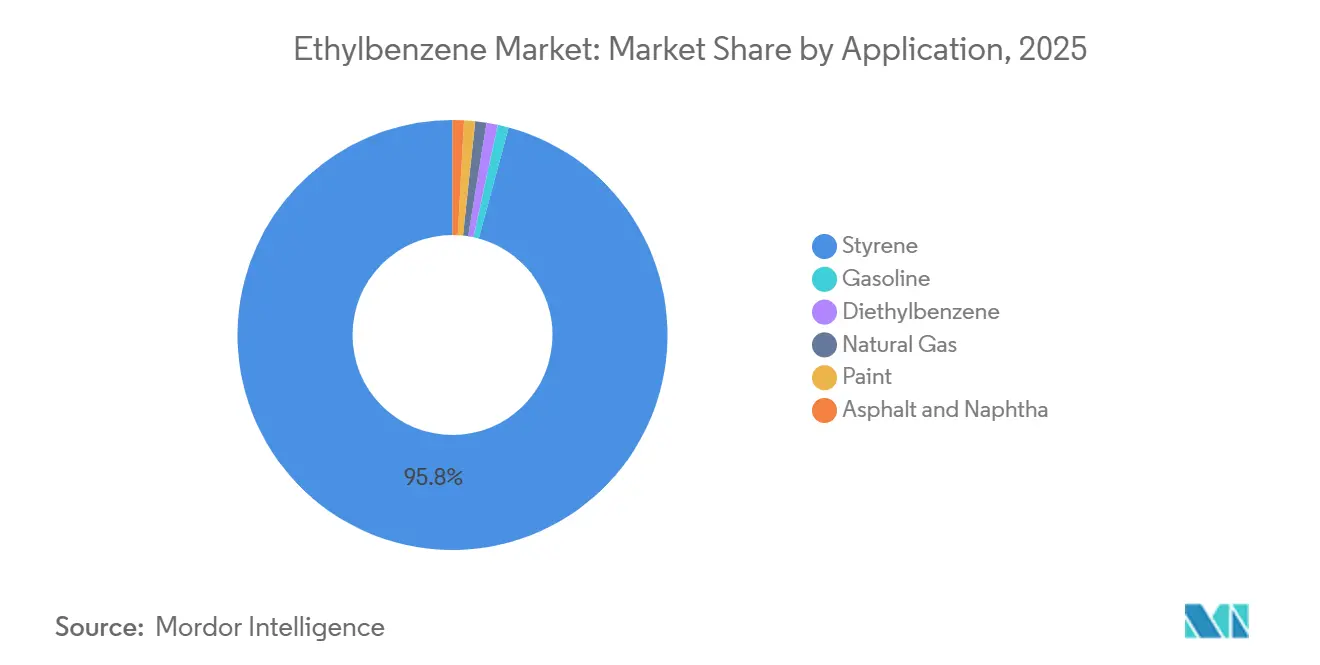
- By application, styrene had the largest share of 95.78% in 2025, and this share is expected to increase with a CAGR of 3.15% during the forecast period (2026-2031).
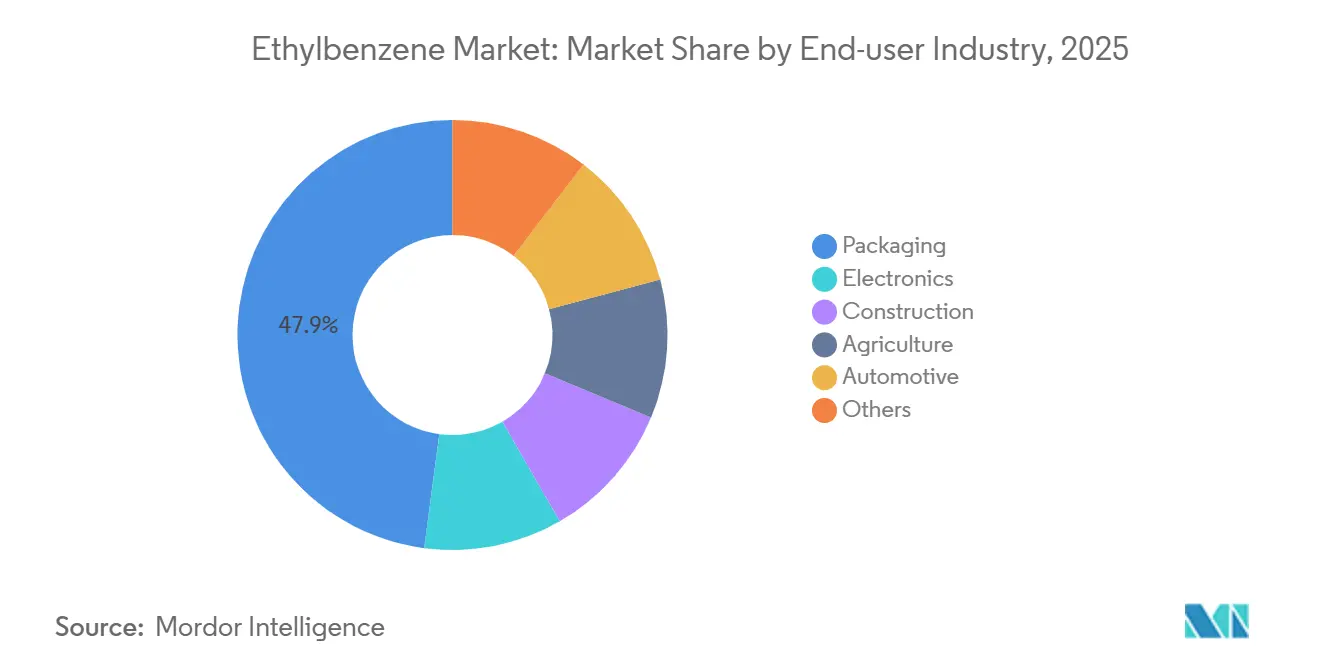
- By End-user Industry, packaging had a share of 47.90% in 2025, and this share is expected to increase with a CAGR of 3.63% during the forecast period (2026-2031).
- By Geography, the Asia Pacific had a share of 57.03% in 2025, and the region's share is expected to increase with a CAGR of 3.65% during the forecast period (2026-2031).
Note: Market size and forecast figures in this report are generated using Mordor Intelligence’s proprietary estimation framework, updated with the latest available data and insights as of January 2026.
Global Ethylbenzene Market Trends and Insights
Drivers Impact Analysis*
| Driver | (~) % Impact on CAGR Forecast | Geographic Relevance | Impact Timeline |
|---|---|---|---|
| Surging demand for styrene-based ABS and SBR materials | +1.2% | Global, with concentration in Asia-Pacific (China, India) and North America | Medium term (2-4 years) |
| Rising consumption in gasoline blending (octane improver) | +0.3% | North America, Europe, select Middle East markets | Short term (≤ 2 years) |
| Capacity additions in Asia's on-purpose ethylbenzene plants | +1.0% | Asia-Pacific core (China, India, Thailand), spill-over to Middle East | Medium term (2-4 years) |
| Rebound of construction sector fuelling UPR resins demand | +0.4% | Asia-Pacific, Middle East, selective North America infrastructure corridors | Medium term (2-4 years) |
| Adoption of bio-ethylene routes for low-carbon ethylbenzene | +0.2% | Europe, North America (pilot/early commercial scale) | Long term (≥ 4 years) |
| Source: Mordor Intelligence | |||


Surging Demand for Styrene-Based ABS and SBR Materials
Automotive lightweighting and electric-vehicle parts are lifting ABS off-take, and China alone is adding more than 2.1 million tons per year of ABS capacity within two years despite utilization rates near 55%[1]Z. Chen et al., “Automotive Growth Spurs ABS Capacity,” Sina Finance, sina.com.cn. Packaging needs for polystyrene and ABS grew through 2025 as e-commerce pushed demand for impact-resistant, lightweight boxes and trays, although Chinese export competition crimped converter margins in North America and Europe. SBR demand tied to replacement tires remained firm, supported by sustained vehicle miles traveled. Global benzene consumption exceeded 25 million tons in 2025, and roughly 48% of that volume entered the ethylbenzene route, underscoring the derivative’s anchor role in the broader aromatics chain. Profitability is drifting toward fully integrated players that own both benzene and ethylene streams, leaving standalone styrene makers vulnerable to shutdowns, as seen in multiple West European closures.
Rising Consumption in Gasoline Blending (Octane Improver)
Ethylbenzene delivers a high research octane number, helping refiners hit specifications when benzene is cost-competitive versus reformate. The U.S. EPA caps average benzene in finished gasoline at 0.62 vol% under 40 CFR Part 1090, indirectly limiting ethylbenzene inclusion when benzene feedstock prices spike[2]“Benzene Waste Operations NESHAP,” U.S. Environmental Protection Agency, epa.gov . ASTM D5580 analysis allows blenders to track ethylbenzene precisely and toggle aromatic composition in real time. North American demand dips during the winter months when butane and high-RVP blendstocks re-enter the pool, yet late-2025 consumption held because aromatics offset low-octane light naphtha in export cargoes. When benzene trades above reformate, refiners switch to toluene or xylene, capping ethylbenzene pull.
Capacity Additions in Asia’s On-Purpose Ethylbenzene Plants
China will bring 9.11 million tons per year of fresh ethylene nameplate in 2026, anchored by BASF Zhanjiang, Fujian Zhongsha Gulei, and Saudi Aramco joint ventures, each embedding downstream ethylbenzene assets. India’s BPCL is constructing a USD 6 billion cracker at Bina, targeting 1.2 million tons per year of ethylene by May 2028 to back-integrate into styrene and polymers. Russia’s SIBUR switched on a 350,000 tons per year ethylbenzene unit in January 2025, routing product eastward after Sinopec bought an 8.5% stake. Thailand’s PTT GC raised ethane feedstock volumes to 1.9 million tons in 2026 and plans U.S. ethane imports to lock in long-term cost advantages. These investments cluster new capacity in low-cost regions, squeezing high-cost European and North Asian plants.
Rebound of Construction Sector Fuelling UPR Resins Demand
Unsaturated polyester resin (UPR) demand turned soft in 2025. North America dropped 5-8% year over year, while Europe slipped 10%, yet Asian and Middle Eastern infrastructure pipelines signal a gradual recovery. Chinese producers operated UPR plants at 29-37% in Q4 2025, exporting surplus to capture margin abroad. Falling styrene feedstock prices, on the back of oversupply and high port stocks, reduced resin input costs, but downstream converters wrestled with thin spreads. Infrastructure outlays for wind blades, water pipelines, and building retrofits across India, Indonesia, and Saudi Arabia are poised to lift UPR volumes into 2027.
Restraints Impact Analysis*
| Restraint | (~) % Impact on CAGR Forecast | Geographic Relevance | Impact Timeline |
|---|---|---|---|
| Stringent VOC and benzene-derivative emission norms | -0.6% | Global, with acute pressure in North America, Europe, and select Asia-Pacific jurisdictions | Medium term (2-4 years) |
| Price volatility of crude-derived feedstocks | -0.5% | Global, with highest exposure in naphtha-dependent Europe and Northeast Asia | Short term (≤ 2 years) |
| Shrinking mixed-xylene pool as refiners upgrade gasoline | -0.3% | North America, Europe, select Asia-Pacific markets | Medium term (2-4 years) |
| Source: Mordor Intelligence | |||
Stringent VOC and Benzene-Derivative Emission Norms
OSHA proposed revisions to the Benzene standard in July 2025, aiming to modernize respirator language without relaxing exposure limits; public comments close in November 2025. EPA, meanwhile, enforces benzene fenceline monitoring under NESHAP Subpart FF, imposing multimillion-dollar penalties and mandating corrective plans when readings breach action levels. A 2024 settlement cost one U.S. refinery USD 19 million plus USD 150 million in control equipment, eliminating 219 tons per year of VOCs. In South Korea, ethylbenzene ranked among the top four VOCs identified for priority control at synthetic resin sites, intensifying scrutiny. These rules accelerate closures of older European crackers and incentivize closed-loop recovery, but they add capital strain to already thin margins in net-import regions.
Price Volatility of Crude-Derived Feedstocks
Benzene swung between USD 650/ton and USD 1,005/ton in Q4 2025, tracking crude that moved from USD 66 bbl to USD 75 bbl early in the year. Russia-Middle East tensions in March 2026 choked Strait of Hormuz traffic, spurring force majeure at several Asian crackers and lifting benzene spot premiums. European and Korean naphtha-based producers faced cash-cost penalties of USD 300-500/ton of ethylene versus U.S. ethane crackers, driving shutdowns like ExxonMobil’s Gravenchon unit in April 2024. Spot exposure rises when derivative spreads narrow, compressing ethylbenzene-styrene margins and prompting run-rate cuts.
*Our forecasts treat driver/restraint impacts as directional, not additive. The impact forecasts reflect baseline growth, mix effects, and variable interactions.
Segment Analysis
By Application: Styrene Dominance Anchors Feedstock Demand
Styrene held 95.78% share of the Ethylbenzene market in 2025 and will advance at 3.15% CAGR through 2031, fueled by downstream polystyrene, ABS, and SBR consumption. China’s styrene nameplate growth is amplifying regional surpluses and compressing spreads. Japan’s consolidation of Chiba crackers will shutter a significant volume of ethylene by 2027, trimming ethylbenzene demand domestically. Gasoline blending, diethylbenzene, and specialty solvent outlets remain niche, absorbing less than 2 % combined. Tight benzene-styrene spreads in Europe Q3 2024 pushed several standalone units toward breakeven, reinforcing the strategic shift to integrated refinery-cracker complexes.
Second-order effects underline catalyst preference: the Badger EBMax zeolite route now produces over half of global volumes because its 2.5-4.0 benzene-to-ethylene ratio cuts recycle and energy cost. Sustainability considerations push producers to trial bio-ethylene streams, but limited tonnage delays commercial impact before 2030.


By End-User Industry: Packaging Leads Growth Trajectory
Packaging consumed 47.90% of 2025 demand and is tracking a 3.63% CAGR through 2031, adding nearly 3.5 million tons of incremental pull on the Ethylbenzene market. E-commerce shipments and consumer durables favor polystyrene and ABS for strength-to-weight economics, while food-contact regulations spur adoption of high-purity styrenics. Automotive lines, although moderating in North America and Europe, rely on ABS for instrument panels and SBR for tires; EV platforms further accentuate lightweight plastics usage. Construction is still cyclical: muted housing permits in OECD economies depress UPR resins, but Middle Eastern infrastructure drives localized upticks. Electronics stay stable, capturing demand for appliance housings and insulation. Agricultural applications hold a marginal share yet benefit from specialty coatings initiatives.
Geographically, Asia-Pacific converters dominate packaging growth, leveraging scale and government incentives. North American processors face a margin squeeze from cheap Chinese exports despite feedstock advantages. Recyclability advances, mechanical and advanced recycling initiatives should lift polystyrene acceptance, but virgin demand remains the bulk driver through 2031.
Geography Analysis
Asia-Pacific commanded 57.03% of the 2025 volume and is on course for a 3.65% CAGR to 2031, keeping the region at the center of the Ethylbenzene market. Massive ethylene expansions, such as BASF Zhanjiang and Fujian Zhongsha Gulei, embed integrated styrene chains, ensuring benzene and ethylbenzene self-sufficiency. India’s BPCL Bina and Nayara Energy’s Vadinar ethane cracker, valued at USD 8 billion, aim to cut the country’s 45% petrochemicals import bill and create domestic ethylbenzene supply security. Southeast Asian players like PTT GC boost competitiveness by importing U.S. ethane and avoiding major turnarounds through 2026, sustaining steady exports.
North America leverages shale-based ethane to enjoy the world’s lowest cash costs, but structural gasoline demand decline caps reformate-derived benzene growth. Westlake’s 260,000 tons per year Lake Charles styrene shutdown in December 2025 illustrates how even feedstock-advantaged producers exit when global oversupply erodes spreads. Dow, ExxonMobil, and Chevron Phillips nevertheless added incremental capacity in January 2026, betting on cyclical recovery and export arbitrage. Long-term ethylbenzene market share in the region is expected to stay around 18-20% as supply tightens elsewhere.
Europe is the weak link, battered by high energy costs and EU ETS exposure. Versalis, ExxonMobil, SABIC, and INEOS retired more than 200,000 tons per year of combined cracker capacity between 2024-2025. Carbon border taxes and pricey LNG undermine naphtha margins, propelling an accelerated switch to specialty or circular routes. Middle East complexes stay profitable on low-cost ethane; Tasnee’s financed expansion will add 3.3 million tons per year of products by Q4 2030, channeling surplus styrene into Asian markets. Africa and South America remain small but strategic: Egypt’s 300,000 tons per year styrene project in Alexandria fills a regional deficit by 2030, and Brazil’s long-term Braskem-Petrobras feedstock pact boosts ethane share, supporting incremental ethylbenzene demand.

Competitive Landscape
The Ethylbenzene Market is moderately consolidated. Competitive pressure forces standalone European and Korean styrene producers to repurpose plants into acrylics, ABS compounds, or close altogether. Consolidation signs include Idemitsu-Mitsui’s joint cracker operation in Chiba by 2027. Meanwhile, sustainability drives capital toward bio-ethylene ventures: Dow’s Path2Zero project aims to decarbonize 20% of its global ethylene volume by 2030, providing low-carbon barrels that can qualify for green premium contracts along the styrenics chain.
Ethylbenzene Industry Leaders
INEOS
LyondellBasell Industries Holdings B.V.
Chevron Phillips Chemical Company LLC
Westlake Corporation
SIBUR Holding PJSC
- *Disclaimer: Major Players sorted in no particular order

Recent Industry Developments
- March 2026: Kuwait Styrene Company (TKSC), a producer of styrene monomer (SM), invoked force majeure (FM) at its ethylbenzene-styrene monomer (EBSM) plant in Al Ahmadi, Kuwait.
- April 2025: Clariant announced the launch of StyroMax UL-100, an ethylbenzene dehydrogenation catalyst, engineered to facilitate ultra-low steam-to-oil operations in styrene plants for drop-in refills into existing units.


Global Ethylbenzene Market Report Scope
Ethylbenzene is a clear, flammable liquid with an odor similar to gasoline. It is commercially manufactured by a catalyzed reaction of ethylene and benzene at approx 40 bar and temperatures around 250°C. Ethylbenzene is exclusively used as a raw material to produce styrene monomers. It finds its major application in the construction, packaging, and electronics industries.
The ethylbenzene market is segmented by application, end-user industry, and geography. By application, the market is segmented into styrene, gasoline, diethylbenzene, natural gas, paint, asphalt, and naphtha. By end-user industry, the market is segmented into packaging, electronics, construction, agriculture, automotive, and other end-use industries. The report also covers the market size and forecasts for the ethylbenzene market in 17 countries across major regions. For each segment, the market sizing and forecasts have been done on the basis of volume (tons).
| Styrene | Polystyrene |
| Acrylonitrile-Butadiene-Styrene | |
| Styrene-Acrylonitrile Resins | |
| Styrene-Butadiene Elastomers and Latex | |
| Unsaturated Polyester Resins | |
| Gasoline | |
| Diethylbenzene | |
| Natural Gas | |
| Paint | |
| Asphalt and Naphtha |
| Packaging |
| Electronics |
| Construction |
| Agriculture |
| Automotive |
| Others |
| Asia-Pacific | China |
| India | |
| Japan | |
| South Korea | |
| ASEAN Countries | |
| Rest of Asia-Pacific | |
| North America | United States |
| Canada | |
| Mexico | |
| Europe | Germany |
| United Kingdom | |
| Italy | |
| France | |
| Spain | |
| Russia | |
| NORDIC Countries | |
| Rest of Europe | |
| South America | Brazil |
| Argentina | |
| Rest of South America | |
| Middle-East and Africa | Saudi Arabia |
| South Africa | |
| Rest of Middle-East and Africa |
| By Application | Styrene | Polystyrene |
| Acrylonitrile-Butadiene-Styrene | ||
| Styrene-Acrylonitrile Resins | ||
| Styrene-Butadiene Elastomers and Latex | ||
| Unsaturated Polyester Resins | ||
| Gasoline | ||
| Diethylbenzene | ||
| Natural Gas | ||
| Paint | ||
| Asphalt and Naphtha | ||
| By End-user Industry | Packaging | |
| Electronics | ||
| Construction | ||
| Agriculture | ||
| Automotive | ||
| Others | ||
| By Geography | Asia-Pacific | China |
| India | ||
| Japan | ||
| South Korea | ||
| ASEAN Countries | ||
| Rest of Asia-Pacific | ||
| North America | United States | |
| Canada | ||
| Mexico | ||
| Europe | Germany | |
| United Kingdom | ||
| Italy | ||
| France | ||
| Spain | ||
| Russia | ||
| NORDIC Countries | ||
| Rest of Europe | ||
| South America | Brazil | |
| Argentina | ||
| Rest of South America | ||
| Middle-East and Africa | Saudi Arabia | |
| South Africa | ||
| Rest of Middle-East and Africa | ||


Key Questions Answered in the Report
How large will global ethylbenzene demand be by 2031?
Consumption is forecast to hit 43.37 million tons in 2031, up from 37.19 million tons in 2026, underpinned by a 3.12% CAGR.
What drives the strongest end-use growth for ethylbenzene derivatives?
Packaging, especially polystyrene and ABS used in e-commerce and food applications, grows at 3.63% CAGR through 2031.
How do VOC regulations affect producers?
Stricter benzene and VOC limits in the U.S. and Europe raise compliance costs by about 10-15%, accelerating plant closures in high-cost regions.
Are bio-based routes a near-term supply option?
Pilot projects show promise, but commercial bio-ethylene will not materially affect feedstock balances until after 2029.
Page last updated on:


