
Chemicals & Materials
2nd JuneUnlocking Supplier Partnerships in the Africa Lubricants Market
5 Min Read
The Ethyl Alcohol (Ethanol) Market Report is Segmented by Grade (Fuel Grade, Industrial Grade, Food Grade, and More), End-User Industry (Automotive and Transportation, Food and Beverage, Pharmaceuticals, Cosmetics and Personal Care, and Other End-User Industries), and Geography (Asia-Pacific, North America, Europe, South America, and Middle-East and Africa). The Market Forecasts are Provided in Terms of Volume (Liters).
Market Overview
| Study Period | 2021 - 2031 |
|---|---|
| Market Volume (2026) | 113.98 Billion liters |
| Market Volume (2031) | 148.40 Billion liters |
| CAGR | 5.42 % |
| Fastest Growing Market | Asia-Pacific |
| Largest Market | North America |
| Market Concentration | Low |
Major Players *Disclaimer: Major Players sorted in no particular order. Image © Mordor Intelligence. Reuse requires attribution under CC BY 4.0. |
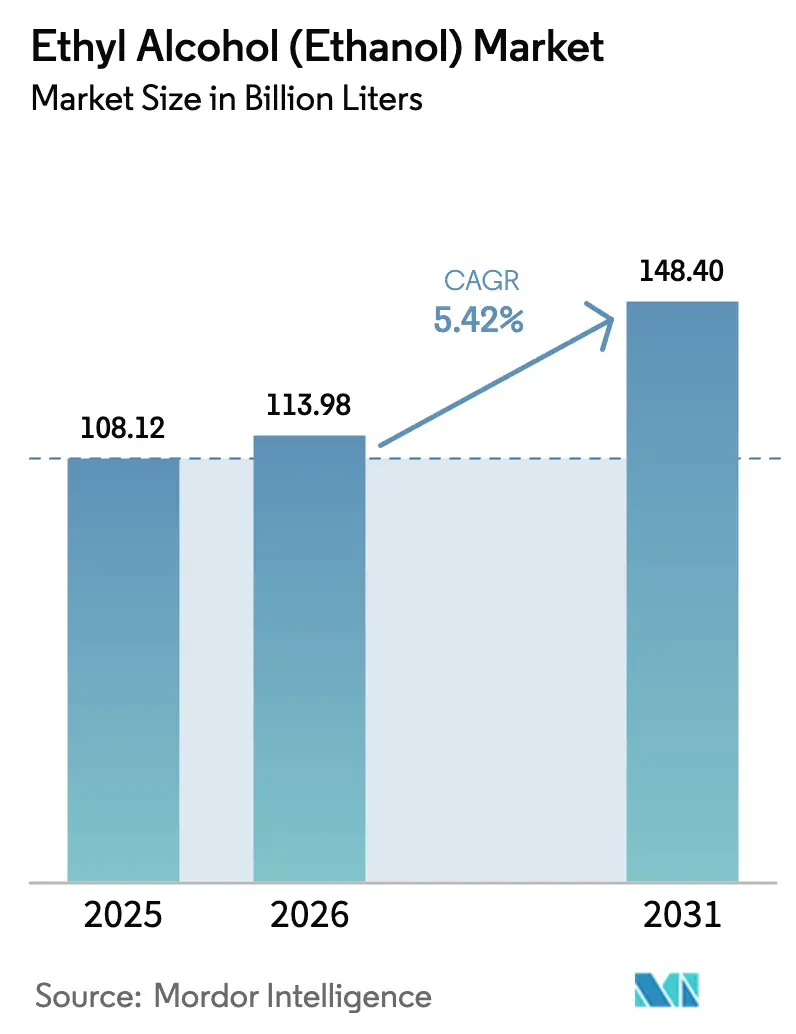
The Ethyl Alcohol Market size was valued at 108.12 billion liters in 2025 and is estimated to grow from 113.98 billion liters in 2026 to reach 148.40 billion liters by 2031, at a CAGR of 5.42% during the forecast period (2026-2031). Carbon-credit stacking is gaining traction, ethanol-to-jet pathways are accelerating, and there is a surging demand for pharmaceutical-grade products. These shifts are redefining value creation, moving beyond the traditional focus on fuel blending. Carbon capture and sequestration (CCS) is gaining prominence, leveraging the gap between the U.S. Inflation Reduction Act’s 45Q credit and average capture costs. Consequently, older Midwest plants have evolved into profitable low-carbon hubs. Sustainable aviation fuel (SAF) is securing offtake agreements, absorbing volumes that road transport may soon relinquish, particularly due to the rise of electric vehicles (EVs). Concurrently, luxury personal-care brands are adopting carbon-captured ethanol to mitigate their Scope 3 emissions. By 2025, North America is expected to dominate supply; however, the Asia-Pacific region is witnessing the fastest growth, driven by rising blending rates in India and China's provincial E10 mandates. The competitive landscape is intensifying, with industry leaders such as POET, Raízen, and COFCO strategically aligning with CCS pipelines, CBIO premiums, and SAF contracts.
Key Report Takeaways
Note: Market size and forecast figures in this report are generated using Mordor Intelligence's proprietary estimation framework, updated with the latest available data and insights as of January 2026.
Drivers Impact Analysis
| Driver | (~) % Impact on CAGR Forecast | Geographic Relevance | Impact Timeline | |||
|---|---|---|---|---|---|---|
Cost competitiveness versus gasoline
Cost competitiveness versus gasoline
| +1.20% | Brazil, North America, India | Medium term (2-4 years) |
(~) % Impact on CAGR Forecast
:
+1.20%
|
Geographic Relevance
:
Brazil, North America, India
|
Impact Timeline
:
Medium term (2-4 years)
|
Growing flex-fuel and hybrid vehicle fleet
Growing flex-fuel and hybrid vehicle fleet
| +0.90% | Brazil, North America, ASEAN | Medium term (2-4 years) | |||
Ethanol-to-jet pathway momentum in SAF chains
Ethanol-to-jet pathway momentum in SAF chains
| +1.10% | North America, Europe, ASEAN | Long term (≥ 4 years) | |||
CCUS integration enabling carbon credits
CCUS integration enabling carbon credits
| +1.40% | North America, early pilots in Brazil | Long term (≥ 4 years) | |||
Biogenic CO₂ for e-methanol and syn-fuels
Biogenic CO₂ for e-methanol and syn-fuels
| +0.70% | Europe, North America | Long term (≥ 4 years) | |||
| Source: Mordor Intelligence | ||||||
Cost Competitiveness Versus Gasoline
In early 2025, Brazilian hydrous ethanol traded below the threshold that typically drives drivers to switch fuels, thus maintaining domestic demand. In late 2025, U.S. wholesale E85 was cheaper than regular gasoline on an energy-adjusted basis, despite the concentration of pumps in the Midwest. India set its C-heavy molasses ethanol procurement price lower than gasoline, aiding oil-marketing companies in achieving the blend target without resorting to direct subsidies[1]Ministry of Petroleum and Natural Gas India, “Ethanol Blending Status,” mopng.gov.in . In early 2026, corn prices decreased, alleviating U.S. feedstock costs but tightening margins for less-efficient plants. Concurrently, Brazilian mills boosted cane yields, reducing production costs and enhancing export opportunities in California’s Low Carbon Fuel Standard market, where credits were high.
Growing Flex-Fuel and Hybrid Vehicle Fleet
By 2022, the United States had a significant number of flex-fuel vehicles. However, only a small fraction of retail stations offered E85, leading to a low utilization rate. In Brazil, where most of the light-vehicle fleet is flex-fuel, ethanol outsold gasoline for several months in 2025 when price parity favored the biofuel. Thailand's gasohol demand increased in 2025, with E20 rapidly capturing market share, thanks to subsidies countering energy-density drawbacks. Japanese and South Korean automakers are testing ethanol-compatible hybrid powertrains as a hedge against battery supply risks and are awaiting regulatory approval for higher blends. The Philippines announced a nationwide E10 policy in late 2025, increasing reliance on Thai cassava-ethanol imports and bolstering intra-ASEAN trade.
Ethanol-to-Jet Pathway Momentum in SAF Supply Chains
LanzaJet’s Freedom Pines plant in Georgia produced sustainable aviation fuel in 2025, thanks to multiyear offtake agreements with major airlines. IATA forecasts SAF demand to increase significantly by 2030. Retrofitting existing ethanol plants for alcohol-to-jet configurations costs less than greenfield Fischer-Tropsch routes. The United Kingdom’s Project Speedbird aims for a significant scale by 2027, contributing to the SAF mandate set for 2030. Gevo’s Net-Zero 1 in South Dakota is set to deliver low-CI alcohol-to-jet fuel starting in 2027. The United States Department of Energy’s SAF Grand Challenge allocated a substantial portion of its loan guarantees in 2025 to ethanol-to-jet projects, underscoring the pathway's scalability.
CCUS Integration Enhancing Plant Economics Via Carbon-Credit Stacking
The 45Q credit offers value for each metric ton of CO₂ that is permanently stored. Given that fermentation exhaust streams achieve high purity, this could equate to potential value before accounting for capture costs. Summit Carbon Solutions’ Midwest Carbon Express is set to transport CO₂ annually from multiple plants to saline formations in North Dakota, with a targeted start-up in late 2026. After facing earlier challenges, Navigator CO₂ Ventures has re-filed a streamlined version of the Heartland Greenway in Iowa and Illinois, now concentrating on plants within a specific radius of existing easements. With average capture costs, this leaves a substantial margin over the credit. The newly introduced 45Z clean-fuel credit, effective from 2025, provides an additional value for every gram of CO₂e/MJ that is below a baseline. Given that CCS-equipped ethanol has low lifecycle intensities, this translates to a significant uplift per gallon.
Restraints Impact Analysis
| Restraint | (~) % Impact on CAGR Forecast | Geographic Relevance | Impact Timeline | |||
|---|---|---|---|---|---|---|
EV adoption curbing liquid-fuel demand
EV adoption curbing liquid-fuel demand
| -0.80% | North America, Europe, China | Medium term (2-4 years) |
(~) % Impact on CAGR Forecast
:
-0.80%
|
Geographic Relevance
:
North America, Europe, China
|
Impact Timeline
:
Medium term (2-4 years)
|
Water-use footprint tightening plant permits
Water-use footprint tightening plant permits
| -0.40% | U.S. Midwest, India Maharashtra | Short term (≤ 2 years) | |||
Land-use change controversies and ESG backlash
Land-use change controversies and ESG backlash
| -0.30% | Global focus on Brazil and Indonesia | Long term (≥ 4 years) | |||
| Source: Mordor Intelligence | ||||||
EV Adoption Curbing Liquid-Fuel Demand
In 2024, U.S. electric vehicle (EV) sales increased significantly, capturing a substantial share of the light-duty vehicle market. California mandated that a considerable portion of sales transition to zero-emission vehicles by 2026, aiming to reduce gasoline consumption annually by 2030. Meanwhile, in China, 2025 witnessed a significant rise in sales of battery-electric and plug-in hybrid vehicles, which accounted for a substantial share of the passenger-car market. Regulators in China predict that gasoline demand will peak in the near future. The International Energy Agency (IEA) forecasts that by 2030, a substantial number of EVs will be operational globally, displacing a significant volume of gasoline, equivalent to a large amount of ethanol at a blended rate. Norway's 2025 ban on internal combustion engines has already resulted in a reduction in annual ethanol demand. In response, producers are shifting their focus to sustainable aviation fuel (SAF), industrial solvents, and high-purity applications. However, these new outlets currently account for only a small portion of the existing volume, highlighting a potential structural surplus risk.
Water-Use Footprint Scrutiny Tightening Plant Permitting
Modern ethanol plants in the United States typically consume a significant amount of water for every gallon of ethanol produced. However, with drought conditions affecting several states, water withdrawals are now being capped. In 2025, Nebraska imposed restricted permits on several facilities, mandating costly zero-liquid-discharge retrofits. India's National Green Tribunal mandated comprehensive environmental impact assessments for new distilleries in water-scarce regions[2]. This decision has postponed multiple projects, which collectively would have produced a substantial volume annually. POET's Bingham Lake facility successfully reduced its water usage. Furthermore, more sites in the United States are set to implement this technology by 2027. In São Paulo, a new regulation mandates a high percentage of water recycling by 2026. This requirement is projected to increase regional costs slightly.
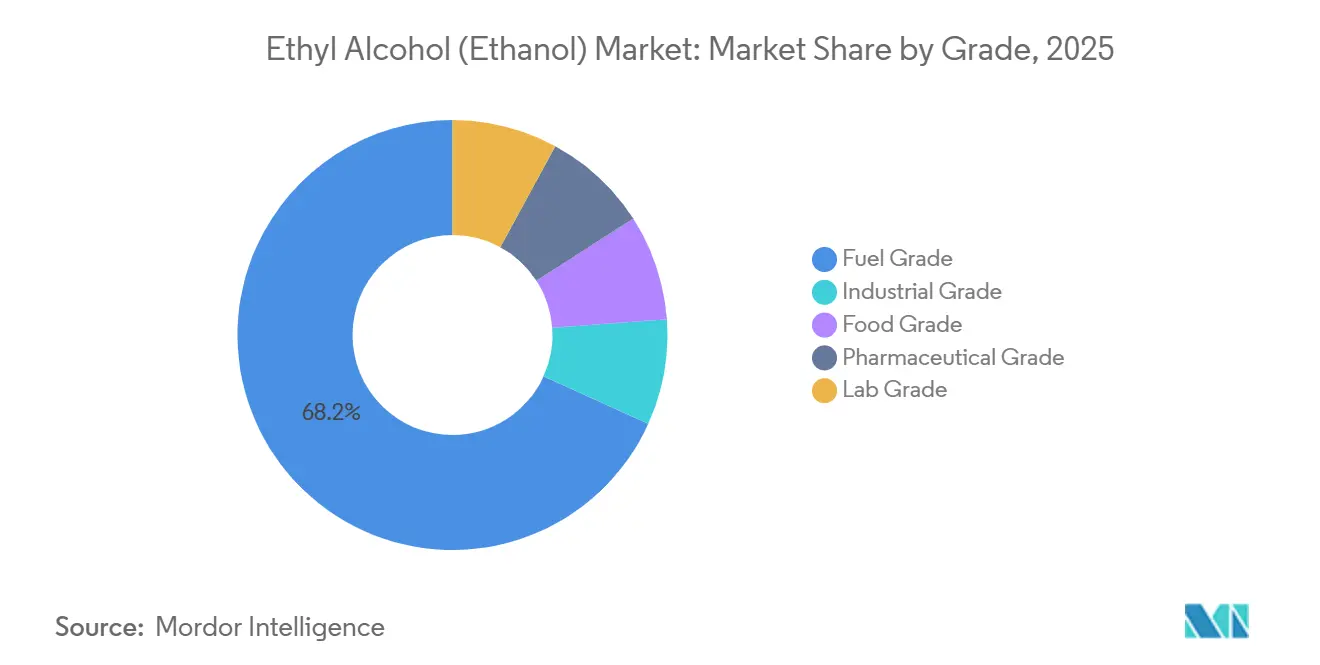
By Grade: Pharmaceutical Purity Commands Premium as Sanitizer Demand Persists
Pharmaceutical-grade ethanol is projected to grow at a 6.12% CAGR during the forecast period of 2026-2031, outpacing the broader Ethyl Alcohol Market. This growth is largely attributed to heightened specifications, particularly those related to vaccines and the push for benzene-free products. While fuel-grade ethanol accounted for 68.22% of the 2025 volume, its growth is expected to slow due to the rising adoption of electric vehicles (EVs). Industrial-grade ethanol, is benefiting from the Asia-Pacific construction sector's demand for ethyl acetate. Food-grade ethanol, with its notable market presence, enjoys a premium price tag due to its non-GMO traceability. Lab-grade ethanol, though a niche segment, is experiencing growth, fueled by steady biotech research and development investments in the United States and Europe.
The market for pharmaceutical-grade ethyl alcohol is poised for a significant upswing by 2031, while fuel-grade volumes are set to grow at a more moderate rate. Premium producers are capitalizing on United States Pharmacopeia standards and non-GMO audits. LanzaJet’s carbon-captured ethanol, highlighting the rising demand for ultra-low-carbon feedstocks, secured a premium price in perfume supply contracts. Furthermore, industrial-grade volumes are climbing, spurred by tightening volatile-organic-compound caps in the paints and coatings markets of China and South Korea.
Note: Segment shares of all individual segments available upon report purchase
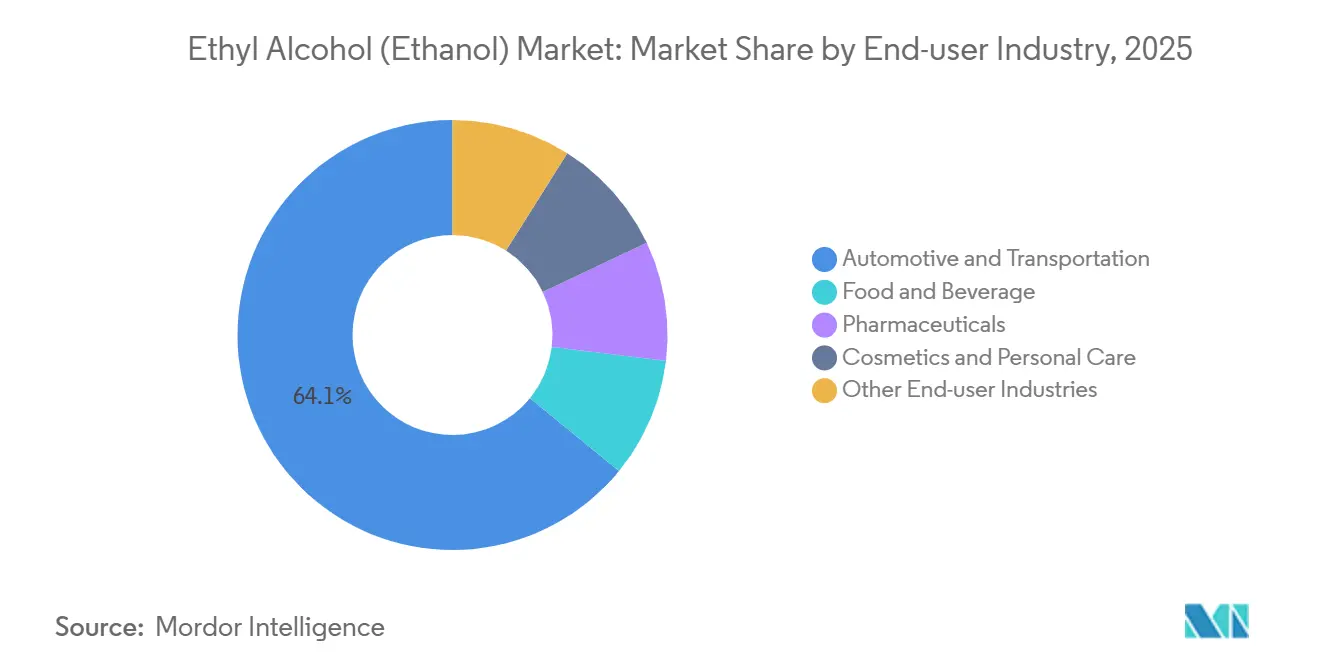
By End-User Industry: Cosmetics Pivot to Low-Carbon Ethanol Reshapes Sourcing
In 2025, the automotive and transportation sectors consumed 64.11% of the supply. However, the cosmetics and personal care industry is on the fastest growth trajectory, boasting a 5.89% CAGR during the forecast period of 2026-2031, primarily driven by fragrance formulations rich in ethanol. The food and beverage sector maintained a consistent share, buoyed by the growth of premium spirits in the Asia-Pacific region. Pharmaceutical applications, bolstered by reserves from the United States Strategic National Stockpile, commanded a significant market portion. Other industrial sectors, such as paints, adhesives, and inks, also accounted for a notable share of consumption, driven by strong demand for high-solid solvents in the Asia-Pacific construction sector.
Projections indicate that the cosmetics sector will capture an even larger share of the Ethyl Alcohol Market by 2031. Luxury brands such as LVMH, Estée Lauder, and Coty are pushing for lifecycle intensities to fall below specific thresholds, nudging suppliers towards carbon capture and storage (CCS) and waste-gas solutions. While the automotive sector's demand growth is tapering due to the surge in EVs, flex-fuel fleets in Brazil and the United States Midwest are still driving substantial volumes. The premiumization of Asian whiskey is bolstering food-grade ethanol demand, as consumers show a willingness to pay extra for certified organic or non-GMO spirits. In the pharmaceutical sector, orders for sanitizer refills remain robust, ensuring that capacity for USP-grade products stays tight through 2027.
Note: Segment shares of all individual segments available upon report purchase
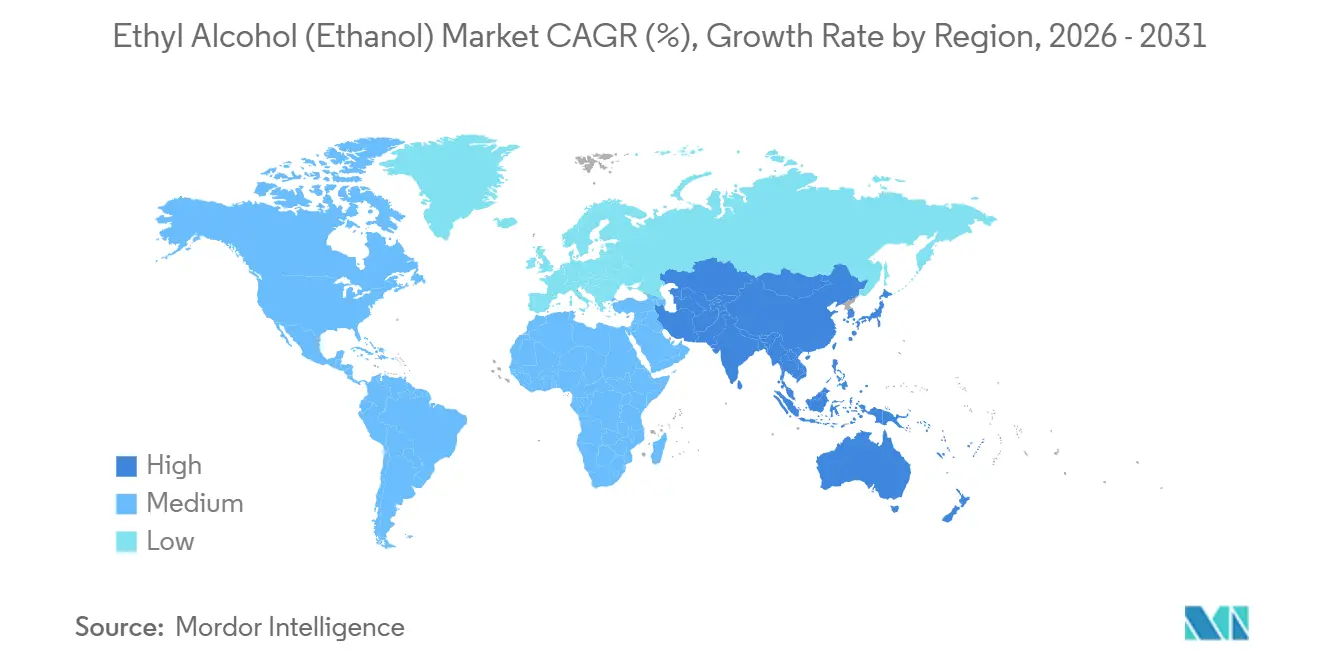
In 2025, North America commanded 33.36% of the global volume, supported by the Renewable Fuel Standard's mandates. The United States, anchoring the regional supply, has a robust production capacity, with many plants targeting improved margins through CCS adoption by 2028. Canada's federal clean-fuel regulation, effective in 2025, aims to boost nationwide ethanol blends, though current volumes remain modest. Mexico, in 2025, capped ethanol in gasoline, leading to sustained import demand from the United States.
The Asia-Pacific region is projected to grow at a 6.51% CAGR through the 2026-2031 forecast period, with its Ethyl Alcohol Market Share set to expand. In the 2024-2025 supply year, India made significant ethanol purchases, achieving a notable blend and aiming for a nationwide increase by 2028. China's E10 initiative, active in several provinces, consumed a large volume of corn ethanol in 2025, but its nationwide expansion depends on stabilizing corn prices. ASEAN's consumption, bolstered by imports from regional neighbors, has been driven by Thailand's cassava-derived gasohol and the Philippines' new E10 mandate.
South America, in 2025, saw a significant boost from Brazil's output and RenovaBio's rising CBIO targets for 2026. Logistics from mills to coastal export terminals, streamlined by Raízen and Copersucar pipelines, enhance arbitrage opportunities with California's LCFS and Europe's SAF mandates. Europe, while accounting for a smaller share in 2025, saw Germany and France emerge as key markets. With RED III now favoring cellulosic and waste-based ethanol, demand is shifting, especially with double-counting eligibility. The Middle-East and Africa, the smallest region, are eyeing potential in Saudi Arabian pilot projects harnessing date-palm waste, suggesting new feedstock possibilities post-2028.
Market Concentration
The ethyl alcohol market is highly fragmented with top companies balancing scale advantages against regional nuances. Raízen, leveraging its mills, boasts a significant annual capacity and operates numerous retail sites, merging cane farming with fuel marketing. POET, a leader in the United States market, commands substantial capacity across its sites and is investing in retrofitting its Emmetsburg cellulosic plant into an SAF facility, set to launch in 2028. ADM is boosting its Decatur CCS capacity, leveraging 45Q credits and monetizing captured CO₂ through beverage and greenhouse contracts.
As technology advances, differentiation is increasingly based on carbon-intensity scores. Summit Carbon Solutions, with its pipeline linking Midwest plants, is set to unlock premium LCFS and 45Z credits from 2026. LanzaTech's gas-fermentation modules and Carbon Clean's modular DAC units aim to produce negative-CI ethanol by 2029, targeting lucrative markets in luxury cosmetics and aviation. In Brazil, Copersucar and Raízen are eyeing ethanol-to-jet units, capitalizing on abundant bagasse energy and stacking CBIO premiums. Thai Bioethanol and Ubon Bio Ethanol are expanding cassava capacity to meet ASEAN mandates and serve Japan's solvent market, while Wilmar International boasts a broader regional presence. Patent filings for 2024-2025 highlight a research shift towards efficiency and decarbonization, spotlighting enzymatic hydrolysis, membrane distillation, and integrated CCS.

*Disclaimer: Major Players sorted in no particular order
1. Introduction
2. Research Methodology
3. Executive Summary
4. Market Landscape
5. Market Size and Growth Forecasts (Volume)
6. Competitive Landscape
7. Market Opportunities and Future Outlook
Ethyl alcohol (ethanol) is a clear, transparent liquid widely used in fuel and alcoholic beverages like beer, wine, or brandy. Alcoholic drinks, such as beer, spirits, wine, etc., are diluted with ethanol. It is a topical treatment to prevent skin infections, pharmaceutical preparations, cosmetics, and perfumes.
The ethyl alcohol (ethanol) market is segmented by grade, end-user industry, and geography. By grade, the market is segmented into food grade, industrial grade, pharmaceutical grade, and lab grades. By end-user industry, the market is segmented into automotive and transportation, food and beverage, pharmaceuticals, cosmetics and personal care, and other end-user industries. The report also covers the market size and forecasts for ethyl alcohol in 16 countries across major regions. For each segment, the market sizing and forecasts have been done on the basis of volume (liters).
Unlocking Supplier Partnerships in the Africa Lubricants Market
5 Min Read
Strategic Expansion of Floor Coatings in the MEIA Region
4 Min Read
Unlocking Market Potential for Solid-State Transformers
3 Min Read
When decisions matter, industry leaders turn to our analysts. Let’s talk.