
Monoethylene Glycol Market Size and Share
Market Overview
| Study Period | 2020 - 2031 |
|---|---|
| Market Volume (2026) | 38.41 Million tons |
| Market Volume (2031) | 49.42 Million tons |
| Growth Rate (2026 - 2031) | 5.17 % |
| Fastest Growing Market | Middle East and Africa |
| Largest Market | Asia Pacific |
| Market Concentration | Medium |
Major Players *Disclaimer: Major Players sorted in no particular order Image © Mordor Intelligence. Reuse requires attribution under CC BY 4.0. | |
Monoethylene Glycol Market Analysis by Mordor Intelligence
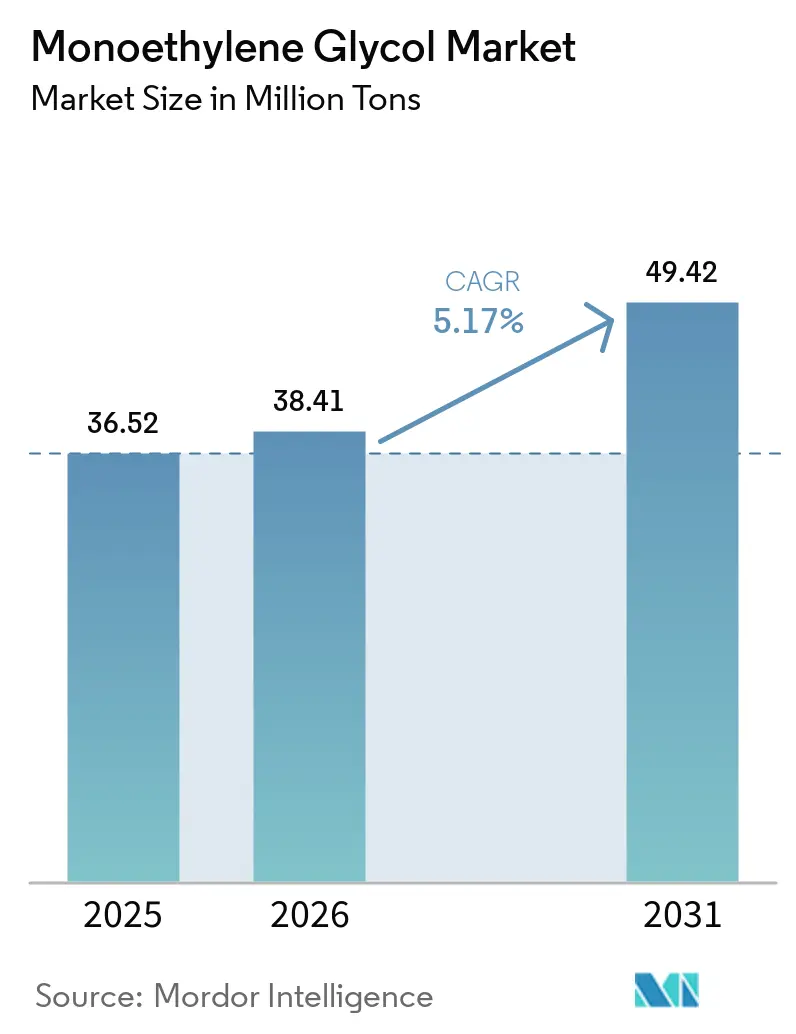
The Monoethylene Glycol Market size was valued at 36.52 million tons in 2025 and estimated to grow from 38.41 million tons in 2026 to reach 49.42 million tons by 2031, at a CAGR of 5.17% during the forecast period (2026-2031). Strong demand for polyester fiber, rapid adoption of e-commerce, and increasing needs for electric-vehicle coolant underpin this growth trajectory. Asia-Pacific producers capitalize on integrated ethylene crackers and competitive labor to maintain cost leadership, while Middle Eastern plants leverage advantaged ethane pricing to push exports into Europe and Africa. On the demand side, consumer brands’ sustainability pledges are accelerating the adoption of high-performance, recyclable PET bottles and films that rely on premium MEG grades. Technology change also matters; pilot-scale CO₂-to-MEG routes could curb feedstock volatility and improve Scope 3 footprints in the next decade. At the same time, intensified carbon pricing and single-use plastic regulations in the EU and California introduce compliance costs that favor scale players with diversified portfolios.
Key Report Takeaways
- By application, polyester fibre led with 44.02% monoethylene glycol market share in 2025. PET film and sheets are forecast to post the fastest growth at 5.86% CAGR through 2031.
- By end-user industry, the textile and apparel sector commanded a 40.35% share of the monoethylene glycol market size in 2025. Packaging is projected to advance at a 6.02% CAGR between 2026-2031.
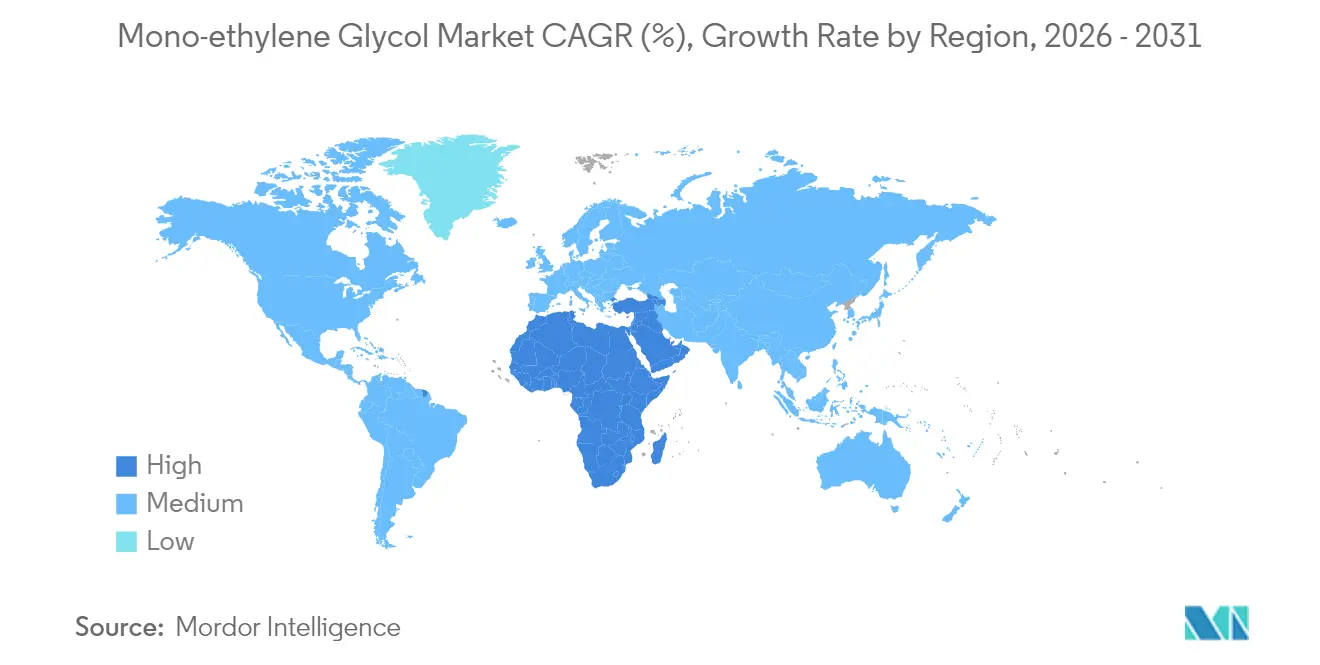
- By geography, Asia-Pacific held 53.10% of the 2025 volume, while the Middle-East and Africa are set to expand at a 5.98% CAGR to 2031.
Note: Market size and forecast figures in this report are generated using Mordor Intelligence’s proprietary estimation framework, updated with the latest available data and insights as of 2026.
Market Trends and Insights
Drivers Impact Analysis of Monoethylene Glycol Market*
| Drivers | (~) % Impact on CAGR Forecast | Geographic Relevance | Impact Timeline |
|---|---|---|---|
| PET packaging demand surge | +1.8% | Global, APAC and North America | Medium term (2-4 years) |
| Polyester-fiber capacity additions in APAC | +1.2% | Asia-Pacific core, MEA spill-over | Long term (≥ 4 years) |
| Automotive shift toward e-coolants and EV fluids | +0.9% | Global, early in Europe and China | Medium term (2-4 years) |
| Middle-East on-purpose MEG from cheap ethane | +0.7% | Middle East primary | Long term (≥ 4 years) |
| Commercialization of CO₂-to-MEG technology | +0.4% | North America and EU pilots | Long term (≥ 4 years) |
| Source: Mordor Intelligence | |||
PET Packaging Demand Surge
Consumer goods companies are pivoting toward lightweight, recyclable packaging, which increases MEG consumption through PET bottles and containers. Coca-Cola’s goal of using recycled content by 2030 paradoxically lifts virgin PET demand because bottle-grade rPET availability still lags rising collection targets[1]The Coca-Cola Company, “Reusable Packaging Targets,” coca-colacompany.com. E-commerce expansion adds volume as Amazon’s Frustration-Free Packaging program specifies high-barrier PET films that maximize cube efficiency and drop resilience. Emerging markets are accelerating the shift from glass to PET, and premium beverage brands in developed countries are favoring clarifying-grade MEG that improves optical properties. Specialty multilayer bottles for dairy and juice further widen the application mix. Overall, brand-owner sustainability targets act less as demand dampeners and more as catalysts for higher-quality, MEG-intensive grades.
Polyester-Fiber Capacity Additions in Asia-Pacific
Consolidation in China’s textile sector is driving the development of million-ton polyester complexes that optimize MEG procurement and integrate power, steam, and water utilities to achieve lower per-unit costs. India’s Production Linked Incentive scheme commits to synthetic fiber, unlocking fresh offtake for local refineries and increasing inbound MEG cargoes from the Gulf. Vietnam’s rapid ascendancy as a garment hub, spurred by trade realignment, adds demand nodes that favor nearby suppliers in Singapore and Thailand. Parallel investment in chemical recycling introduces a closed-loop pathway that requires both virgin and recycled MEG, ensuring dual-stream growth. As a result, the monoethylene glycol market benefits from both volume expansion and product-mix upgrades.
Automotive Shift Toward E-Coolants and EV Thermal Fluids
Electric-vehicle thermal management relies on advanced MEG-based glycol coolants that maintain low conductivity and stable viscosity over a wide temperature range. Tesla’s Model Y program uses MEG-based coolants. Ford’s F-150 Lightning and GM’s Ultium platform adopt similar formulations, while China’s BYD and SAIC standardize MEG blends for domestic and export EVs. Commercial fleets and stationary battery storage replicate the chemistry, extending the opportunity beyond passenger cars. Suppliers respond with low-conductivity additive packages that command margins above commodity antifreeze. Consequently, the monoethylene glycol market remains resilient even as internal-combustion coolant demand plateaus.
Middle-East On-Purpose MEG Projects Leveraging Cheap Ethane
SABIC’s Plaschem Park and Tasnee’s Al-Waha add integrated MEG, linking gas feedstock to downstream polyester production within a single industrial park. Proximity to Red Sea ports shortens time-to-market for European converters navigating CBAM tariffs. State-backed financing and utility subsidies lower operating costs, intensifying competition and prompting marginal producers in Northeast Asia and Europe to rationalize their capacity. In turn, global supply increases keep spot prices aligned with ethylene parity, benefiting converters but putting pressure on high-cost plants.
Restraints Impact Analysis of Monoethylene Glycol Market*
| Restraints | (~) % Impact on CAGR Forecast | Geographic Relevance | Impact Timeline |
|---|---|---|---|
| Volatile ethylene/crude oil feedstock pricing | -1.1% | Global, acute in import-dependent regions | Short term (≤ 2 years) |
| Anti-plastic regulations curbing virgin PET | -0.8% | EU and North America, spreading globally | Medium term (2-4 years) |
| Process-water and carbon intensity penalties | -0.6% | China and EU | Long term (≥ 4 years) |
| Source: Mordor Intelligence | |||
Volatile Ethylene/Crude Oil Feedstock Pricing
Ethylene cost swings compress margins, especially for older naphtha-based plants. Brent crude fluctuated in 2024, directly feeding MEG cash-cost curves. Integrated Middle Eastern complexes enjoy feedstock stability, whereas import-dependent Asian facilities are vulnerable to freight and currency shocks that amplify volatility. Inventory timing becomes critical; producers with internal cracker integration can hedge, while standalone buyers risk negative spreads. Capital budgets for debottlenecking pause during downcycles, potentially delaying efficiency upgrades. Consequently, the monoethylene glycol market faces near-term pricing turbulence that weighs on investment sentiment.
Anti-Plastic Regulations Curbing Virgin PET
The UN Global Plastics Treaty and California’s SB 54 pursue ambitious goals for reducing single-use plastics, potentially clouding visibility for future virgin PET sales. The EU’s Single-Use Plastics Directive extends material bans and taxes to wider categories, prompting converters to shift toward rPET grades or alternative polymers. While recycled content mandates foster circularity, they inflate compliance costs for small converters and shorten contract tenors, both of which can deter new MEG capacity builds. Global brand-owners hedge by diversifying into bio-based or paper-based packaging lines, creating incremental displacement risk. Over time, regulatory pressure may moderate the growth rate of the monoethylene glycol market, despite short-term spikes resulting from transitional stocking.
*Our forecasts treat driver/restraint impacts as directional, not additive. The impact forecasts reflect baseline growth, mix effects, and variable interactions.
Monoethylene Glycol Market Segment Analysis
By Application:
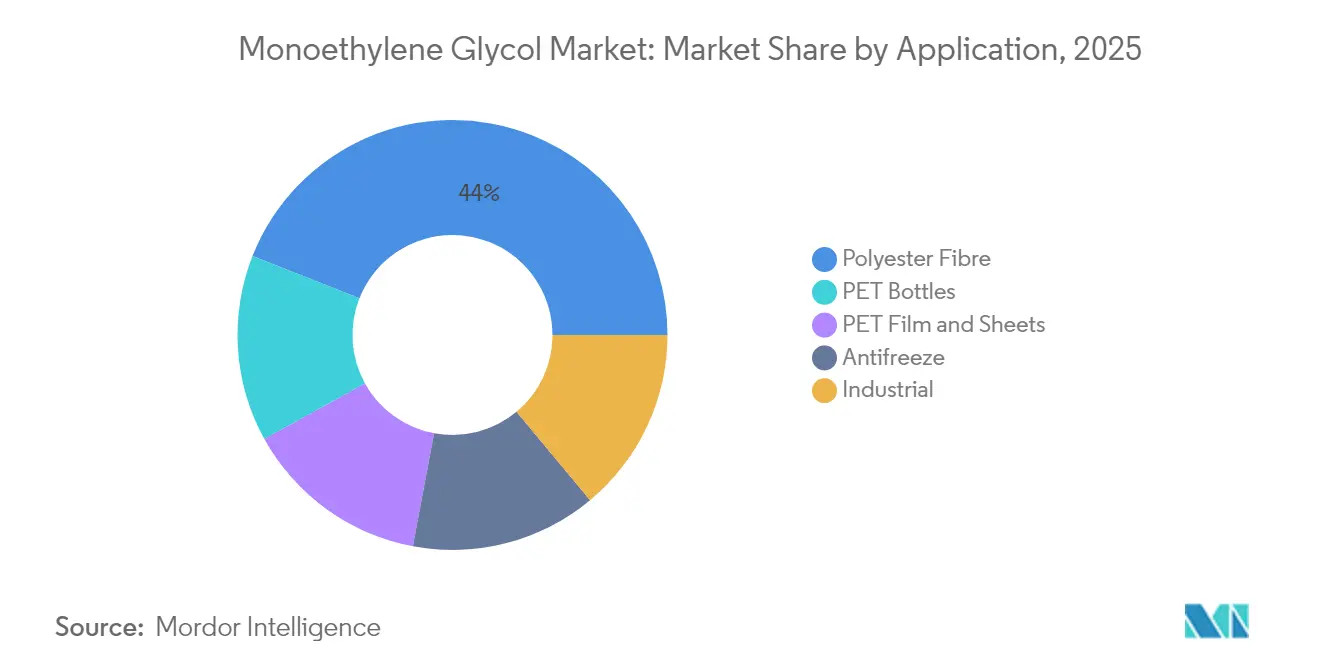
Polyester Fibre Remains the Anchor of GrowthPolyester Fibre accounted for 44.02% of volume in 2025, cementing its role as the primary offtake channel for the monoethylene glycol market. High-throughput Chinese spinning mills and expanding South Asian operations secure base-load demand, even during apparel cycles. PET Film and Sheets, although smaller, posts a 5.86% CAGR thanks to electronics packaging that requires tight-tolerance thickness and superior barrier films. Continuous casting technology upgrades permit thinner gauges that still meet mechanical strength, thereby lifting MEG consumption per unit of film. Antifreeze and industrial uses add stable, margin-accretive volume, while PET Bottles show steady replacement of glass and aluminum in beverages.
Specialty applications broaden value capture. Metalized PET films for snack, dairy, and nutraceutical packaging fetch higher margins due to extended shelf-life performance. In automotive interiors, PET substrates laminated with vegan leather finishes help OEMs meet sustainability benchmarks. These developments raise the average selling price of downstream products, offsetting feedstock price swings and supporting the long-term profitability of the monoethylene glycol market. Furthermore, low-defect PET sheet lines in Southeast Asia supply South Korean and Japanese electronics assemblers, creating integrated regional value chains that lock in MEG supply contracts for up to three years.



By End-User Industry:
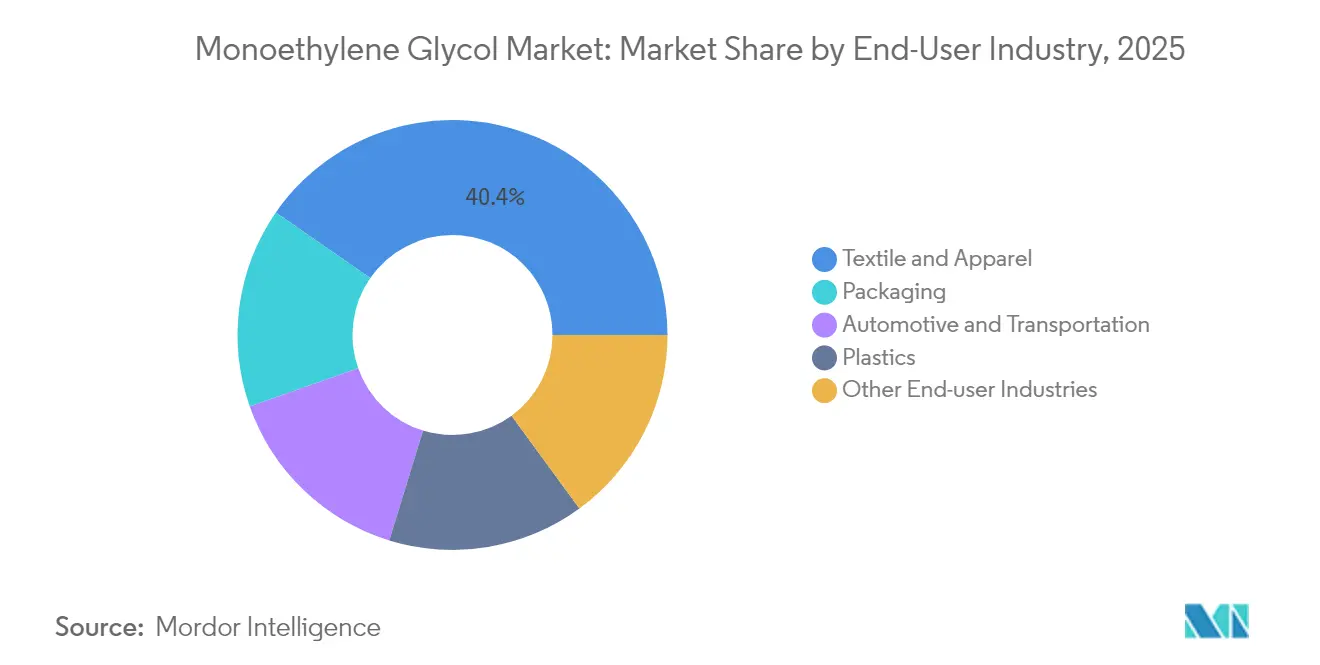
Packaging Challenges Textile PrimacyThe textile and apparel sector accounted for a 40.35% share of the monoethylene glycol market size in 2025, driven by the rapid growth of fast-fashion production in China, Bangladesh, and India. Yet, Packaging is the fastest-growing end-use at a 6.02% CAGR, fueled by e-commerce parcelization and rising household disposable income. High-clarity PET trays and blister packs extend the shelf life of ready-to-eat meals, which are popular among urban millennial consumers in ASEAN markets. Automotive and Transportation, driven by lightweighting mandates and EV adoption, uses MEG-derived composites and coolants that reduce vehicle mass and enhance battery range. Plastics applications in construction and consumer durables offer demand stability during apparel down-cycles, while the Electronics segment captures niche requirements for dielectric insulating films in 5G base stations.
Demand diversification matters. As fast-fashion brands pilot closed-loop garment recycling, their fiber-grade MEG offtake may plateau, but packaging and EV thermal fluids are likely to compensate. The result is a more balanced consumption portfolio that keeps the monoethylene glycol market resilient against any single sector downturn. Companies with dual portfolios—commodity MEG for fiber and high-purity grades for electronics—can arbitrage margin differentials and optimize plant utilization.
Geography Analysis
APAC Monoethylene Glycol Market
Asia-Pacific controlled 53.10% of global volume in 2025, powered by China’s mega-scale polyester clusters in Ningbo and Hainan and India’s PLI-driven manufacturing build-out. Integrated refinery-to-polyester parks streamline logistics and utilities, resulting in per-ton costs that are well below global averages. Vietnam, Indonesia, and Thailand capture incremental investments from brands seeking China-plus-one sourcing strategies, creating a robust regional mesh of demand centers. Emission-trading compliance raises operating thresholds, pushing smaller Chinese players toward consolidation and favoring large, energy-efficient complexes. Thus, the monoethylene glycol market in Asia-Pacific enjoys scale economies that are difficult for other regions to replicate.
MEA Monoethylene Glycol Market
The Middle East and Africa are projected to post the highest forecast growth at 5.98% CAGR, underpinned by Saudi Arabia’s Vision 2030 diversification, which prioritizes downstream petrochemicals. Cheap ethane feedstock, access to deepwater ports, and state-backed infrastructure give Gulf Cooperation Council producers a shipping cost advantage in Europe and Africa. African nations, such as Ethiopia and Egypt, are beginning to build textile clusters that import MEG from Saudi Arabia and Oman, thereby closing the loop with duty-free agreements for finished garments destined for the EU. Political stability and reliable power remain challenges, yet early success stories demonstrate the region’s scalability potential.
North America and Europe Monoethylene Glycol Market
North America and Europe are facing stricter carbon-pricing regimes and single-use plastic rules, yet they remain relevant through high-value niche applications and sophisticated recycling infrastructure. U.S. shale gas unlocks cost-competitive ethylene crackers, although water-usage restrictions in states like Texas may constrain future debottlenecking efforts. The EU’s Carbon Border Adjustment Mechanism, effective 2026, imposes levies on embedded emissions, potentially favoring local glycol producers who purchase renewable electricity certificates. These measures encourage domestic investment in low-carbon MEG variants, such as bio-based and CO₂-derived grades, creating a premium tier within the monoethylene glycol market.

Regulatory Landscape
Monoethylene glycol (MEG, CAS 107-21-1) is regulated globally through chemical safety, labeling, and environmental-handling frameworks rather than outright bans. In the European Union, MEG is managed under REACH (EC) No 1907/2006 registration obligations and classified for hazard communication under CLP using GHS-aligned classifications, including acute oral toxicity and chronic target-organ effects. This drives requirements for safety data sheets, workplace controls, and downstream user communication across PET, fiber, and antifreeze chains.
Trade measures also shape compliance and landed costs for cross-border supply. In October 2025, the European Commission issued Implementing Regulation (EU) 2025/2149 amending Regulation (EU) 2021/1976, confirming the transfer of the TARIC additional code C682 from Equistar Chemicals, LP to INEOS Americas LLC for anti-dumping duties on MEG imports originating in the United States. This type of customs codification matters for buyers and traders to apply the correct duty treatment after corporate changes. In the United States, MEG handling and product stewardship typically spans EPA (waste and environmental management), OSHA (workplace exposure and handling), and CPSC-facing product labeling practices, reinforcing the need for consistent hazard communication and disposal procedures for industrial and consumer-adjacent formulations.
Value Chain Analysis
The MEG value chain starts with hydrocarbon feedstocks (natural gas/ethane, naphtha, or coal-derived syngas in some regions) converted to ethylene, then oxidized to ethylene oxide (EO) and hydrated to monoethylene glycol. Integration between crackers, EO/MEG units, and downstream polyester/PET facilities remains a structural advantage in Asia-Pacific and the Middle East, lowering logistics and utilities costs and supporting higher operating rates, while standalone plants are more exposed to ethylene and energy volatility.
Downstream, MEG flows into polyester fiber and PET resin and film producers, then to textile and apparel, packaging converters, and automotive coolant formulators. Distribution is handled via bulk terminals, tank trucks, rail, and seaborne parcels. Recent developments also point to alternative feedstocks sitting alongside conventional EO-based routes, with Sustainea partnered and co-located with Primient in Lafayette, Indiana (announced October 2024) to support a bio-MEG facility, illustrating a parallel chain built around agricultural sugars and fermentation and processing steps. Trade policy and logistics disruptions have pushed buyers toward longer-term contracts and regional diversification, tightening the linkage between upstream reliability (turnarounds, outages, chokepoints) and downstream operating continuity for polyester and PET assets.
Competitive Landscape
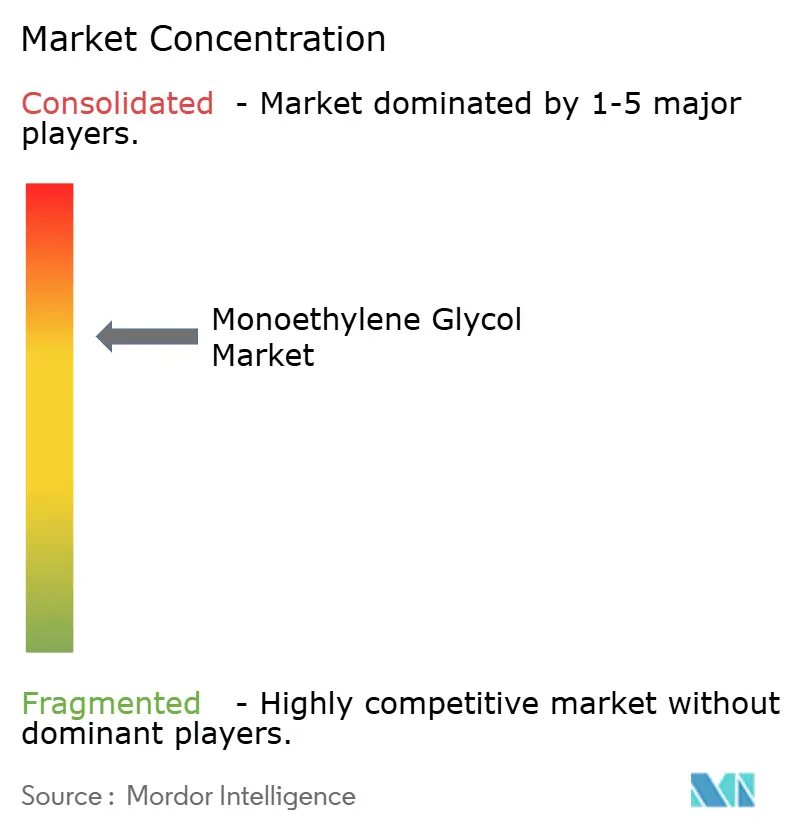
The monoethylene glycol market is moderately consolidated. SABIC leverages advantaged feedstock to ship volumes into Europe, smoothing seasonality with multi-year offtake agreements on the Amsterdam-Rotterdam-Antwerp corridor. Regional specialists fill demand gaps. Indorama Ventures targets fiber-grade purity, supplying ASEAN textile mills through captive logistics hubs. Strategically, incumbents pursue feedstock flexibility, CO₂ abatement, and customer proximity. Several players integrate mechanical and chemical recycling to hedge against the risk of virgin demand. Capital is also flowing into on-purpose MEG units in the Middle East that displace naphtha-based output in Europe and North Asia. Patent activity in catalysts and process intensification is on the rise, signaling a pivot toward innovation with sustainability credentials. Overall, cost leadership remains essential, but differentiation increasingly hinges on carbon metrics and circularity partnerships.
Monoethylene Glycol Industry Leaders
SABIC
Dow
Shell plc
Reliance Industries Limited
MEGlobal
- *Disclaimer: Major Players sorted in no particular order
Monoethylene Glycol Market Companies Covered in this Report
- BASF
- China Petrochemical Corporation
- Dow
- Eastman Chemical Company
- Exxon Mobil Corporation
- Formosa Plastics Corporation
- Hengil Group Co., Ltd
- Huntsman International LLC
- India Glycols Limited
- Indorama Ventures Public Company Limited.
- LG Chem
- MEGlobal
- Mitsubishi Chemical Corporation
- NAN YA PLASTICS CORPORATION
- PTT Global Chemical Public Company Limited
- Reliance Industries Limited
- SABIC
- Shell plc
- Sustainea

Market Opportunities and Future Outlook
Low-carbon and alternative-feedstock MEG remains an active whitespace area as brand-owner packaging commitments and Scope 3 programs intersect with chemical supply decisions. The June 2024 technology transfer agreement between Technip Energies and Shell Catalysts and Technologies to commercialize Bio-2-Glycols (bio-based MEG from glucose) and Sustainea's USD 400 million bio-MEG project in Lafayette, Indiana (announced October 2025, supported by a partnership and co-location with Primient) indicate that drop-in bio-MEG is moving from pilot and licensing into asset buildouts. This is creating procurement pathways for packaging and textile value chains that need identical performance with improved carbon narratives.
Supply security and feedstock diversification are also generating opportunity pockets, particularly where import dependence is high or logistics risk is concentrated. Middle East supply sensitivity tied to the Strait of Hormuz has been reflected in disruptions such as SABIC's March 2026 force majeure on ethylene glycol, while China has advanced coal-to-ethylene glycol (CTEG) development milestones (project approvals, EIAs, and construction starts reported in March 2026) and upgrades such as Xinjiang Tianying Petrochemical's July 2026 technical transformation completion for a syngas-to-ethylene glycol facility. Together, these developments point to advantaged, integrated producers competing on reliability, while buyers add optionality through multi-origin sourcing, longer-tenor contracts, and qualification of bio-based or non-oil-linked supply routes.
Recent Industry Developments in Monoethylene Glycol Market
- April 2026: SABIC declared force majeure on ethylene glycol supply following logistics disruptions linked to the Strait of Hormuz that affected shipment flows from Saudi plants. The announcement highlighted chokepoint exposure for export-oriented Middle East volumes and increased buyer focus on alternative sourcing and inventory strategies.
- October 2025: Dow and MEGlobal expanded their strategic ethylene supply agreement, with Dow committing additional ethylene feedstock (100 KTA) to MEGlobal's co-located MEG manufacturing facility at Oyster Creek. The step strengthened feedstock security and improved operational resilience for on-purpose MEG production tied to U.S. Gulf Coast infrastructure.
- June 2024: Technip Energies and Shell Catalysts and Technologies signed a technology transfer agreement to commercialize Bio-2-Glycols for producing bio-based monoethylene glycol from glucose. The collaboration advanced licensing availability for non-fossil MEG routes, supporting downstream users that are qualifying lower-carbon inputs for PET and polyester applications.


Monoethylene Glycol Market Report Scope and Research Methodology
Market Definition and Coverage
For this methodology, the monoethylene glycol (MEG) market is defined as the demand and supply of MEG as a commodity chemical, tracked by how much MEG is consumed across major downstream uses and regions during the study period.
Scope exclusions: This sizing excludes downstream product values (such as finished polyester fiber, PET resin, or packaged goods) and counts only MEG volumes.
Segments Covered in This Report
- By Application
- Polyester Fibre
- PET Bottles
- PET Film and Sheets
- Antifreeze
- Industrial
- By End-User Industry
- Textile and Apparel
- Packaging
- Automotive and Transportation
- Plastics
- Other End-user Industries (Electronics, Paints)
- By Geography
- Asia-Pacific
- China
- India
- Japan
- South Korea
- Rest of Asia-pacific
- North America
- United States
- Canada
- Mexico
- Europe
- Germany
- United Kingdom
- Italy
- France
- Spain
- Rest of Europe
- South America
- Brazil
- Argentina
- Rest of South America
- Middle-East and Africa
- Saudi Arabia
- South Africa
- Rest of Middle-East and Africa
- Asia-Pacific
Data Sources, Market Sizing, and Validation
Desk Research
Desk research is used to build the first version of the market map and to anchor the model to traceable industry signals. We rely on public sources such as national statistical agencies, customs and trade statistics portals, energy and petrochemical trade associations, and peer reviewed chemistry and polymer journals for context on production, trade flows, and demand direction. In addition, company annual reports, investor presentations, and plant level announcements are reviewed to understand capacity additions, shutdowns, and integration into polyester and PET chains.
To tighten the numbers, we also used paid database subscriptions for company financials and news intelligence, along with patent databases to track process shifts that can affect yields and costs over time. Import and export shipment level data was referenced selectively to cross-check regional movement patterns when public trade lines were too broad. The desk sources described above are illustrative and not exhaustive, and other public documents and databases were also referred to for data collection, validation, and clarification.
Primary Interviews and Surveys
Primary work focuses on verifying how MEG demand behaves when official series are delayed or reported in mixed chemical groupings. We spoke with participants across producers, distributors, and downstream buyers to confirm application splits, contract versus spot buying patterns, and how feedstock swings tend to pass through to MEG pricing and operating rates. Since this is a global market, discussions were balanced across APAC, EMEA, and the Americas so regional trade effects and capacity utilization assumptions could be checked with practical inputs.
Distribution of primary research fieldwork respondents
| Company type | Respondent position | Region |
|---|---|---|
| Top tier: 38% | CXOs: 17% | APAC: 40% |
| Mid tier: 45% | Functional/Unit leaders: 37% | EMEA: 36% |
| Smaller Players: 17% | Managers: 46% | Americas: 24% |
Market-Sizing & Forecasting
Market sizing is built by first reconstructing the demand pool from downstream indicators, then translating those indicators into MEG consumption in tons. The top-down and bottom-up logic is applied by linking polyester fiber and PET related demand signals to MEG consumption factors, which are then adjusted by regional trade balance and inventory movement. Once that total is formed, it is corroborated using selective bottom-up approximations, such as capacity and operating rate checks, sampled price and volume sanity checks, and channel feedback on tightness or oversupply.
Key model inputs include polyester fiber output direction, PET bottle and packaging conversion trends, antifreeze and coolant demand patterns in automotive and transport, regional operating rates and planned capacity additions, and import export flows that shift availability between regions. When a supplier roll up has gaps (for example, limited disclosure for smaller plants), we fill it using capacity proxies and utilization bands confirmed in interviews, and then re-check the result against trade and downstream use signals.
For forecasting, scenario analysis is used so different outcomes for capacity start-ups, operating rates, and polyester and PET demand growth can be reflected without overfitting limited data. Assumptions on utilization, trade tightness, and the pace of downstream demand are stress tested with expert feedback, and then a single base case is selected for the final forecast series.
Data Validation & Update Cycle
Outputs are validated through a set of checks that aim to catch inconsistencies early and keep assumptions realistic. We compare the modeled totals with independent signals such as capacity and utilization ranges, trade direction by region, and downstream consumption logic, and then any large variances are reviewed by another analyst before sign-off. If an assumption appears sensitive, respondents are re-contacted to confirm whether the shift is structural (such as a new plant start-up) or temporary (such as a short maintenance outage).
The report is refreshed on an annual cycle, and interim updates are triggered when material events occur, including major capacity additions, prolonged shutdowns, or sharp feedstock and pricing shifts that change run rates. Before delivery, a final review pass is completed so clients receive an updated view aligned to the latest public disclosures and primary feedback.
Mordor Intelligence's Monoethylene Glycol Market Sizing Compared With Other Published Estimates
Published market sizes for monoethylene glycol often do not line up because each publisher anchors the model to different units, timing, and demand signals. The gaps usually show up when one estimate is built from value and price assumptions, while another is reported in tons and tied to downstream consumption factors.
Downstream product values like polyester fiber, PET resin, or packaged goods sit outside Mordor Intelligence's scope here, so the 2025 figure is presented as MEG volume rather than an implied revenue total, which can create a visible spread versus value-based publications. Differences also come from how coal-to-MEG output is treated in regional supply, whether spot price spikes are annualized or taken at peak months, and how quickly assumptions are rechecked after new capacity comes online or delays occur.
Benchmark comparison
| Source | Market Size | Gaps in Research Methodology |
|---|---|---|
| Mordor Intelligence | USD 36.52 M (2025) | |
| Global Publisher A | USD 27.48 B (2025) | This estimate is value-based in USD, so it depends heavily on the chosen price deck, currency timing, and whether contract or spot pricing is used to represent the year, which makes it difficult to reconcile to a volume-led view. |
| Industry Publisher B | USD 32.20 B (2024) | This figure uses a different base year and a revenue framing, and it may bundle adjacent coverage assumptions (such as broader end-use mapping) that shift the effective average selling price and the implied demand pool versus a tonnage-led model. |
Taken together, the table suggests the biggest driver is a unit and scope mismatch, followed by timing and pricing assumptions. By keeping the model traceable to consumption indicators, trade movement, and operating rate checks, the final size stays repeatable and easier to validate year over year.


Key Questions Answered in the Report
What volume is the monoethylene glycol market projected to reach by 2031?
It is forecast to reach 49.42 Million Tons, expanding at a 5.17% CAGR.
Which region holds the largest share of global MEG consumption?
The Asia-Pacific region leads with 53.10% of the 2025 volume, thanks to its integrated polyester value chain.
Why is PET Film and Sheets the fastest-growing application?
Electronics packaging and automotive lightweighting demand specialty PET films that utilize higher-grade MEG, resulting in a 5.86% CAGR.
What regulatory trends could constrain virgin MEG demand?
Single-use plastic reduction laws, such as California’s SB 54 and the EU’s directives, push converters toward using recycled content.
Are low-carbon MEG pathways commercially viable yet?
Pilot CO₂-to-MEG plants show promise, and recent offtake agreements suggest scaled units could appear after 2030.
Page last updated on:


 Your data is secure and never sold or shared.


