Market Overview
| Study Period | 2018 - 2031 |
|---|---|
| Forecast Data Period | 2026 - 2031 |
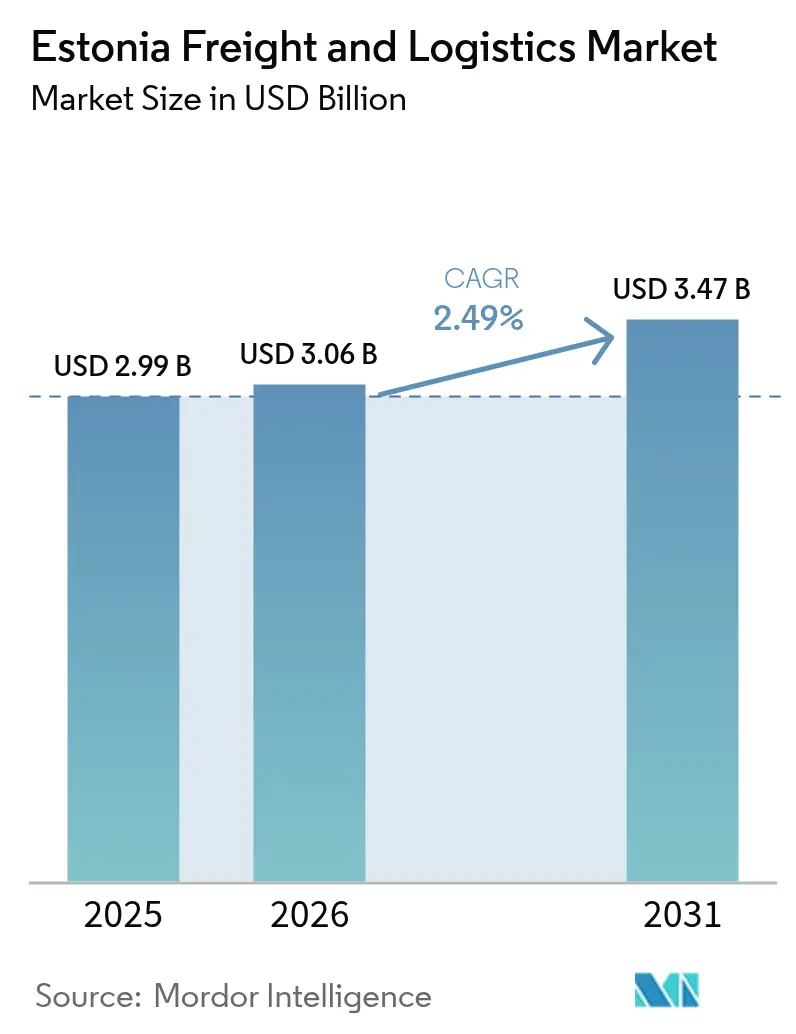
| Base Year Market Size (2025) | USD 2.99 Billion |
| Market Size (2026) | USD 3.06 Billion |
| Market Size (2031) | USD 3.47 Billion |
| Growth Rate (2026 - 2031) | 2.49% CAGR |
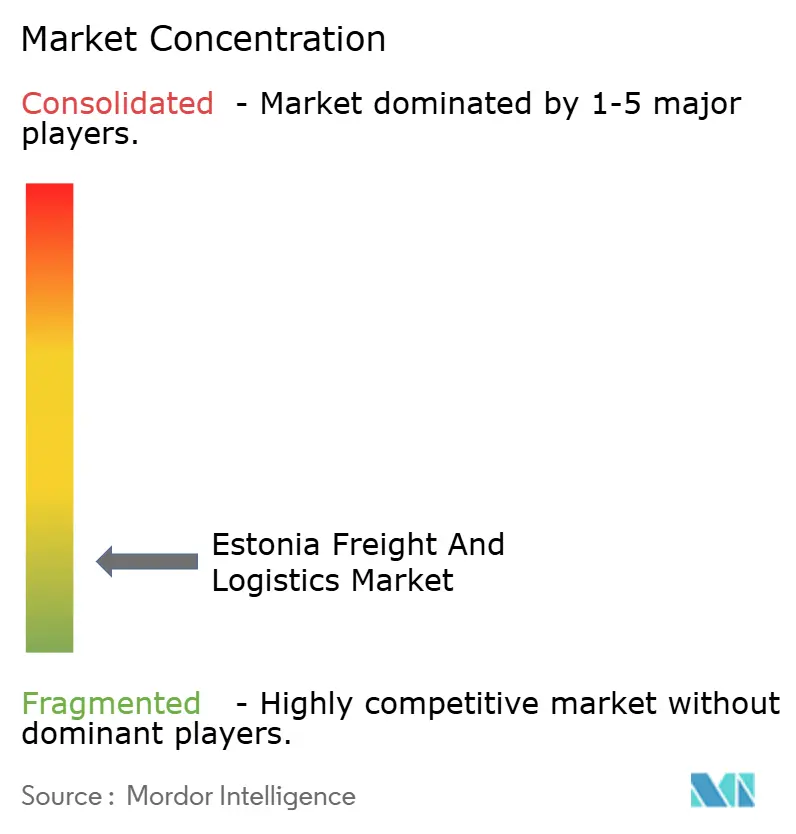
| Market Concentration | Low |
Major Players *Disclaimer: Major Players sorted in no particular order Image © Mordor Intelligence. Reuse requires attribution under CC BY 4.0. | |
Estonia Freight And Logistics Market Analysis by Mordor Intelligence
The Estonia freight and logistics market size was valued at USD 2.99 billion in 2025 and estimated to grow from USD 3.06 billion in 2026 to reach USD 3.47 billion by 2031, at a CAGR of 2.49% during the forecast period (2026-2031). Moderate expansion stems from Estonia’s role as a Baltic gateway, steady infrastructure outlays, and rising digital adoption. A sizeable portion of cargo still moves by road, yet multimodal options are strengthening as Rail Baltica construction progresses, and Tallinn Port deepens capacity. Temperature-controlled logistics is expanding on the back of seafood and life-science exports, while e-commerce keeps courier volumes climbing. Growing sustainability rules under the EU Green Deal push asset upgrades toward lower-carbon fleets, and Nordic near-shoring fuels demand for 3PL hubs around Tallinn.
Key Report Takeaways
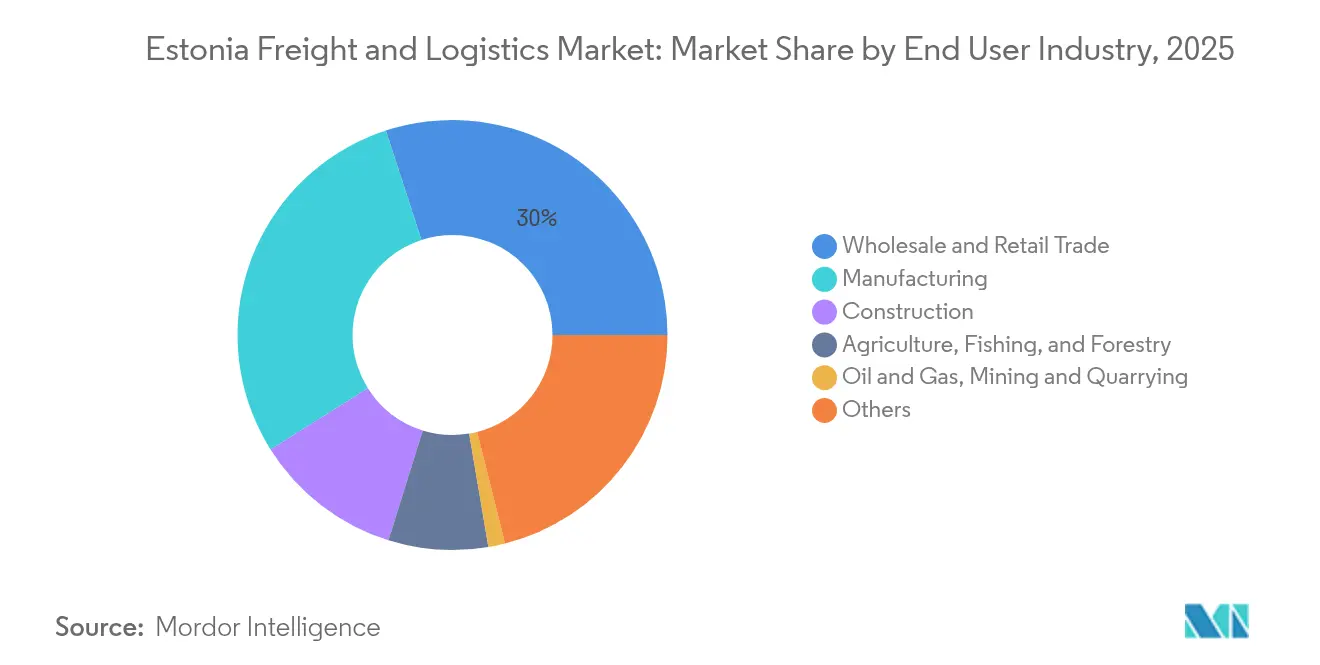
- By end user industry, wholesale and retail trade held 30.02% of Estonia freight and logistics market share in 2025, whereas manufacturing is anticipated to grow at a 2.58% CAGR between 2026-2031.
- By logistics function, freight transport led with 60.12% of the Estonia freight and logistics market size in 2025; the Courier, Express, and Parcel (CEP) segment is projected to expand at a 2.76% CAGR between 2026-2031.
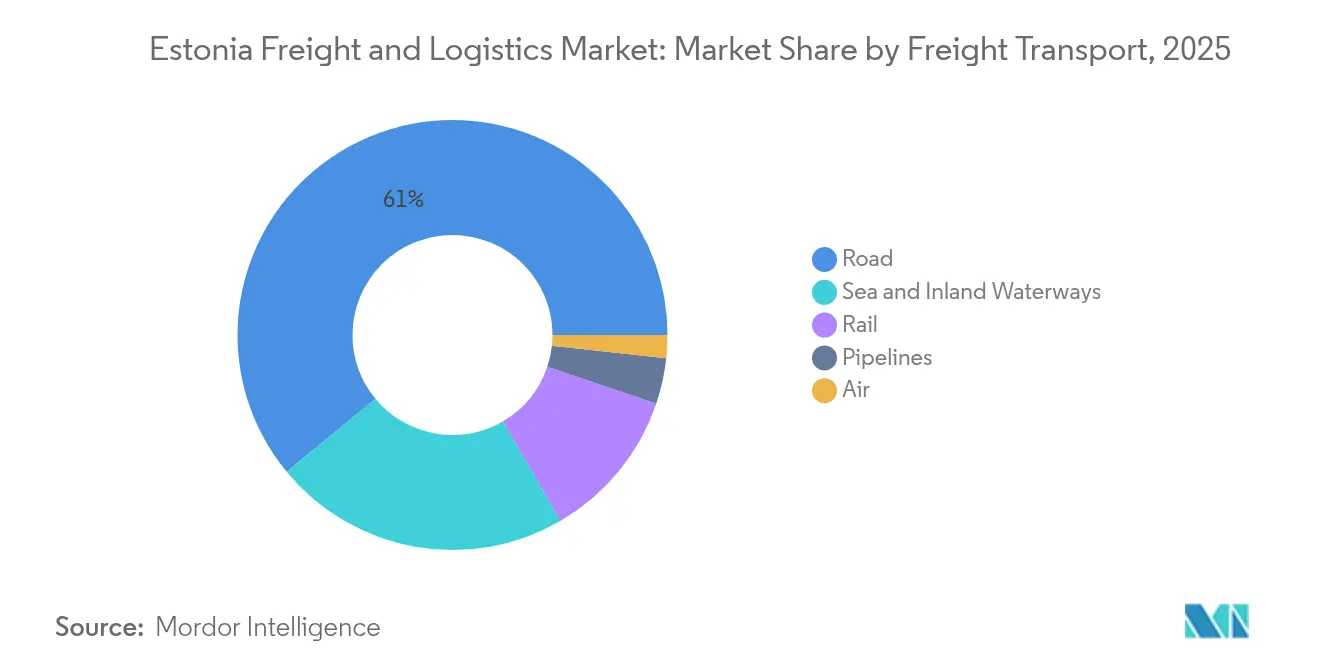
- By freight transport mode, road freight transport accounted for 60.98% revenue share in 2025, while air freight transport is poised for the fastest 4.72% CAGR between 2026-2031.
- By CEP delivery type, domestic parcels held a 63.74% revenue share in 2025; international consignments record the highest expected CAGR at 2.88% between 2026-2031.
- By warehousing temperature class, non-temperature-controlled facilities captured a 91.95% revenue share in 2025; temperature-controlled space is forecast to advance at a 2.33% between 2026-2031.
- By freight forwarding mode, sea and inland waterways commanded a 71.62% revenue share in 2025; air freight forwarding is set to rise at a 4.23% CAGR between 2026-2031.
Note: Market size and forecast figures in this report are generated using Mordor Intelligence’s proprietary estimation framework, updated with the latest available data and insights as of 2026.
Estonia Freight And Logistics Market Trends and Insights
Drivers Impact Analysis*
| Driver | (~) % Impact on CAGR Forecast | Geographic Relevance | Impact Timeline |
|---|---|---|---|
| Estonia's Rail Baltica and port expansion investments impacting freight market | +0.6% | National, with spillover to Latvia, Lithuania, and Poland | Long term (≥ 4 years) |
| Temperature-controlled services demand witnessed from seafood and pharma exports | +0.5% | National, with concentration in coastal regions and major export centers | Medium term (2-4 years) |
| Governments champion digitalization in logistics with initiatives like X-Road and E-Freight | +0.4% | National, with implementation focused in major logistics hubs | Medium term (2-4 years) |
| European Union's green deal incentives for low-carbon freight driving demand | +0.4% | National, aligned with EU-wide implementation | Long term (≥ 4 years) |
| Nordic companies turn to Estonian 3PL hubs for near-shoring | +0.3% | National, with emphasis on northern Estonia and Tallinn region | Short term (≤ 2 years) |
| Energy security and diversification initiatives driving infrastructure logistics demand | +0.3% | National, with focus on coastal areas and energy infrastructure zones | Medium term (2-4 years) |
| Source: Mordor Intelligence | |||
Rail Baltica and Port Expansion Investments
Contracts worth EUR 726 million (USD 801.24 million) signed in 2025 accelerate the construction of the European-gauge Rail Baltica line, slashing transit times and linking Estonia to core EU corridors[1]Rail Baltica, “Rail Baltica construction contracts in Estonia,” railbaltica.org. Parallel dredging and berth enlargements have doubled annual throughput potential at the Port of Tallinn since 2009, while year-round ice-free access and free-zone status draw shippers. Combined, the projects nudge freight from road toward rail-sea chains, support heavier block trains, and diversify routes away from sanction-prone eastern corridors.
Government-Backed Digital Platforms (X-Road, E-Freight)
X-Road links more than 450 public and private bodies, automating customs clearance and cutting document lead times. Estonia also pilots EU electronic Freight Transport Information (eFTI) requirements ahead of the July 2027 deadline, positioning carriers for paper-free cross-border trade[2]European Commission, “Electronic Freight Transport Information Regulation,” ec.europa.eu. These initiatives shrink administrative costs and raise real-time visibility, giving early adopters a margin edge.
Temperature-Controlled Services Demand
Seafood and pharma exporters lift cold-chain requirements; temperature-controlled warehousing, although it represents only 7.72% of the warehousing and storage segment in 2024, is outpacing the broader storage segment. Operators install IoT sensors and cloud monitoring to assure GDP-compliant conditions, limiting spoilage and supporting higher-value loads.
European Union's Green Deal Incentives for Low-Carbon Freight
The European Climate Law mandates at least 55% greenhouse gas emission cuts by 2030, in comparison to 1990 levels, tightening CO₂ ceilings for heavy trucks and extending the Emissions Trading System to shipping[3]European Commission, “Competition policy and economic growth,” ec.europa.eu. Carriers in Estonia qualify for EU funding to retrofit LNG trucks and fit shore-power units, yet must budget for rising carbon prices, reshape fleet investment plans.
Restraints Impact Analysis*
| Restraint | (~) % Impact on CAGR Forecast | Geographic Relevance | Impact Timeline |
|---|---|---|---|
| Driver shortage and an aging workforce pose challenges for the market | -0.4% | National; acute in rural areas | Medium term (2-4 years) |
| Capacity constraints witnessed at Tallinn port and inland waterways | -0.3% | Port districts and river routes | Short term (≤ 2 years) |
| Risks of sanctions and reliance on Russian transit freight impacting the market | -0.2% | Eastern border regions | Medium term (2-4 years) |
| Small domestic scale severely impedes 4PL economics in Estonia | -0.1% | National | Long term (≥ 4 years) |
| Source: Mordor Intelligence | |||
Driver Shortage and Aging Workforce
More than 233,000 truck drivers were missing across the EU in 2024, and projections show the gap could triple by 2028[4]IRU, “Driver shortage in Europe 2024,” iru.org. Estonia mirrors the pattern: the average driver age is climbing, license fees deter newcomers, and women remain just 4% of the cohort. Operators raise pay and promise fixed-route rosters, but margins tighten for the Estonia freight and logistics market.
Capacity Constraints at Tallinn Port and Inland Waterways
Cargo throughput fell year-over-year at Baltic ports between 2020-2023 as geopolitical volatility realigned flows, straining berth and yard layouts designed for different trade mixes. Shore-power grids and new substations will ease bottlenecks by 2030, yet interim slot scarcity pushes trans-shipment to Finnish and Latvian terminals.
*Our forecasts treat driver/restraint impacts as directional, not additive. The impact forecasts reflect baseline growth, mix effects, and variable interactions.
Segment Analysis
By End-User Industry: Retail stays dominant while manufacturing accelerates
Wholesale and retail trade consumed 30.02% of the market revenue in 2025 as omnichannel grocers and fashion chains expanded parcel locker networks. Manufacturing is the fastest-growing slice at a 2.58% CAGR (2026-2031), propelled by wood processing, electronics assembly, and specialty machinery output bound for the Nordics and Germany. Construction supported by projects like the Rail Baltica civil works and urban housing, demanding bulk aggregates and prefabricated modules.
Agriculture, fishing, and forestry leans on seasonal reefer and bulk flows, while oil, gas, and mining remain at a smaller share following upstream consolidation. Healthcare, public administration, and ICT fall into the “others” basket yet present high-margin opportunities for secure, time-critical logistics. ESG reporting commitments see all verticals requesting carbon footprints per shipment, embedding a new baseline service across the Estonia freight and logistics market.


By Logistics Function: Freight transport remains the revenue anchor while CEP gains speed
Freight transport commanded 60.12% of the 2025 freight and logistics market revenue, underscoring its role at the core of the Estonia freight and logistics market. The bulk stems from road and maritime legs that knit Scandinavian, Baltic, and Polish corridors. Digital waybill rollouts and automated tolling shave wait times, supporting steady growth amid driver shortages. Courier, Express, and Parcel services represent a smaller share, yet the segment’s 2.76% forecast CAGR (2026-2031) outpaces other functions thanks to e-commerce baskets rising above USD 875.25 million GMV in 2025. Warehousing and freight forwarding in 2024 benefited from the same online retail boom, prompting fulfillment centers to line Tallinn’s beltway and Tartu’s industrial zones.
Growing regulatory pressure for carbon disclosure forces service providers to differentiate. Many carriers now bundle emissions dashboards, facilitating shippers’ Scope 3 reporting. Meanwhile, inland customs integration via the eFTI platform removes legacy paperwork across transport functions, particularly for forwarding agents clearing consolidated loads bound for Germany or Sweden. As the Estonia freight and logistics market size expands, agile players integrating last-mile services, returns handling, and bonded storage emerge as preferred partners for omnichannel merchants searching for end-to-end visibility.
By Courier, Express, and Parcel: E-commerce redefines delivery expectations
Domestic parcels owned 63.74% of the CEP segment in 2025 as Estonia’s tech-savvy consumers favour home-shopping and automated parcel lockers. International parcels, supported by robust fintech and SaaS exports, are projected to register a 2.88% CAGR (2026-2031), helped by the EU one-stop-shop VAT regime that simplifies cross-border sales. Lockers permeate supermarkets and petrol stations, slashing failed-delivery rates and making Estonia a benchmark for the region. The Estonia freight and logistics market benefits as operators roll out route-optimization AI to compress delivery windows.
However, labor scarcity and rising wages compress margins, incentivizing pilots of battery-electric vans and eventual drone trials in less-dense suburbs. Cross-border flows must also comply with impending eFTI rules, pushing CEP players to automate document exchange. Service differentiation increasingly depends on real-time tracking APIs and green delivery options that let buyers offset emissions at checkout.
By Warehousing and Storage: Temperature control moves from niche to necessity
Non-temperature controlled depots still capture 91.95% of the warehouse segment revenue in 2025, yet temperature controlled post a faster 2.33% CAGR (2026-2031) as seafood and biopharma exports multiply. In 2024, cold facilities clustered near Tallinn’s port and airport ramps; new builds integrate ammonia-CO₂ cascade systems and rooftop solar, trimming energy intensity. Sensor-driven monitoring alerts staff to deviations within minutes, reducing stock loss and ensuring GDP compliance for injectables. As the Estonia freight and logistics market size for cold chain services climbs, multi-tenant 3PL sites offer pay-as-you-use pallets, easing CAPEX burdens for SME producers.
Automation also permeates dry warehouses with autonomous mobile robots and high-bay shuttles picking apparel and electronics. Local developers secure green-building certificates to satisfy corporate ESG targets. Rising land prices in Harju County spark secondary distribution hotspots in Pärnu and Rakvere, diversifying the national warehouse grid.
By Freight Transport: Road dominance faces a slowly accelerating multimodal shift
Road freight transport maintained a 60.98% revenue share in 2025, reflecting Estonia’s 16,489 km road network and continuous EU co-funding. Planned upgrades to four-lane standards on main arteries will hold this edge near-term, yet Rail Baltica’s commissioning promises modal rebalancing after 2029. Air freight transport is set to grow at a CAGR of 4.72% from 2026-2031, as Tallinn Airport adds wide-body cargo slots and pharmaceutical shippers pursue speed-to-market advantages. Port of Tallinn’s free-zone privileges and deep-water berths keep it central to east-west trades, though re-routed lanes avoid Russian waters following recent maritime seizures. Rail’s share underlines its bulk commodity relevance, yet profitability remains thin for the state operator until transit volumes rebuild upon the new European gauge.
A discernible shift toward combined rail-sea corridors aligns with EU climate targets. For example, container block trains arriving from the Muuga terminal transfer directly onto feeder vessels for Gothenburg, cutting road km and CO₂ output. With carbon pricing impending, more shippers contemplate such chains, gradually chipping away at the road freight’s share of the Estonia freight and logistics market.
By Freight Forwarding: Maritime weight prevails while air forwarding scales up
Sea and inland waterway freight forwarding dominated with a 71.62% share in 2025, riding on stable feeder loops linking Muuga to Hamburg and Rotterdam. Forwarders provide value-added customs brokerage and bonded warehousing, critical amid sanctions on Russian-origin goods. Air freight forwarding is the fastest rider at 4.23% CAGR (2026-2031) as electronics, live-science consignments, and urgent spares require overnight lift via Frankfurt and Helsinki hubs. Blockchain ledgers and electronic bills of lading, encouraged by eFTI mandates, compress file-to-file times and cut dispute risk, granting tech-savvy agents an edge.
Sanction risks push Estonian forwarders to cultivate routes through Central Europe and the Mediterranean, reducing reliance on eastern gateways. Larger global groups pursue bolt-on buys of niche Baltic agents to access compliant corridor knowledge, accelerating consolidation within the Estonia freight and logistics market.
Geography Analysis
Trade flows worth USD 16.22 billion in exports and USD 22.67 billion in imports during 2024 illustrate Estonia’s deficit-driven freight pattern. Tallinn concentrates most gateways: Muuga deep-sea terminals, the Ulemiste rail node, and Lennart Meri Airport form a tri-modal spine. Secondary clusters in Tartu and Parnu backfill regional warehousing. Road hauls represent 47.29% of tonnage yet only 24.24% of ton-km, confirming their short-haul nature. Conversely, sea and inland waterways carry 39.36% of tonnage but 64.97% of ton-km, underscoring maritime efficiency for longer distances.
Rail Baltica’s European-gauge tracks, now under full construction, reposition Estonia within TEN-T corridors connecting to Poland and Germany, promising modal re-allocation toward rail-sea combinations. Finnish firms have already pre-leased sites near the planned Ülemiste passenger-freight hub to stage Nordic flows southward. Customs hardening at the Russian border since August 2024 introduced 100% inspections to curb sanction evasion, causing a dive in east-bound transit volumes.
Maritime security has tightened as well: Estonia reroutes tankers outside Russian littoral waters after the 2024 Green Admire seizure. New navigation patterns lengthen voyages slightly yet minimize insurance premiums. Overall, geography-driven risks accelerate supply-chain redesign, spurring the Estonia freight and logistics market toward diversified corridors and greater resilience.
Competitive Landscape
The playing field is highly fragmented. Global integrators such as DHL, DSV (post-Schenker takeover), and CMA CGM compete with regional houses like ACE Logistics and Tallink Grupp. DSV’s EUR 14.3 billion (USD 15.78 billion) purchase of Schenker, closing in 2025, vaults the merged group to a commanding Baltic footprint and deeper air-sea alliances. CEP tussles intensify between Posti-owned SmartPosti, Omniva, and international operators scaling locker networks.
Differentiation hinges on digital depth: blockchain-enabled cargo receipts, AI route engines, and IoT tag suites are becoming table stakes. Niche opportunities flourish in pharma cold-chain, renewable-energy project cargo, and e-commerce fulfilment, where value-added packaging and returns management carry premiums. Digital freight platforms that match shippers to truck capacity proliferate, squeezing brokerage margins yet unlocking transparency.
EU competition policy analysis indicates that stronger rivalry can lift GDP by over 2% within five years if entry barriers fall. In Estonia, that translates into active antitrust scrutiny of large mergers while supporting SMEs in tech adoption grants. For multinationals, the strategic imperative is to blend scale economics with authentically local compliance know-how.
Estonia Freight And Logistics Industry Leaders
Omniva
La Poste Group (Including GeoPost)
DHL Group
Posti Group Oyj (Including SmartPosti OU)
DSV A/S (Including DB Schenker)
- *Disclaimer: Major Players sorted in no particular order

Recent Industry Developments
- May 2025: SmartPosti finalized a EUR 14 million (USD 15.45 million) logistics center in Rae Parish; the 7,500 m² hub triples parcel capacity and features 82 EV charging points in line with Posti’s zero-carbon roadmap.
- April 2025: DSV closed its EUR 14.3 billion (USD 15.78 billion) acquisition of DB Schenker’s logistics arm, boosting Baltic reach and integrating Schenker’s Tallinn warehousing into its global network.
- March 2025: Posti launched “Green Freight” in Estonia, offering fossil-free road options to shippers aiming to decarbonize last-mile deliveries.
- September 2024: ACE Logistics began constructing a new logistics campus in Kaunas to enlarge Baltic distribution capacity.


Research Methodology Framework and Report Scope
Market Definitions and Key Coverage
Our study treats Estonia's freight and logistics market as the external spend channeled into freight transport, forwarding, warehousing and storage, courier-express-parcel, and other value-added logistics services performed over road, rail, sea, air, and pipelines within, to, or from Estonia.
Scope Exclusion: In-house captive fleets, passenger mobility, and on-site material-handling equipment are excluded.
Segmentation Overview
- By End User Industry
- Agriculture, Fishing and Forestry
- Construction
- Manufacturing
- Oil and Gas, Mining and Quarrying
- Wholesale and Retail Trade
- Others
- By Logistics Function
- Courier, Express, and Parcel (CEP)
- By Destination Type
- Domestic
- International
- By Destination Type
- Freight Forwarding
- By Mode of Transport
- Air
- Sea and Inland Waterways
- Others
- By Mode of Transport
- Freight Transport
- By Mode of Transport
- Air
- Pipelines
- Rail
- Road
- Sea and Inland Waterways
- By Mode of Transport
- Warehousing and Storage
- By Temperature Control
- Non-Temperature Controlled
- Temperature Controlled
- By Temperature Control
- Other Services
- Courier, Express, and Parcel (CEP)
Detailed Research Methodology and Data Validation
Primary Research
Mordor analysts then held interviews and short surveys with freight forwarders, CEP managers, seafood exporters, and port officials across Tallinn, Tartu, Helsinki, and Warsaw. These conversations confirmed modal splits, warehousing utilization, and near-term tariff expectations, plugging gaps left by public data.
Desk Research
We pulled macro and trade inputs from Statistics Estonia, Eurostat, World Bank, and the Estonian Transport Administration to frame GDP shifts, industrial output, ton-kilometer flows, and parcel volumes. Port of Tallinn cargo reports, Rail Baltica progress updates, and Baltic customs logs sharpened cross-border corridor estimates. Operator financials from D&B Hoovers and news in Dow Jones Factiva gave us average selling prices and capacity clues. Industry notes from the Estonian Logistics & Freight Forwarding Association and parliamentary budget papers rounded out regulatory context. These sources are illustrative; many others supported data collection and validation.
Market-Sizing & Forecasting
We start top-down, reconstructing logistics spend from transport turnover, import-export values, and sectoral input-output coefficients. We then validate totals with bottom-up spot checks such as sampled road invoices and active warehouse square-meter rolls. Key drivers, including non-oil GDP, e-commerce parcel counts, container TEUs, diesel prices, and Rail Baltica capex, feed a multivariate regression that projects demand over the forecast period. Where bottom-up signals diverge by more than a specified percentage, we adjust toward the primary-research consensus before locking the baseline value.
Data Validation & Update Cycle
Outputs undergo peer review, variance tests against Eurostat and port statistics, and outlier flags in our model dashboard. Mordor refreshes the dataset every twelve months, with interim updates if material policy or infrastructure events surface.
Why Mordor's Estonia Freight And Logistics Baseline Commands Trust
Published estimates often disagree because firms differ in service scope, currency translation, and refresh cadence.
Some fold in captive fleets, others ignore warehousing; a few escalate historical figures without validating new inputs.
Benchmark comparison
| Market Size | Anonymized source | Primary gap driver |
|---|---|---|
| USD 2.99 B (2025) | Mordor Intelligence | - |
| EUR 3.02 B (2025) | Regional Consultancy A | Adds in-house fleet and inventory costs; applies fixed euro growth with no FX adjustment |
| EUR 1.45 B (2024) | Trade Journal B | Reports only transport company turnover; omits CEP and storage |
| EUR 0.50 B (2025) | Industry Association C | Uses voluntary member surveys; excludes foreign-owned operators and transit flows |
The comparison shows that Mordor's disciplined scope selection, dual-layer modelling, and annual refresh create a balanced baseline that decision-makers can trace to public metrics and repeat with confidence.


Key Questions Answered in the Report
What is the current size of the Estonia freight and logistics market?
The market reached USD 3.06 billion in 2026 and is expected to climb to USD 3.47 billion by 2031.
Which segment is growing fastest within the Estonia freight and logistics market?
The Courier, Express, and Parcel function registers the highest projected CAGR at 2.76% from 2026 to 2031, propelled by e-commerce demand.
How will Rail Baltica influence Estonia’s logistics sector?
Rail Baltica will integrate Estonia into the European gauge network, shorten transit times, and support a modal shift from road to rail-sea combinations.
What challenges does the industry face regarding labor?
A nationwide driver shortage and aging workforce, mirroring broader EU trends, constrain fleet utilization and spur wage inflation.
How are sustainability regulations affecting logistics operators in Estonia?
EU Green Deal mandates are accelerating investments in low-carbon trucks, shore-power infrastructure, and emissions-tracking tools, creating both cost pressures and service differentiation avenues.
Which end-user industry accounts for the largest logistics spend in Estonia?
Wholesale and retail trade leads with 30.02% share in 2025, reflecting robust consumer demand and omnichannel distribution needs.
Page last updated on:


