Epsom Salt Market Size and Share
Market Overview
| Study Period | 2021 - 2031 |
|---|---|
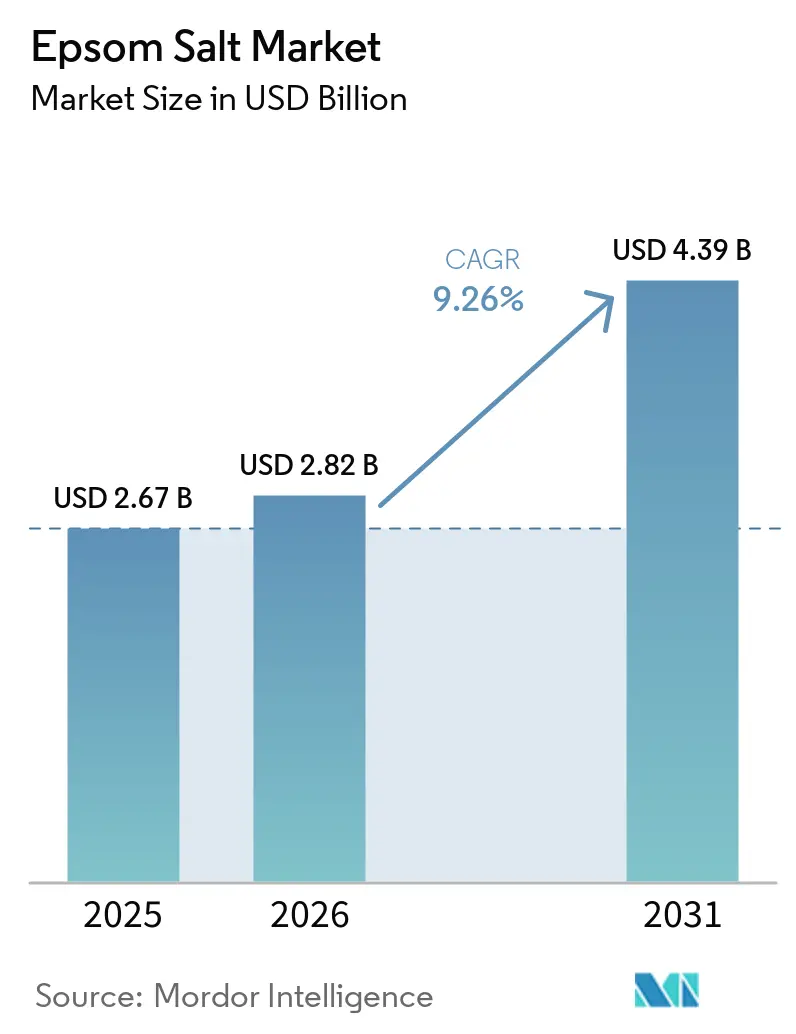
| Market Size (2026) | USD 2.82 Billion |
| Market Size (2031) | USD 4.39 Billion |
| Growth Rate (2026 - 2031) | 9.26% CAGR |
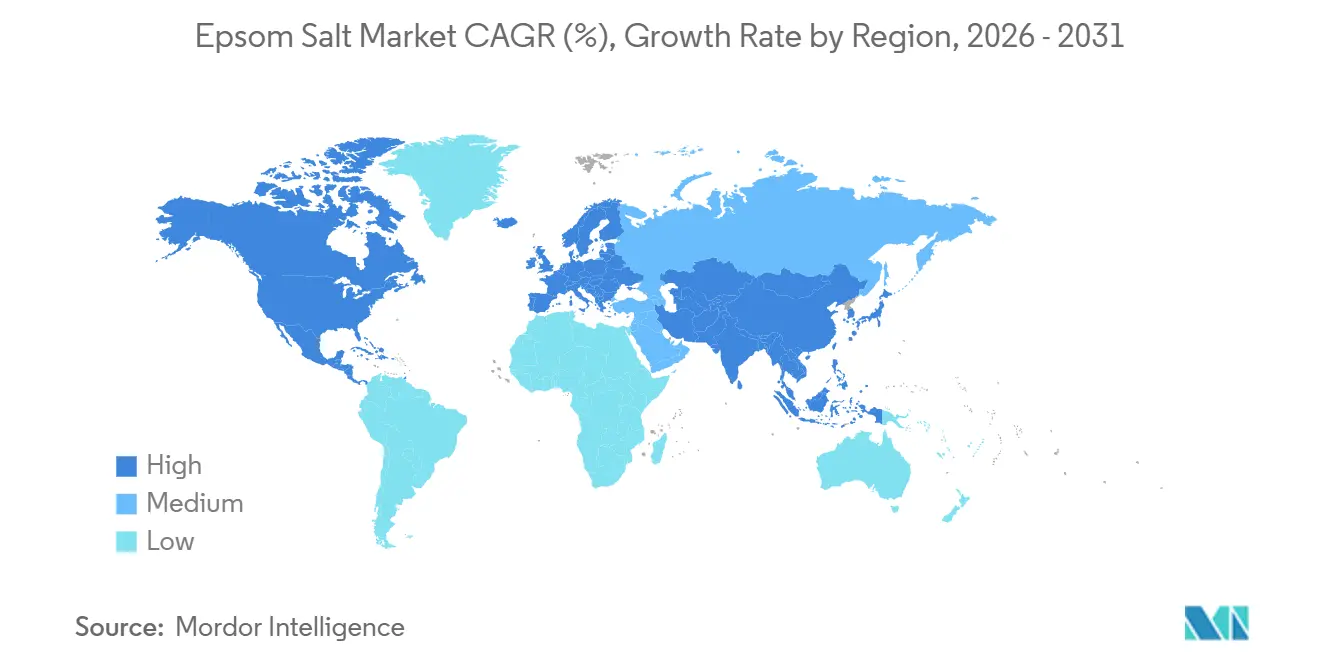
| Fastest Growing Market | North America |
| Largest Market | Asia Pacific |
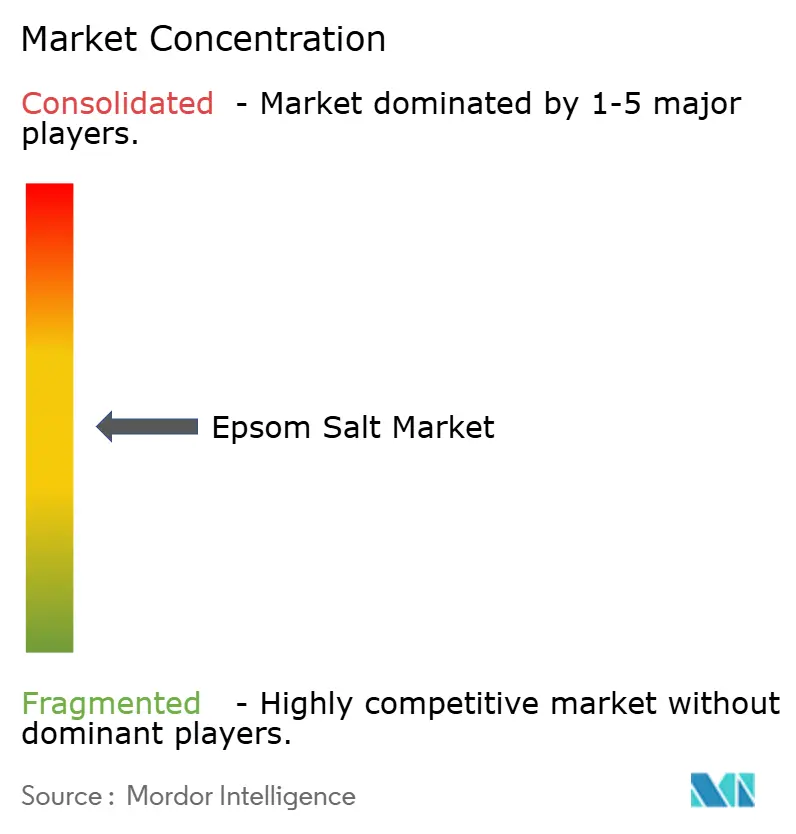
| Market Concentration | Medium |
Major Players
*Disclaimer: Major Players sorted in no particular order Image © Mordor Intelligence. Reuse requires attribution under CC BY 4.0. |
|
Epsom Salt Market Analysis by Mordor Intelligence
The epsom salt market size is expected to grow from USD 2.67 billion in 2025 to USD 2.82 billion in 2026 and is forecast to reach USD 4.39 billion by 2031 at 9.26% CAGR over 2026-2031. Structural demand is expanding as magnesium sulfate shifts from a basic bath additive to a multi-application ingredient in pharmaceuticals, functional foods, precision agriculture, and sports recovery products. Pharmaceutical approvals for injectable and oral formats are lifting high-grade volumes, while functional-beverage brands and plant-based dairy makers drive food-grade uptake. Rising consumer wellness spending in North America and Europe supports premium personal-care lines, and investments in micronization and recrystallization technologies improve dissolution rates for sports nutrition and medical uses. Asia-Pacific’s manufacturing cost advantage underpins exports, yet buyers in high-purity segments increasingly favor ISO-certified suppliers to control heavy-metal risks.
Key Report Takeaways
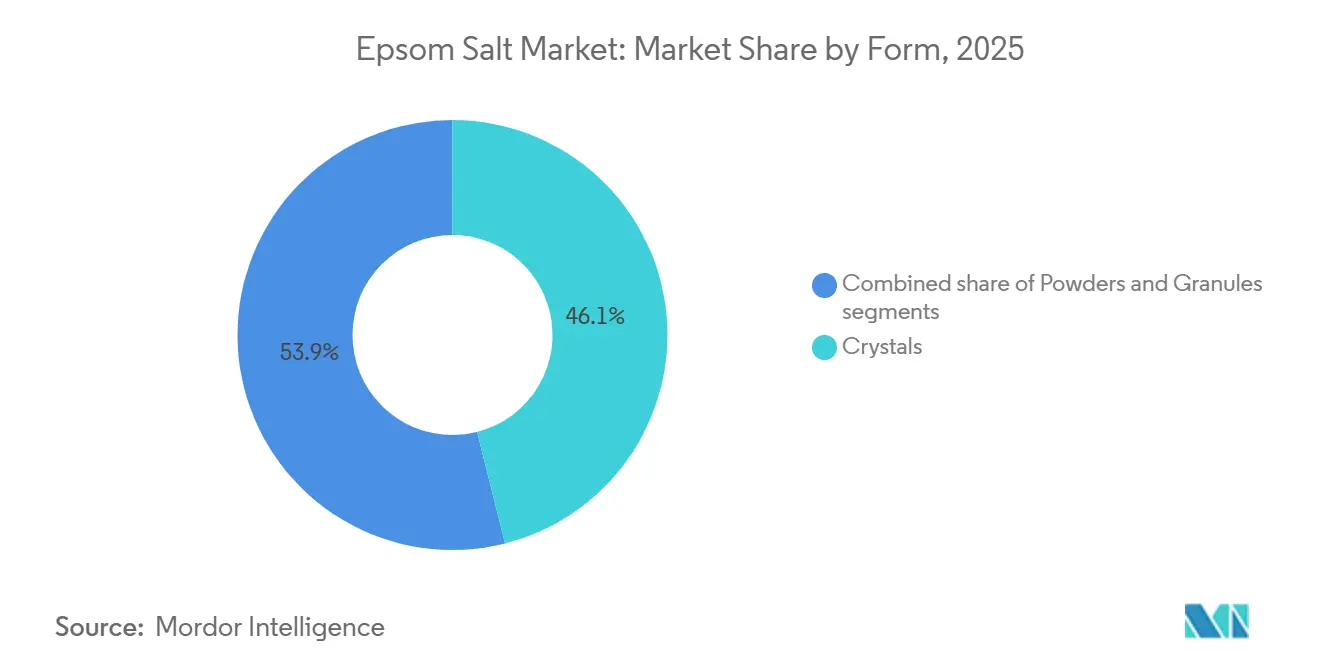
- By form, crystals led with 46.07% of the Epsom salt market share in 2025, while powders are projected to record a 9.57% CAGR through 2031.
- By grade, pharmaceutical products accounted for 48.95% share of the Epsom salt market size in 2025, while food grade products are projected to record a 9.38% CAGR through 2031.
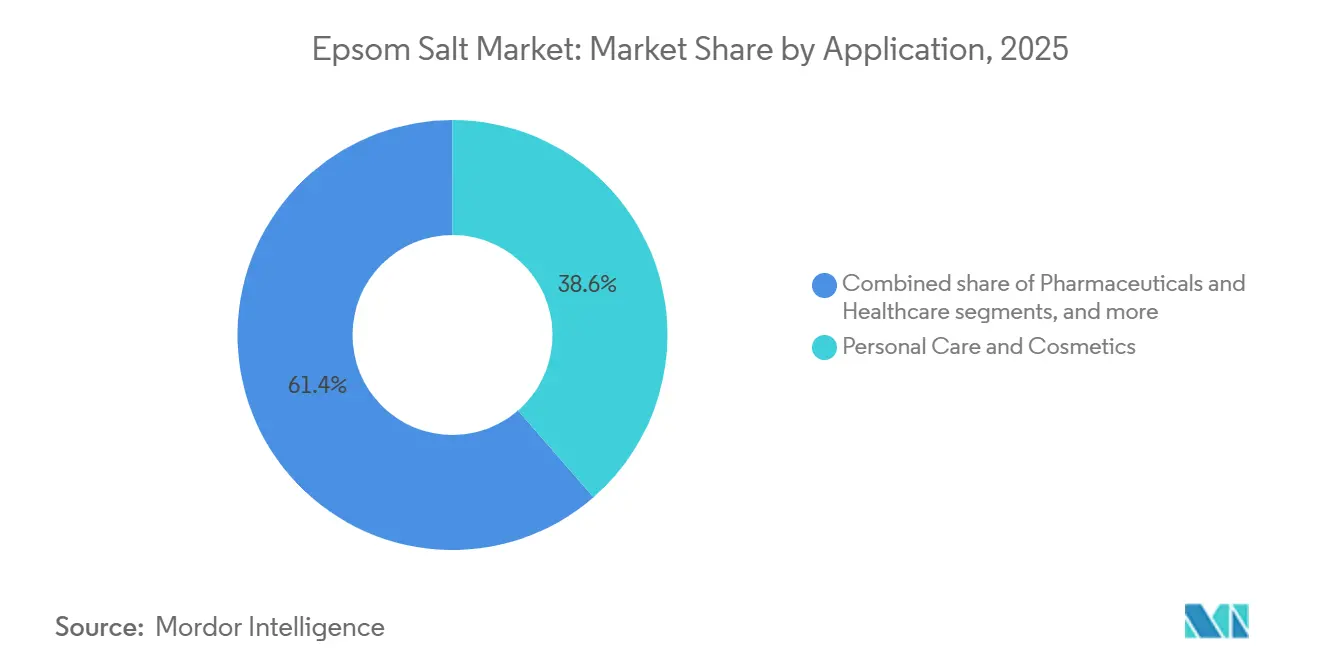
- By application, pharmaceuticals and healthcare are advancing at a 9.61% CAGR to 2031, outpacing personal care’s 38.61% 2025 revenue share.
- By geography, Asia-Pacific generated 34.24% of 2025 revenue, whereas North America is forecast to expand fastest at a 6.78% CAGR through 2031.
Note: Market size and forecast figures in this report are generated using Mordor Intelligence’s proprietary estimation framework, updated with the latest available data and insights as of January 2026.
Global Epsom Salt Market Trends and Insights
Drivers Impact Analysis*
| Driver | (~) % Impact on CAGR Forecast | Geographic Relevance | Impact Timeline |
|---|---|---|---|
| Rising use of Epsom salt in personal care and wellness products | +1.8% | Global, with concentration in North America and Europe | Medium term (2-4 years) |
| Increasing consumer interest in therapeutic bath and relaxation products | +1.5% | North America, Europe, urban Asia-Pacific | Short term (≤ 2 years) |
| Expanding use in pharmaceutical and healthcare applications | +2.1% | Global, led by North America and Europe | Long term (≥ 4 years) |
| Rising incorporation of epsom salt in sports nutrition and recovery solutions | +1.2% | North America, Europe, Australia | Medium term (2-4 years) |
| Growing demand from agriculture as a magnesium-rich soil nutrient | +1.6% | Asia-Pacific core, South America, North America | Long term (≥ 4 years) |
| Rise of mineral-fortified functional foods and beverages | +1.0% | North America, Europe | Medium term (2-4 years) |
| Source: Mordor Intelligence | |||
Rising use of Epsom salt in personal care and wellness products
Rising use of Epsom salt in personal care and wellness products is significantly supporting the growth of the global Epsom salt market. Consumers are increasingly incorporating Epsom salt into bath soaks, muscle relaxation therapies, skincare products, foot care treatments, and aromatherapy routines due to its perceived therapeutic and stress-relief benefits. The growing popularity of home-based wellness practices and self-care routines is further increasing product demand across personal care applications. In addition, pharmaceutical-grade magnesium sulfate is witnessing accelerated adoption as regulatory approvals continue to expand clinical applications beyond traditional obstetric use. For instance, the U.S. FDA approved Avenacy Magnesium Sulfate in Water for Injection in May 2024 to address supply-chain vulnerabilities for intravenous formulations used in eclampsia prophylaxis and torsades de pointes arrhythmia management. Furthermore, Camber Pharmaceuticals received approval for an oral laxative magnesium sulfate formulation in April 2025, expanding over-the-counter magnesium sulfate delivery formats[1]Source: U.S. Food & Drug Administration, “How FDA is Implementing Landmark Cosmetics Legislation to Positively Impact Public Health”, fda.gov. These developments are strengthening consumer confidence and broadening healthcare and wellness applications of Epsom salt products.
Increasing consumer interest in therapeutic bath and relaxation products
Increasing consumer interest in therapeutic bath and relaxation products is significantly contributing to the growth of the Epsom salt market. Consumers are increasingly adopting wellness-oriented routines that focus on stress relief, muscle relaxation, and mental well-being, particularly through at-home spa experiences. Epsom salt is widely used in bath soaks due to its perceived ability to ease muscle soreness, reduce fatigue, and promote relaxation after physical activity or long work hours. The rising popularity of aromatherapy and spa-inspired self-care practices is further strengthening product adoption across personal care applications. In addition, fitness-conscious individuals and athletes are increasingly using Epsom salt baths as part of post-workout recovery routines. Growing disposable incomes and changing lifestyle patterns are also encouraging consumers to invest in premium wellness and therapeutic products. Manufacturers are responding by offering scented, blended, and enhanced Epsom salt variants tailored for relaxation and stress relief.
Expanding use in pharmaceutical and healthcare applications
The growing integration of Epsom salt in pharmaceutical and healthcare applications is playing a key role in supporting market expansion. Magnesium sulfate is extensively used in medical treatments for correcting magnesium deficiencies, supporting electrolyte balance, and aiding muscle and nerve function. It is also applied in clinical care for conditions such as eclampsia management and certain cardiac complications under supervised administration. Increasing regulatory approvals for pharmaceutical-grade formulations are widening its acceptance across healthcare systems. Alongside this, oral and topical magnesium sulfate products are gaining popularity in over-the-counter healthcare and therapeutic wellness segments. Hospitals, rehabilitation centers, and clinics are increasingly incorporating Epsom salt-based treatments into recovery and pain management protocols. Rising focus on preventive healthcare and mineral-based supplementation is further enhancing its usage in medical applications.
Rising incorporation of epsom salt in sports nutrition and recovery solutions
Rising incorporation of Epsom salt in sports nutrition and recovery solutions is significantly supporting the growth of the global Epsom salt market. Athletes and fitness enthusiasts are increasingly using Epsom salt baths as part of post-exercise recovery routines due to its perceived benefits in reducing muscle soreness, inflammation, and fatigue. The magnesium content in Epsom salt is believed to aid muscle relaxation and support faster physical recovery after intense workouts or sports activities. Growing awareness of sports nutrition and performance recovery solutions is further encouraging its adoption in both professional and amateur athletic communities. According to the United States Bureau of Labor Statistics, 23.6% of men and 19.4% of women in the United States participated in sports, exercise, or recreational activities daily in 2024, highlighting a strong and active consumer base[2]Source: Bureau of Labor Statistics, "Time spent in primary activities and percent of the civilian population engaging in each activity, averages per day by sex, 2024 annual averages," bls.gov. This expanding participation in fitness and recreational activities is driving demand for recovery-oriented wellness products
Restraints Impact Analysis*
| Restraint | (~) % Impact on CAGR Forecast | Geographic Relevance | Impact Timeline |
|---|---|---|---|
| Availability of low-cost substitutes in bath and wellness products | -0.9% | Global, particularly in price-sensitive consumer segments | Short term (≤ 2 years) |
| Limited awareness in developing markets | -0.7% | Africa, Southeast Asia, SouthAmerica | Medium term (2-4 years) |
| Fluctuations in raw material and mining costs | -0.8% | Global, with acute impact in import-dependent regions | Short term (≤ 2 years) |
| Strict regulations in pharmaceutical-grade applications | -0.6% | North America, Europe, Japan | Long term (≥ 4 years) |
| Source: Mordor Intelligence | |||
Availability of low-cost substitutes in bath and wellness products
Availability of low-cost substitutes in bath and wellness products is acting as a limiting factor for the growth of the Epsom salt market. Consumers have access to a wide range of alternative products such as bath salts made from sea salt, Himalayan salt, essential oil blends, and synthetic relaxation formulations that often compete directly with Epsom salt. These substitutes are widely available across retail, pharmacies, and online platforms, often at more competitive price points. In addition, many alternative bath products offer added fragrances, skincare benefits, or herbal infusions, making them more appealing to certain consumer segments. The increasing popularity of DIY wellness products also enables consumers to create homemade bath solutions using easily accessible and inexpensive ingredients. Price-sensitive consumers, particularly in emerging markets, often opt for these alternatives due to affordability considerations. The strong presence of substitute wellness products in both mass and premium categories continues to create competitive pressure.
Limited awareness in developing markets
Limited awareness in developing markets is restraining the wider growth of the Epsom salt market. In many emerging economies, consumers have relatively low knowledge regarding the therapeutic, medicinal, and wellness benefits of magnesium sulfate. Epsom salt is often underutilized compared to more commonly known traditional remedies or locally available alternatives for pain relief and personal care. In addition, inadequate marketing penetration and limited product education campaigns restrict consumer understanding of its applications in skincare, relaxation, and agricultural use. Distribution challenges and weaker retail infrastructure in rural areas further limit product visibility and availability. Price sensitivity in developing regions also discourages trial and repeat purchases of non-essential wellness products. Lack of awareness among healthcare professionals and farmers about its broader benefits also contributes to slower adoption rates.
*Our forecasts treat driver/restraint impacts as directional, not additive. The impact forecasts reflect baseline growth, mix effects, and variable interactions.
Segment Analysis
By Form: Powders Gain Share Through Dissolution Advantages
Crystal form accounted for the largest share of the global Epsom salt market in 2025, contributing 46.07% of total revenue. The dominance of this segment is primarily attributed to its widespread use in personal care, wellness, therapeutic bathing, and household applications. Crystal Epsom salt is highly preferred by consumers due to its ease of dissolution in water and suitability for bath soaks, muscle relaxation, and stress relief treatments. The segment also benefits from strong demand across spas, wellness centers, salons, and home-based self-care routines. In addition, crystal formulations are commonly used in gardening and agriculture applications as a magnesium supplement for plants and soil enhancement. Manufacturers widely market crystal Epsom salt products through supermarkets, pharmacies, specialty wellness stores, and online retail platforms.
Powdered Epsom salt is projected to register the fastest CAGR of 9.57% through 2031. Growth of this segment is primarily supported by increasing usage across pharmaceutical, cosmetic, and personal care product formulations. Powdered Epsom salt offers advantages such as easy blending, precise formulation compatibility, and faster absorption in certain industrial and cosmetic applications. Manufacturers are increasingly incorporating powdered variants into skincare products, exfoliants, foot care solutions, and therapeutic wellness formulations. Rising consumer preference for customized wellness products and DIY beauty treatments is also contributing to higher demand for powder-based Epsom salt products. In addition, the pharmaceutical industry utilizes powdered magnesium sulfate in selected medicinal and healthcare applications, further supporting segment expansion.


By Grade: Food-Grade Expands as Functional Fortification Accelerates
Pharmaceutical-grade Epsom salt accounted for the largest share of the market in 2025, representing 48.95% of total revenue. The strong market position of this segment is primarily driven by extensive usage in healthcare, therapeutic, personal care, and wellness applications. Pharmaceutical-grade Epsom salt is widely utilized in bath salts, muscle relaxation treatments, detoxification therapies, foot care products, and selected medicinal formulations due to its high purity standards. Increasing consumer preference for wellness-oriented products and home-based therapeutic treatments is further supporting demand for premium pharmaceutical-grade variants. In addition, hospitals, pharmacies, spas, and cosmetic manufacturers continue to rely on pharmaceutical-grade magnesium sulfate for high-quality product formulations.
In contrast, food grade products are projected to record a 9.38% CAGR through 2031. Food-grade Epsom salt is witnessing steady demand growth due to its increasing application in food processing, brewing, and mineral fortification applications. The segment benefits from rising usage of magnesium sulfate as a processing aid and nutrient source in selected food and beverage formulations, particularly in regulated industrial applications requiring high-purity standards. In the beverage industry, food-grade Epsom salt is also utilized in brewing processes to support mineral balance and improve fermentation quality. Growing focus on food safety compliance and ingredient quality standards is further encouraging manufacturers to adopt certified food-grade magnesium sulfate products across industrial food applications.
By Application: Pharmaceuticals and Healthcare Outpace Personal Care
Personal care accounted for the largest share of the epsum salt market in 2025, contributing 38.61% of total revenue. The strong dominance of this segment is primarily driven by increasing consumer preference for wellness, relaxation, and home-based self-care treatments. Epsom salt is widely used in bath soaks, exfoliating scrubs, foot care products, muscle relaxation therapies, and spa treatments due to its magnesium sulfate content and perceived therapeutic benefits. The growing popularity of stress-relief routines and at-home spa experiences is further supporting strong product demand across developed and emerging markets. Cosmetic and skincare manufacturers are increasingly incorporating epsom salt into premium personal care formulations to enhance product differentiation and wellness positioning.
Pharmaceuticals and healthcare are projected to register the fastest CAGR of 9.61% through 2031 in the Epsom salt market. Growth in this segment is primarily supported by increasing medical and therapeutic applications of magnesium sulfate across healthcare settings. Pharmaceutical-grade Epsom salt is widely utilized in medicinal formulations, detoxification therapies, muscle recovery treatments, and selected clinical applications requiring high-purity magnesium compounds. Rising consumer awareness regarding magnesium deficiency and wellness-related health conditions is also contributing to stronger demand for healthcare-oriented Epsom salt products. In addition, hospitals, rehabilitation centers, physiotherapy clinics, and wellness institutions are increasingly incorporating magnesium sulfate-based treatments into patient care and therapeutic programs.
Geography Analysis
Asia-Pacific accounted for the largest share of the global Epsom salt market in 2025, contributing 34.24% of total revenue. The region’s dominance is primarily supported by strong demand from agriculture, personal care, pharmaceutical, and industrial sectors across countries such as China, India, Japan, and South Korea. Rapid urbanization, expanding middle-class populations, and rising consumer awareness regarding wellness and self-care products are significantly increasing UN Habitat reported that by 2025, the Asia-Pacific region was home to over 2.2 billion people, accounting for over 54% of the global urban populace. Projections indicated that by 2050, this urban demographic would swell by another 50%, translating to an influx of 1.2 billion individuals[3]Source: UN-Habitat, “Asia and the Pacific Region”, unhabitat.org. Epsom salt consumption in the region. In agriculture, Epsom salt is widely utilized as a magnesium supplement to improve crop yield and soil quality, particularly in large-scale farming economies. The region also benefits from expanding manufacturing activities and cost-effective production capabilities, which support broader market availability and export potential.
North America is projected to register the fastest CAGR of 6.78% through 2031 in the Epsom salt market. Growth in the region is primarily driven by increasing consumer preference for wellness-oriented products, therapeutic bathing solutions, and home-based self-care treatments. Consumers in the United States and Canada are increasingly adopting Epsom salt products for stress relief, muscle recovery, skincare, and relaxation applications. The region is also witnessing strong demand from pharmaceutical and healthcare sectors due to rising awareness regarding magnesium deficiency and preventive wellness practices. In addition, growing popularity of fitness culture, sports recovery treatments, and natural personal care products is accelerating product adoption across multiple consumer groups. Manufacturers are actively expanding premium and scented Epsom salt product portfolios to cater to evolving consumer preferences in developed markets.
Europe represents a significant market for Epsom salt due to growing consumer interest in organic wellness products, therapeutic treatments, and natural skincare formulations. Countries such as Germany, the United Kingdom, France, and Italy are witnessing increasing demand for pharmaceutical-grade and personal care-oriented Epsom salt products. South America is gradually emerging as a developing market supported by expanding agricultural activities and rising adoption of magnesium sulfate fertilizers for crop enhancement. In the Middle East and Africa, market growth is being supported by increasing urbanization, improving retail infrastructure, and growing awareness regarding wellness and personal care products. Demand across these regions is also influenced by the expansion of spa, hospitality, and beauty industries utilizing Epsom salt in therapeutic and cosmetic applications.

Competitive Landscape
The Epsom salt market is moderately fragmented, with the presence of multinational chemical companies, specialty mineral product manufacturers, wellness brands, and regional suppliers competing across diverse application areas. Market participants primarily compete on product purity, pricing, packaging formats, brand positioning, and distribution capabilities. Leading companies maintain strong market positions through broad product portfolios covering pharmaceutical, personal care, agricultural, food-grade, and industrial applications. The market also includes numerous regional and private-label manufacturers supplying epsom salt products through pharmacies, supermarkets, wellness retailers, and online channels.
Manufacturers operating in the Epsom salt market are increasingly focusing on product innovation, strategic partnerships, and geographic expansion initiatives to strengthen their competitive positioning. Companies are launching scented bath salts, aromatherapy blends, therapeutic formulations, and organic wellness products to target evolving consumer preferences in the personal care segment. In addition, manufacturers are investing in sustainable packaging solutions and environmentally responsible sourcing practices to align with rising sustainability expectations. Pharmaceutical and healthcare-focused companies are emphasizing compliance with strict purity standards and regulatory certifications to strengthen consumer trust and commercial adoption.
E-commerce expansion and direct-to-consumer sales strategies are also becoming increasingly important as online wellness product demand continues to rise globally. Companies are further leveraging digital marketing campaigns, influencer collaborations, and wellness branding strategies to enhance product visibility and customer engagement. Continuous investments in manufacturing efficiency and supply chain optimization remain important competitive factors across the industry.
Epsom Salt Industry Leaders
-
America's Sea Salt Company
-
Premier Magnesia (Giles Chemical)
-
PQ Corporation
-
Compass Minerals International
-
Laizhou Guangcheng Chemical
- *Disclaimer: Major Players sorted in no particular order

Recent Industry Developments
- May 2025: Compass Minerals achieved a 39% increase in salt product revenues by actively reducing inventory levels and enhancing production efficiency, demonstrating effective operational strategies.
- January 2025: EFSA actively approved a mineral salt containing potassium and magnesium as a novel food, allowing its use as a partial replacement for sodium chloride in food products, which could contribute to healthier dietary options.
- January 2024: White Egret expanded its pharmaceutical-grade Epsom salt portfolio with the launch of two new products, Recovery Epsom Salt and Skin Therapy Epsom Salt, targeting the growing wellness and therapeutic personal care segment. The Recovery variant is formulated with organic peppermint and eucalyptus essential oils to support muscle recovery, relaxation, and post-workout care, while the Skin Therapy variant incorporates coconut oil and lime essential oil for skincare and stress-relief applications.


Global Epsom Salt Market Report Scope
Epsom salt is a naturally occurring mineral compound composed of magnesium, sulfur, and oxygen, chemically known as magnesium sulfate. The epsom salt market is segmented by form, grade, application and geography. By form, the market is segmented into crystals, granules and powders. By grade, the market is segmented into pharmaceutical and food grade. By application, the market is segmented into personal care and cosmetics, pharmaceuticals and healthcare, food and beverage and animal feed and nutrition. By geography, the market is segmented into North America, Europe, Asia-Pacific, South America, and Middle-East and Africa. For each segment, the market sizing and forecasting have been done in value terms (USD million).
| Crystals |
| Granules |
| Powders |
| Pharmaceutical |
| Food |
| Personal Care and Cosmetics |
| Pharmaceuticals and Healthcare |
| Food and Beverage |
| Animal Feed and Nutrition |
| North America | United States |
| Canada | |
| Mexico | |
| Rest of North America | |
| Europe | Germany |
| France | |
| United Kingdom | |
| Spain | |
| Italy | |
| Russia | |
| Rest of Europe | |
| Asia-Pacific | China |
| India | |
| Japan | |
| Australia | |
| Thailand | |
| Rest of Asia-Pacific | |
| South America | Brazil |
| Argentina | |
| Rest of South America | |
| Middle East and Africa | United Arab Emirates |
| South Africa | |
| Rest of Middle East and Africa |
| By Form | Crystals | |
| Granules | ||
| Powders | ||
| By Grade | Pharmaceutical | |
| Food | ||
| By Application | Personal Care and Cosmetics | |
| Pharmaceuticals and Healthcare | ||
| Food and Beverage | ||
| Animal Feed and Nutrition | ||
| By Geography | North America | United States |
| Canada | ||
| Mexico | ||
| Rest of North America | ||
| Europe | Germany | |
| France | ||
| United Kingdom | ||
| Spain | ||
| Italy | ||
| Russia | ||
| Rest of Europe | ||
| Asia-Pacific | China | |
| India | ||
| Japan | ||
| Australia | ||
| Thailand | ||
| Rest of Asia-Pacific | ||
| South America | Brazil | |
| Argentina | ||
| Rest of South America | ||
| Middle East and Africa | United Arab Emirates | |
| South Africa | ||
| Rest of Middle East and Africa | ||


Key Questions Answered in the Report
What is the current value of the Epsom salt market and how fast is it growing?
The Epsom salt market size reached USD 2.82 billion in 2026 and is forecast to advance at a 9.26% CAGR to USD 4.39 billion by 2031.
Which region is expected to expand the quickest?
North America is projected to grow fastest at a 6.78% CAGR through 2031, supported by pharmaceutical-grade investments and higher consumer wellness spending.
Which application segment is seeing the highest growth momentum?
Pharmaceuticals and healthcare are forecast to post the strongest 9.61% CAGR as FDA approvals broaden clinical use cases.
How large is the crystals segment compared with powders?
Crystals led with 46.07% of Epsom salt market share in 2025, while powders are gaining traction at a 9.57% CAGR on the back of sports nutrition and injectable demand.
Page last updated on:


