
Vacuum Interrupter Market Size and Share
Market Overview
| Study Period | 2020 - 2031 |
|---|---|
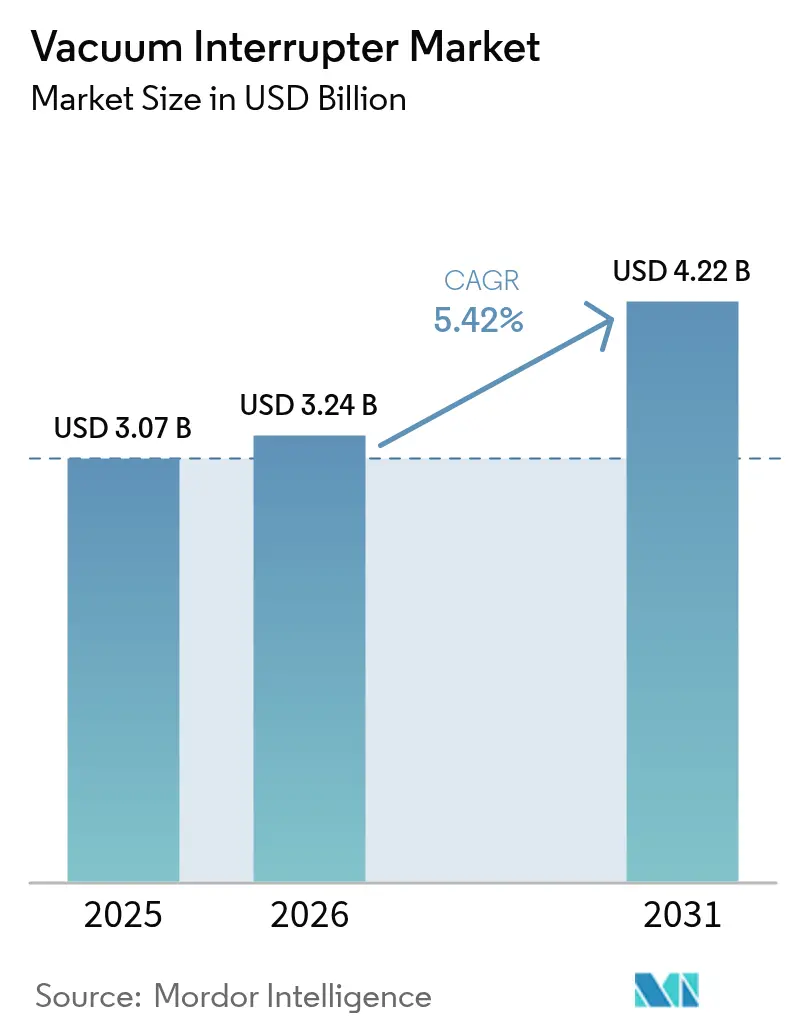
| Market Size (2026) | USD 3.24 Billion |
| Market Size (2031) | USD 4.22 Billion |
| Growth Rate (2026 - 2031) | 5.42 % |
| Fastest Growing Market | Asia Pacific |
| Largest Market | Asia Pacific |
| Market Concentration | Medium |
Major Players *Disclaimer: Major Players sorted in no particular order Image © Mordor Intelligence. Reuse requires attribution under CC BY 4.0. | |
Vacuum Interrupter Market Analysis by Mordor Intelligence
Vacuum interrupter market size in 2026 is estimated at USD 3.24 billion, growing from 2025 value of USD 3.07 billion with 2031 projections showing USD 4.22 billion, growing at 5.42% CAGR over 2026-2031. This trajectory reflects utilities’ preference for maintenance-free medium-voltage switchgear, the push to modernize transmission and distribution grids, and the rapid electrification of railways and data-center campuses. Demand also benefits from tighter regulations on sulfur-hexafluoride (SF6) and the superior arc-extinction performance that underpins rising deployments in smart grid applications. Asia-Pacific remains the primary growth engine, yet North America and Europe provide a steady replacement market for legacy oil-filled gear. Competition is intensifying as manufacturers race to commercialize SF6-free high-voltage solutions and to localize production in India and the Middle East, but solid-state breakers remain in the pilot phase.
Key Report Takeaways
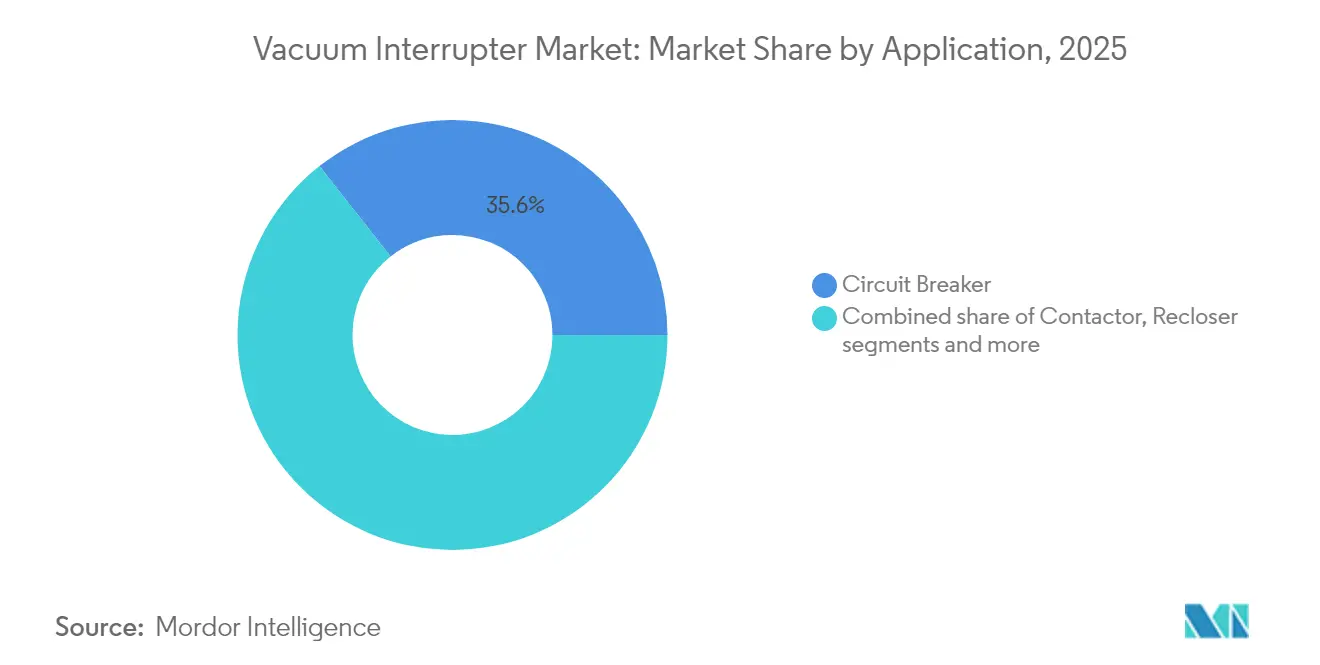
- By application, circuit breakers led with 35.62% revenue share in 2025, while reclosers recorded the highest projected CAGR at 5.72% through 2031.
- By voltage class, the 15.1–27 kV segment held 47.65% of the vacuum interrupter market share in 2025; above 38 kV applications are set to expand at a 6.21% CAGR.
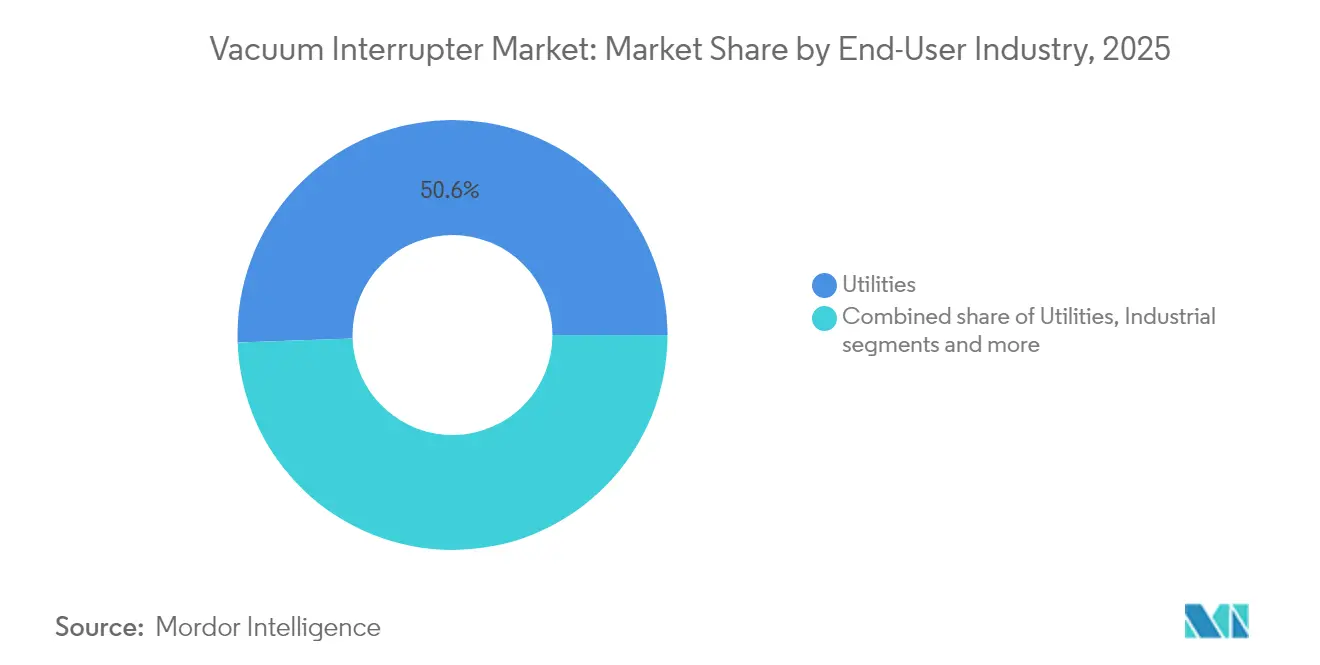
- By end-user industry, utilities captured 50.55% of the vacuum interrupter market size in 2025, yet renewables and independent power producers are advancing at a 5.94% CAGR to 2031.
- By installation type, indoor switchgear accounted for a 54.75% slice of the vacuum interrupter market size in 2025, while outdoor pole-mounted units are gaining at a 6.55% CAGR.
- By geography, Asia-Pacific commanded 41.05% of 2025 revenues and is outpacing all regions with a 5.88% CAGR through 2031.
Note: Market size and forecast figures in this report are generated using Mordor Intelligence’s proprietary estimation framework, updated with the latest available data and insights as of 2026.
Global Vacuum Interrupter Market Trends and Insights
Drivers Impact Analysis*
| Driver | (~) % Impact on CAGR Forecast | Geographic Relevance | Impact Timeline |
|---|---|---|---|
| Smart-grid rollout and MV switchgear demand | +1.8% | Global, strongest in North America, Europe, Asia-Pacific | Medium term (2-4 years) |
| Aging T&D infrastructure replacements | +1.5% | North America, Europe, mature APAC markets | Long term (≥ 4 years) |
| Rapid expansion of data-center power networks | +1.2% | Global, with North America and Europe in the lead | Short term (≤ 2 years) |
| Electrification of railway feeders in Asia | +0.8% | China, India, ASEAN | Medium term (2-4 years) |
| Shift to SF6-free eco-designs by utilities | +0.6% | Europe, North America initially | Long term (≥ 4 years) |
| Localization mandates in India and MENA | +0.4% | India, Middle East & North Africa | Medium term (2-4 years) |
| Source: Mordor Intelligence | |||


Smart-grid rollout and MV switchgear demand
Proliferating distributed energy resources require switchgear that supports frequent on-load operations and instantaneous fault isolation. Utilities in the United States and Western Europe, therefore, prioritize vacuum interrupter-based switchgear for advanced feeder automation, driving a meaningful share of incremental orders in the vacuum interrupter market. Adoption accelerates where regulators link performance incentives to outage duration, and where federal stimulus packages finance grid resilience. Digital sensors embedded in modern interrupters provide utilities with the operational visibility needed for self-healing networks, while the maintenance-free vacuum device design trims lifecycle costs. These benefits collectively underpin a visible order pipeline that extends through 2028, particularly for 15 kV–27 kV feeder classes.
Aging T&D infrastructure replacements
North American and European utilities face equipment fleets averaging more than four decades, turning asset-management programs into sizable procurement funnels for the vacuum interrupter market. Operators retiring oil-filled or SF6-based breakers now specify vacuum devices to limit greenhouse-gas exposure and to reduce service truck rolls. Deferred maintenance backlogs compound the replacement cycle, and multiyear capital-expenditure plans already in execution point to stable retrofit volumes that stretch well beyond 2030. Higher-voltage multi-break designs are making inroads into 72 kV and 145 kV substations, boosting average selling prices and lifting the value mix toward premium contact-material alloys.
Rapid expansion of data-center power networks
Hyperscale operators building AI-optimized campuses can draw 200 MW to 400 MW per site and frequently reconfigure electrical loads. Vacuum interrupters enable the requisite high-duty switching with minimal contact erosion, a core reason why the segment is expanding roughly three times faster than general-industry demand in the vacuum interrupter market. Compact footprints suit double-stacked IT vaults, while remote-monitoring interfaces mesh with facility-management software. The steep growth curve in Europe’s FLAP-D corridor and the United States’ Midwest and Mountain regions signals sustained orders for at least the next five years.
Electrification of railway feeders in Asia
China’s 50 Hz, 27.5 kV single-phase traction networks and India’s 25 kV AC main-line corridors both require rugged interrupters that withstand repetitive load cycles and airborne dust. As route mileage under catenary expands, purpose-built pole-mounted breakers extend feeder-section reach, giving the vacuum interrupter market fresh volume streams[1]Hitachi Energy press office, “EconiQ SF6-Free Breaker Milestone,” hitachienergy.com. National plans to take another 17,000 km of Indian track under electrification by 2029 will keep demand elevated, and similar green-field trunk lines across ASEAN support the medium-term outlook.
Restraints Impact Analysis*
| Restraint | (~) % Impact on CAGR Forecast | Geographic Relevance | Impact Timeline |
|---|---|---|---|
| High unit cost at above 40 kV ratings | -0.9% | Global, especially in cost-sensitive emerging markets | Medium term (2-4 years) |
| Substitution threat from solid-state breakers | -0.7% | Early adoption in OECD countries | Long term (≥ 4 years) |
| IP issues on contact-material alloys | -0.4% | Global | Short term (≤ 2 years) |
| Supply-chain fragility of ceramic envelopes | -0.3% | Asia-Pacific fabrication hubs | Short term (≤ 2 years) |
| Source: Mordor Intelligence | |||
High unit cost at above 40 kV ratings
Above 40 kV, designs require multiple interruption gaps and sophisticated voltage-grading capacitors, which push capital cost to two-to-three times that of single-break formats. Utilities in Latin America and Africa—regions still price-sensitive—therefore stick with conventional air-insulated gear, muting volume growth for the high-voltage slice of the vacuum interrupter market. Although manufacturers pursue economies of scale at new Asian plants, significant price parity may not arrive before 2029, keeping this restraint in play through the forecast horizon.
Substitution threat from solid-state breakers
Startup advances in bilateral transistor (B-TRAN) devices promise sub-microsecond interruption and zero mechanical wear. Pilot installations at a leading Asian switchgear OEM show feasibility in 15 kV rack-mounted panels, and management targets a USD 1 billion serviceable niche within a decade[2]Ideal Power investor update, “B-TRAN Design Win Announcement,” idealpower.com. For now, power-loss penalties and component cost slow uptake, but if silicon-carbide wafer pricing declines as expected, the vacuum interrupter market could face sharper competition in renewables-rich microgrids and data-center switchboards.
*Our forecasts treat driver/restraint impacts as directional, not additive. The impact forecasts reflect baseline growth, mix effects, and variable interactions.
Segment Analysis
By Application: Circuit Breakers Anchor Volumes as Reclosers Accelerate
Circuit breakers constitute the largest slice of the vacuum interrupter market size, retaining 35.62% of 2025 revenues. The category serves primary distribution substations where utilities value long electrical life and low maintenance cycles. Growth, however, tilts toward reclosers, which post a 5.72% CAGR through 2031 as distribution automation spreads. Utilities deploy reclosers on lateral feeders with rooftop solar and electric-vehicle loading, where rapid fault isolation and auto-reenergization boost reliability indices. Advanced microprocessor controls now allow multiple-shot profiles adapted to inverter-based resources, securing vacuum devices as the preferred arc-quenching core. Contactors and load-break switches deliver steady industrial demand, chiefly from motor control centers and capacitor-bank switching in cement, metals, and oil-refining complexes. These niches add resilience to the overall vacuum interrupter market because their order cycles correlate with general industrial capital expenditure.
The high duty cycle inherent to recloser operation underscores the superiority of vacuum contacts versus oil or SF6 puffer mechanisms, whose mechanical linkages degrade under repetitive trips. Field data from US Midwest utilities show maintenance call-outs per recloser dropping by 60% after migration to vacuum designs, directly lowering operating expenditure. That demonstrable cost advantage underpins vendor order books and propels software-enabled feeder automation solutions bundled with vacuum interrupter cores. As a result, the vacuum interrupter market continues to capture incremental feeder retrofit budgets even where overall capital plans remain flat.


By Voltage Class: Above-38 kV Installations Gain Pace
The 15.1 kV–27 kV bracket remains the workhorse, commanding 47.65% of 2025 revenues. Distribution-level feeders and industrial campuses typically fall in this range, and utilities prefer standardized footprints for quick truck roll replacements. Nevertheless, the above-38 kV segment is the fastest climber at a 6.21% CAGR, buoyed by renewable-rich transmission corridors. Multi-break 72 kV and 145 kV prototypes have proven dielectric strength in European climate chambers, and a 252 kV platform recently passed short-circuit tests at KEMA Laboratories, widening market scope. Where regional grid codes now ban new SF6 gas gear in 145 kV rings starting 2031, network owners pivot early to vacuum alternatives, inflating the premium end of the vacuum interrupter market.
Voltage scaling depends on refined CuCr50 contact alloys that resist high-energy arcing; patent filings suggest nanocrystalline microstructures cut cathode erosion by 35% compared with conventional formulations. Suppliers owning these alloys enjoy pricing power, further skewing revenue toward high-voltage SKUs. Meanwhile, the sub-15 kV slice caters to panel builders for commercial buildings and rooftop solar farms, a segment with shorter sales cycles that cushions cyclical swings in utility capital budgets. Overall, diverse voltage demand maintains a balanced growth profile across the vacuum interrupter market.
By End-User Industry: Renewables Outpace the Utility Core
Utilities still dominate spending, holding 50.55% in 2025, but independent power producers and renewable developers show the steepest trajectory at 5.94% CAGR. Solar-plus-storage parks and onshore wind clusters rely on vacuum interrupters to manage bidirectional flows and frequent connection cycling. Inverters now incorporate grid-forming capabilities, driving higher breaker operation counts and making mechanical endurance a purchase-selection criterion that vacuum technology meets comfortably. The mining, metals, and petrochemical verticals provide a stable baseline volume, as process electrification projects seek reliable interruption for large-horsepower drives. Commercial campuses and hyperscale data centers, meanwhile, scale their purchasing via long-term equipment master agreements, adding lumpiness—but also sizable blocks—to the vacuum interrupter market.
Developers in Spain and Australia report 5–7 switching events per day on breaker strings tied to battery-energy-storage systems; oil-filled devices rarely survive such cycling without mid-life overhauls. Vacuum contacts, conversely, carry a 30,000 mechanical operations rating, lowering the total cost of ownership. Such field evidence sustains procurement momentum even as tariffs on imported switchgear fluctuate. Hence, the vacuum interrupter industry benefits from the broader decarbonization push across multiple customer archetypes.
By Installation Type: Outdoor Gear Narrows the Gap
Indoor metal-clad switchgear held 54.75% of 2025 deployments, favored for enclosed environments such as utility substations, polished for urban real-estate constraints, or clean-room semiconductor fabs. Yet, outdoor pole-mounted units show a sharper 6.55% CAGR as rural electrification and railway feeders expand. Non-enclosed solid-insulated switchgear leverages silicone rubber and epoxy resins to withstand UV, salt fog, and seismic events; such robustness positions vacuum interrupters in feeder circuits that formerly used drop-out fuses. The trend also manifests in Africa’s mini-grid initiatives, where standalone pole-top reclosers and sectionalizers curtail outage scopes in sparsely populated districts.
Rail operators adopt compact outdoor cubicles integrating vacuum breakers for 25 kV autotransformer systems, avoiding costly brick-and-mortar houses near the right-of-way. Meanwhile, underground distribution in densely populated Asian megacities turns to vacuum interrupter modules designed for vaults flooded with diesel exhaust and moisture. Across these divergent site conditions, shared reliability requirements and lower maintenance burdens sustain market appeal, keeping the outdoor and indoor segments tightly linked in the vacuum interrupter market.
Geography Analysis
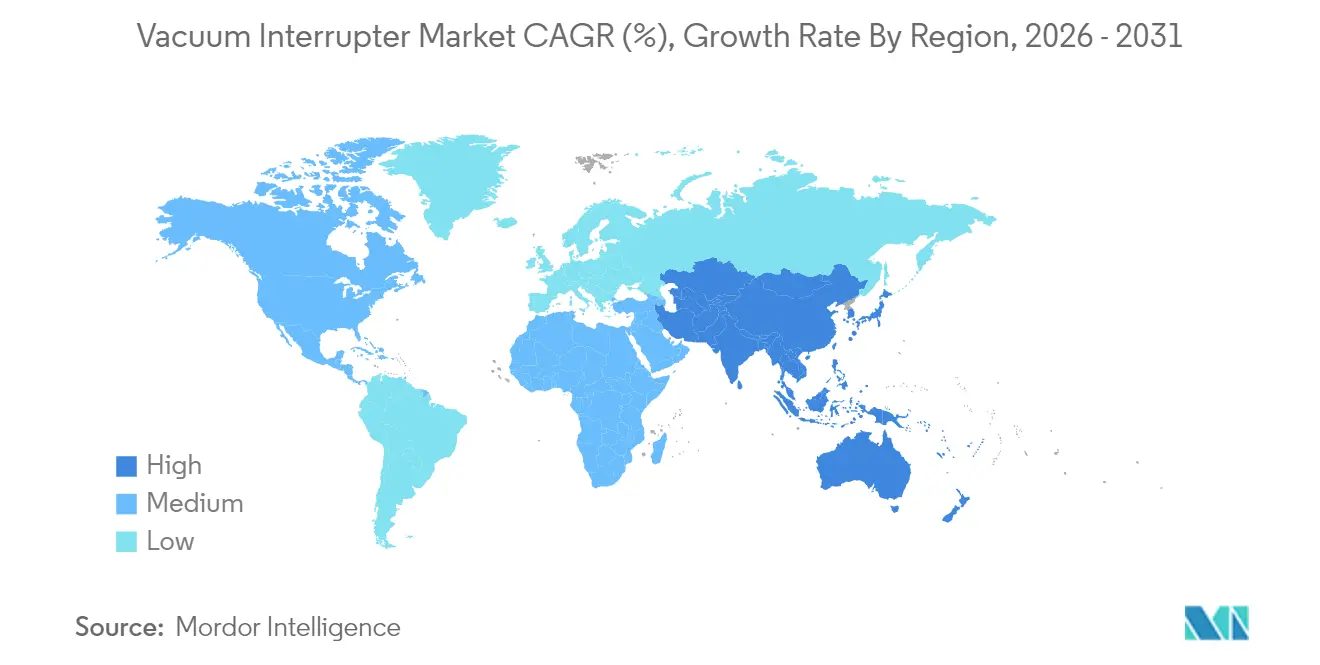
Asia-Pacific retained 41.05% of global revenue in 2025 and is expanding at 5.88% CAGR, benefiting from China’s internal grid reinforcement, India’s localization push, and Southeast Asia’s metro-rail build-outs. Government-backed manufacturing incentives cut procurement lead times for domestic utilities, enhancing the region’s self-sufficiency and undergirding regional demand. Localization is especially pronounced in India, where performance-linked incentive schemes reimburse up to 4% of ex-works value for indigenous switchgear, steering multinational suppliers toward joint ventures and licensing deals with local metal-clad panel fabricators.
North America shows steady replacement spending as equipment exceeding 40 years approaches the end of its life. Federal funding in the United States earmarks USD 13 billion for grid resilience, and parts of that allocation flow into medium-voltage breakers. Extreme-weather events in Texas, Louisiana, and California accelerate sectionalizer and recloser deployment, while hyperscale data-center clustering in Virginia and Ohio drives private capital spending. Consequently, the region preserves a healthy slice of the vacuum interrupter market despite lower headline growth.
Europe aligns policy with net-zero objectives, outlawing newly installed SF6 gear up to 24 kV from 2026 and above 52 kV from 2031, thereby mandating vacuum solutions for both distribution and transmission. Pilot installations at 420 kV prove technical feasibility, and multi-utility procurement consortia tender frameworks for million-euro contracts extending to 2029. South America and the Middle East, and Africa together account for a smaller base but deliver above-average percentage growth thanks to rural electrification, industrial diversification in the Gulf, and mining expansion in Chile and Peru. Each region’s demand profile relies on durable equipment that minimizes service visits, embedding long-life vacuum interrupters at the core of tender specifications.

Value Chain Analysis
The value chain starts with upstream inputs such as high-purity ceramic insulators and envelopes, CuCr contact materials, and precision metal components. Manufacturing then relies on controlled steps including ceramic-to-metal sealing, vacuum brazing, and type and routine testing. Quality and yield at the sealing and brazing stages feed directly into both cost and lead times, while IP around contact-alloy formulations and sealing processes tends to reinforce supplier dependence where process control is already proven.
On the demand side, vacuum interrupters are typically sold through OEM channels that integrate them into medium-voltage switchgear assemblies, including circuit breakers, reclosers, contactors, and load-break switches, for utilities, industrial plants, rail traction power, and commercial and data-center power networks. Incumbents with vertical integration in contact materials and captive sealing capacity can support higher-duty-cycle requirements, while the distribution tier increasingly bundles interrupter-based switchgear with digital monitoring and diagnostics. Utilities use these capabilities to support condition-based maintenance and feeder automation.
Competitive Landscape
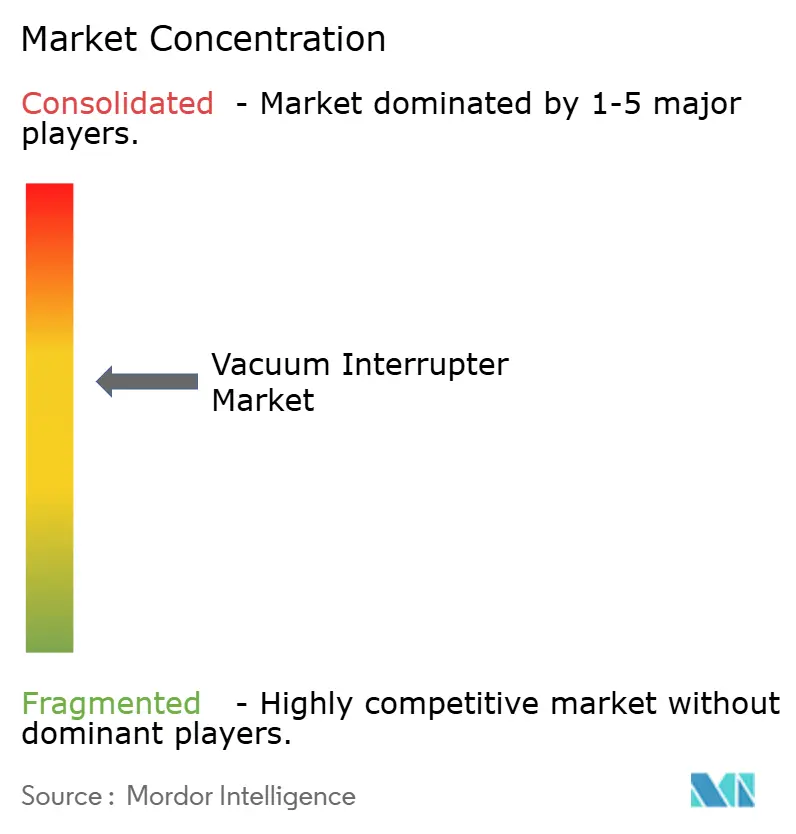
Established multinationals—ABB, Siemens Energy, Hitachi Energy, Mitsubishi Electric, Toshiba, and Schneider Electric—command technology leadership via vertically integrated contact-material production and global service networks. Combined, the top five control roughly 58% of 2024 revenues, giving the vacuum interrupter market a moderately concentrated structure. Major players pour capital into SF6-free product lines: Siemens invested EUR 100 million to upgrade its Frankfurt plant to manufacture blue-technology switchgear, while ABB’s USD 40 million Albuquerque facility focuses on fluoronitrile-filled panels destined for US grid-hardening projects. Hitachi Energy likewise earmarked USD 70 million for Pennsylvania capacity, adding a research and development lab to expedite material science breakthroughs.
Contact-material innovation is emerging as a primary differentiation lever. Research demonstrates that nanocrystalline CuCr50 powders elevate dielectric recovery by shortening arc-column collapse times, allowing higher interruption ratings without enlarging vacuum envelopes. Suppliers securing patents on these alloys command premium pricing and extend product life, particularly above 40 kV. Regional manufacturers in India and China strive to close the gap through technology-transfer licenses and government funding, yet remain largely focused on low- and mid-voltage ranges.
Solid-state circuit breakers represent the most visible disruptive threat. Ideal Power’s bilateral transistor modules passed type tests at a Tier-1 Asian OEM, aiming at the microgrid, marine, and high-speed rail traction segments. If manufacturing costs per ampere fall below USD 0.60 by 2028, analysts anticipate niche displacement within data-center UPS tie breakers. Incumbents mitigate risk by running parallel R&D on hybrid mechanical-solid-state architectures, but the broader vacuum interrupter market retains cost and energy-loss advantages that will likely hold in mainstream utility applications for most of the forecast window.
Vacuum Interrupter Industry Leaders
Eaton Corporation PLC
Meidensha Corporation
Mitsubishi Electric Corporation
Siemens AG
ABB Ltd
- *Disclaimer: Major Players sorted in no particular order

Market Opportunities and Future Outlook
SF6 phase-down and grid modernization programs are pushing vacuum technology into SF6-free switchgear roadmaps, creating whitespace around higher-voltage ratings, compact retrofits, and digitized condition monitoring. In Europe, decarbonization requirements in switchgear act as a tangible demand anchor for vacuum-based alternatives. In parallel, pilots and type-testing work for high-voltage vacuum platforms, including multi-break and hybrid approaches, are moving R&D into procurement pathways where utilities seek to add capacity within existing substation footprints.
Manufacturing localization and capacity additions also create room for new supply agreements with OEMs and panel builders, particularly when regional lead times and tariff risk constrain procurement. ABB’s announced USD 200 million, multi-country medium-voltage production investment program in Europe includes SF6-free switchgear and vacuum technology, and Schneider Electric Infrastructure Limited’s expanded capex plan for its Kolkata medium-voltage components facility is designed to raise vacuum interrupter output capacity. On the demand side, utility partnerships focused on SF6-free deployments, including Schneider Electric working with Southern California Edison on SF6-free gas-insulated switchgear using vacuum technology, point to near-term opportunities centered on brownfield upgrades rather than greenfield builds.
Recent Industry Developments
- June 2026: Schneider Electric partnered with Southern California Edison to deploy SF6-free gas-insulated switchgear using vacuum technology for grid modernization at existing substations in California. The focus is on faster capacity additions within existing substation footprints, which supports near-term procurement of vacuum-based interrupting components and accelerates utility validation of SF6-free architectures.
- October 2025: ABB announced a USD 200 million, multi-country medium-voltage production investment program in Europe that explicitly includes SF6-free switchgear and vacuum technology. The program expands regional manufacturing capacity and advances deployment of vacuum-based solutions across European substations.
- October 2024: Mitsubishi Electric Power Products, Inc. announced an USD 86 million investment in North America tied to advanced switchgear and power electronics, including a new manufacturing factory in Western Pennsylvania. The added manufacturing footprint and localization supports faster delivery cycles for switchgear platforms that incorporate vacuum interrupter technology and aligns with grid modernization-driven demand in the United States.


Research Methodology Framework and Report Scope
Market Definition and Coverage
For this study, the market counts revenues generated from factory-built vacuum interrupter units that interrupt current inside a sealed vacuum envelope, typically supplied for medium-voltage switching duties up to about 40 kV across end users.
Scope exclusions: We do not include SF6 or oil interruption technologies, solid-state interrupters, or aftermarket repair kits and rebuild services.
Segmentation Overview
- By Application
- Circuit Breaker
- Contactor
- Recloser
- Load Break Switch
- Others (Capacitor bank, Earthing)
- By Voltage Class
- 15 kV
- 15.1-27 kV
- 27.1-38 kV
- above 38 kV
- By End-User Industry
- Utilities
- Industrial (Oil and Gas, Mining, Cement)
- Renewables and IPP
- Commercial and Data Centers
- By Installation Type
- Indoor Switchgear
- Outdoor Pole-mounted
- By Geography
- North America
- United States
- Canada
- Mexico
- Europe
- Germany
- United Kingdom
- France
- Italy
- Spain
- Russia
- Rest of Europe
- Asia-Pacific
- China
- Japan
- India
- South Korea
- ASEAN
- Australia and New Zealand
- Rest of Asia-Pacific
- South America
- Brazil
- Argentina
- Rest of South America
- Middle East and Africa
- Middle East
- Saudi Arabia
- UAE
- Turkey
- Rest of Middle East
- Africa
- South Africa
- Nigeria
- Rest of Africa
- Middle East
- North America
Data Sources, Market Sizing, and Validation
Desk Research
Desk research started by mapping where vacuum interrupters are actually used and sold, and then linking that to measurable demand signals in the power equipment chain. We reviewed public sources such as the International Energy Agency (grid and electrification indicators), World Bank and IMF macro series, and national grid and energy agencies for transmission and distribution investment signals.
To keep product boundaries realistic, we also leaned on technical and safety references such as IEC and IEEE publications, along with utility and switchgear association materials that describe voltage classes, equipment duty cycles, and replacement patterns. Company annual reports, investor decks, and credible press coverage were used to understand capacity additions, regional footprints, and mix shifts between indoor switchgear and outdoor installations. Where needed, we used paid subscriptions for company financial intelligence, patent landscaping, and shipment level trade checks to support specific assumptions. These examples are not exhaustive, and many other public sources were also used to collect data, validate it, and clarify open points.
Primary Interviews and Surveys
Primary work focused on validating the real demand pool behind interrupter shipments, especially how replacement cycles differ by voltage class, installation environment, and utility procurement behavior. We spoke with a mix of OEM and component supply chain roles, along with utility and industrial buyers, so that pricing, lead times, and specification shifts could be confirmed across APAC, EMEA, and the Americas.
Distribution of primary research fieldwork respondents
| Company type | Respondent position | Region |
|---|---|---|
| Top tier: 29% | CXOs: 17% | APAC: 47% |
| Mid tier: 54% | Functional/Unit leaders: 35% | EMEA: 29% |
| Smaller Players: 17% | Managers: 48% | Americas: 24% |
Market-Sizing & Forecasting
Sizing was built using a top-down demand reconstruction that starts from switchgear and protection equipment deployment activity and then narrows it to vacuum interruption adoption by voltage range and application. Once that demand pool was formed, we converted it to value using representative unit pricing by voltage class and order size (which changes meaningfully between contactors, reclosers, and circuit breakers).
To make sure the totals stayed practical, results were corroborated with selective bottom-up approximations such as sampled OEM revenue splits, channel checks on interrupter unit shipments, and price band validation from procurement feedback, and then totals were adjusted when the checks did not align. Key model inputs included medium-voltage grid capex and modernization indicators, utility replacement cycle assumptions, the installed base growth of distribution switchgear, voltage-class mix (15 kV and above), application share shifts toward reclosers and compact indoor switchgear, and average selling price movement tied to material and certification costs. For forecasting, scenario analysis was used, where the base case was anchored on grid investment outlooks and then refined through expert consensus on SF6-related substitution timing, lead-time constraints, and localization trends. When a segment lacked clean shipment visibility, gaps were handled by applying conservative penetration ranges and then re-testing them through additional interview callbacks.
Data Validation & Update Cycle
Validation was done through multiple passes that compare the model outputs against independent signals such as equipment installation activity, trade flows for key components, and publicly discussed order momentum from industry participants. Large variances were flagged, and the assumptions were re-checked, followed by a second analyst review before final sign-off.
Reports are refreshed annually, and interim updates are triggered when material events occur, such as major regulation changes, sharp pricing swings, or notable capacity expansions. Before delivery, we run a final refresh pass to incorporate the latest public releases and confirm that the model still ties back to the same demand indicators and scope logic.
Mordor Intelligence's Vacuum Interrupter Market Size Versus Other Published Estimates
Published market sizes for vacuum interrupters often vary because the scope line is drawn differently, and because pricing and volume assumptions are not always tied to the same equipment duty and voltage boundary. Differences also show up when one estimate assumes faster replacement of legacy interruption technologies, or uses a different currency timing for converting regional revenues.
The table points to a spread that is mainly explained by what gets counted around the interrupter itself and how voltage coverage is treated, and in Mordor Intelligence's model the value is limited to factory-built vacuum interrupter units used across switchgear applications up to about 40 kV rather than bundling complete switchgear panels or unrelated interruption media. Another common gap driver is how average selling prices are progressed, where some approaches use a single blended price across applications, even though contactors and medium-voltage breakers do not follow the same pricing curve year to year.
Benchmark comparison
| Source | Market Size | Gaps in Research Methodology |
|---|---|---|
| Mordor Intelligence | USD 3.24 B (2026) | |
| Global Consultancy A | USD 4.10 B (2026) | This figure appears to roll interrupters into broader medium-voltage switchgear value, which can pull in complete breaker assemblies and panels, thereby lifting the total beyond interrupter-only revenue. |
| Industry Association B | USD 2.85 B (2026) | This estimate likely narrows the demand pool to utility replacements and excludes portions of industrial and commercial switching uses, and it may apply conservative ASP assumptions without separating contactor versus breaker price bands. |
Taken together, the differences mostly come down to whether the count is interrupter-only or a broader equipment basket, and whether pricing is built by application and voltage class. Our approach stays traceable to clear demand signals like grid investment, replacement cycles, and realistic price bands, which makes the result easier to reproduce and stress-test.


Key Questions Answered in the Report
What is the current value of the vacuum interrupter market?
The market is valued at USD 3.24 billion in 2026 and is projected to reach USD 4.22 billion by 2031, growing at a 5.42% CAGR.
Which application segment is growing fastest?
Reclosers record the highest growth at a 5.72% CAGR through 2031 due to distribution automation needs.
Why are vacuum interrupters preferred in data centers?
They handle frequent switching without contact wear, support compact layouts, and integrate with remote-monitoring systems, all critical for 99.99% uptime targets.
How are environmental regulations influencing adoption?
European bans on new SF6 equipment push utilities toward vacuum interrupter solutions, accelerating uptake in both distribution and high-voltage classes.
Do solid-state breakers threaten the vacuum interrupter industry?
They offer ultra-fast interruption and no mechanical parts, but high costs and energy-loss levels limit penetration to niche applications through most of the forecast period.
Which region commands the largest share of the vacuum interrupter market?
Asia-Pacific leads with 41.05% of global revenue in 2025, underpinned by large-scale grid investments in China and India.
Page last updated on:


 Your data is secure and never sold or shared.


