Vein Illuminator Market Size and Share
Market Overview
| Study Period | 2020 - 2031 |
|---|---|
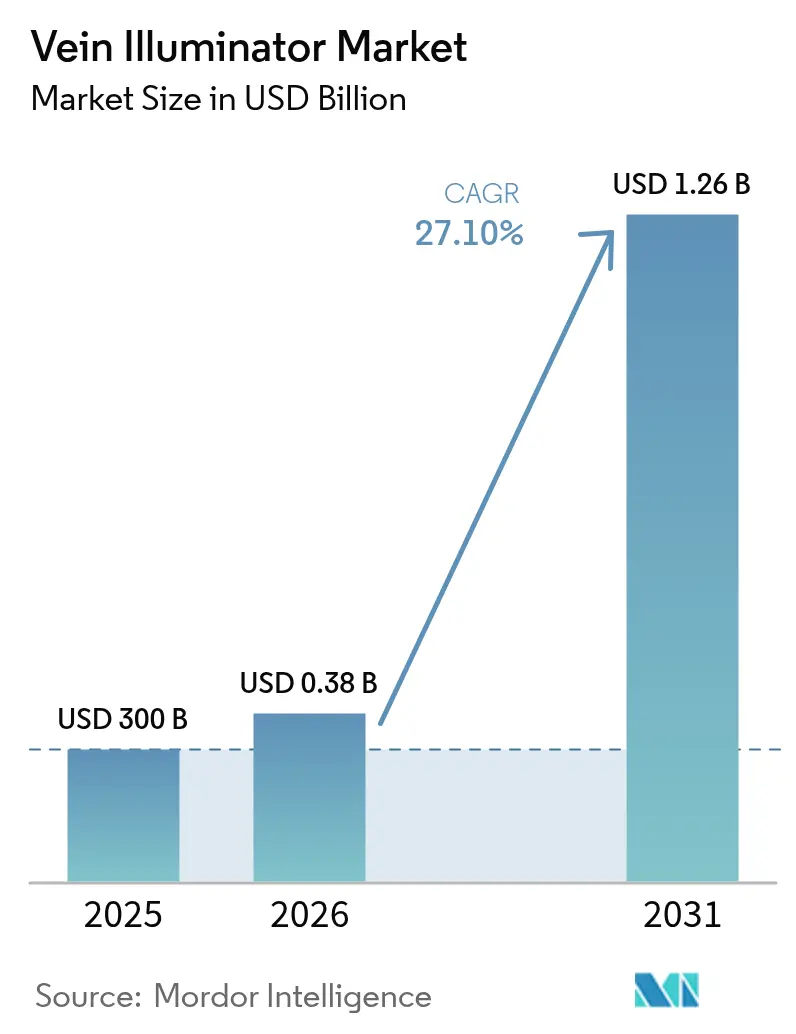
| Market Size (2026) | USD 0.38 Billion |
| Market Size (2031) | USD 1.26 Billion |
| Growth Rate (2026 - 2031) | 27.10% CAGR |
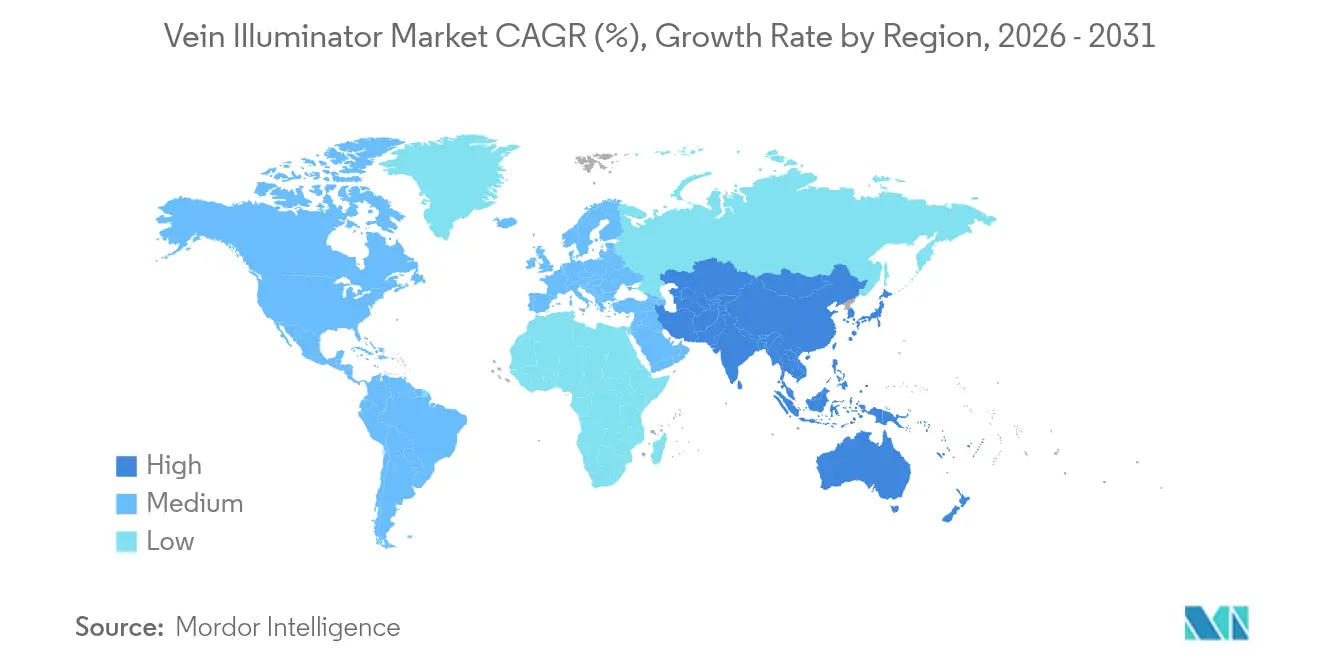
| Fastest Growing Market | Asia Pacific |
| Largest Market | North America |
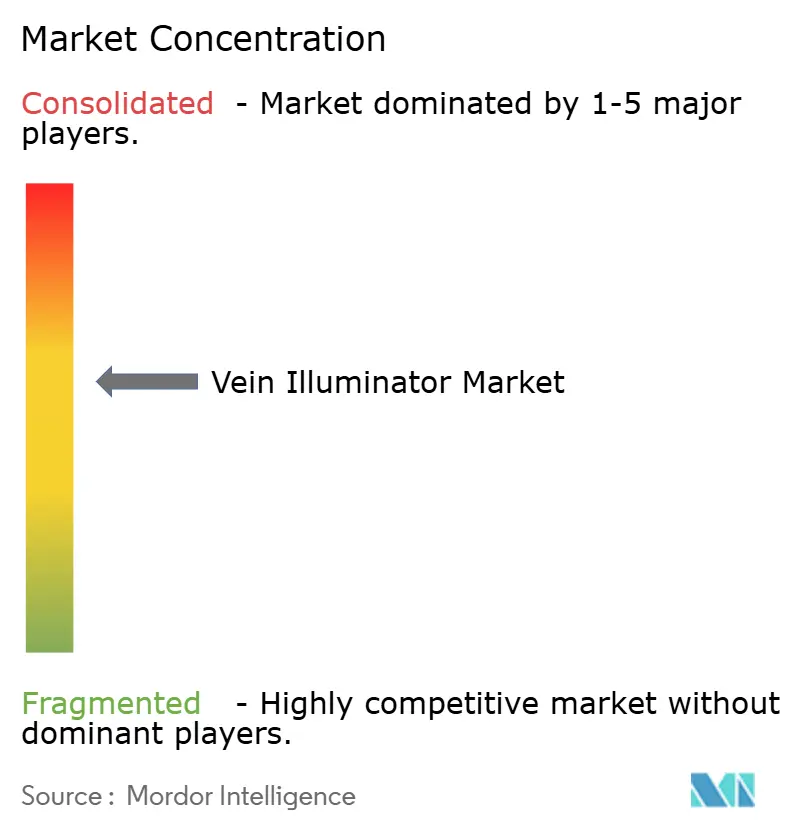
| Market Concentration | Medium |
Major Players *Disclaimer: Major Players sorted in no particular order Image © Mordor Intelligence. Reuse requires attribution under CC BY 4.0. | |
Vein Illuminator Market Analysis by Mordor Intelligence
The Vein Illuminator market size is expected to grow from USD 300 million in 2025 to USD 381.3 million in 2026 and is forecast to reach USD 1.26 billion by 2031 at 27.10% CAGR over 2026-2031. Robust growth reflects health systems’ focus on first-attempt venipuncture success, an outcome now tied to U.S. Medicare’s value-based purchasing scores. [1]AccuVein Inc., “Maury Regional Health Adopts Vein Visualization as Standard of Care to Help Improve Patient Outcomes,” AccuVein, accuvein.com Demand is amplified by aging and obese populations that make traditional vein palpation unreliable, while rising chronic-disease monitoring requires more frequent blood draws. Technology improvements in near-infrared (NIR) imaging, falling component costs, and portable form factors further accelerate adoption. Asia-Pacific’s push to localize medical-device manufacturing and China’s hospital modernization are tilting future revenue toward cost-optimized systems. Competitive pressure is intensifying as local firms introduce low-price NIR devices that undercut established brands while premium models layer on AI guidance and multi-modal imaging.
Key Report Takeaways
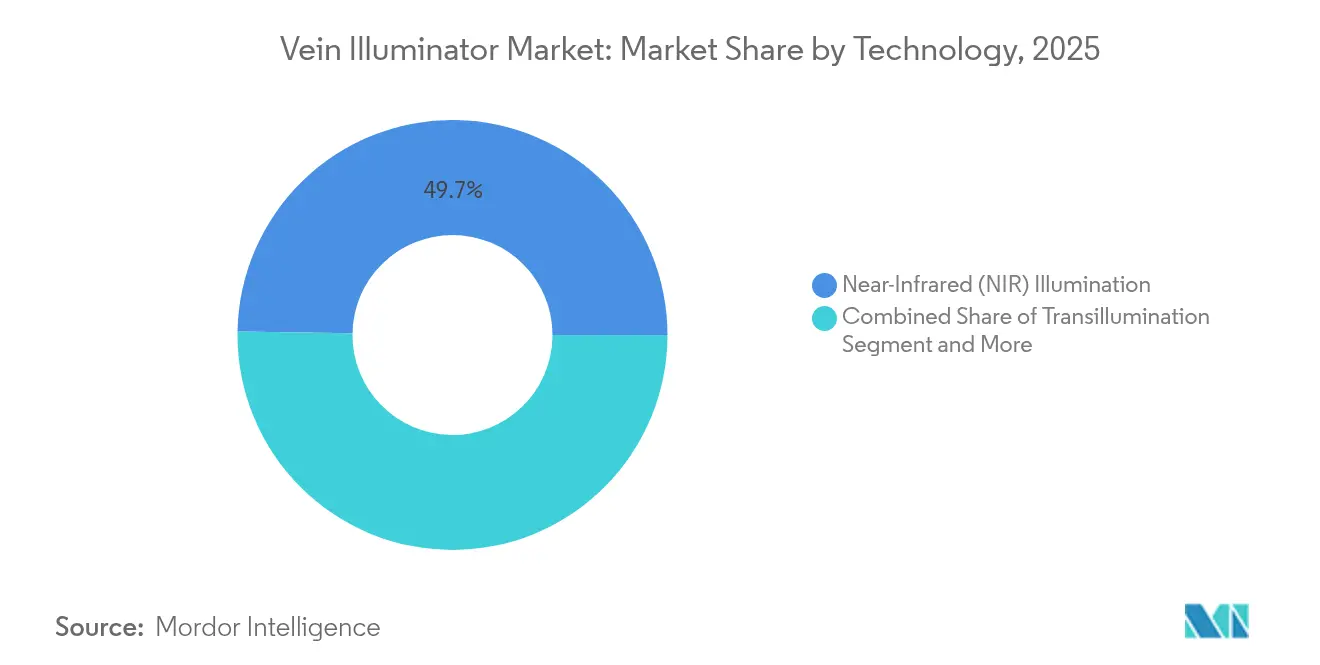
- By technology, Near-Infrared Illumination led with 49.74% revenue share in 2025; Ultrasound-Augmented systems are projected to expand at a 30.9% CAGR through 2031.
- By product type, Hand-held and Portable units held 60.55% of the vein illuminator market share in 2025, while Wearable and Clip-On Modules post the fastest 32.4% CAGR to 2031.
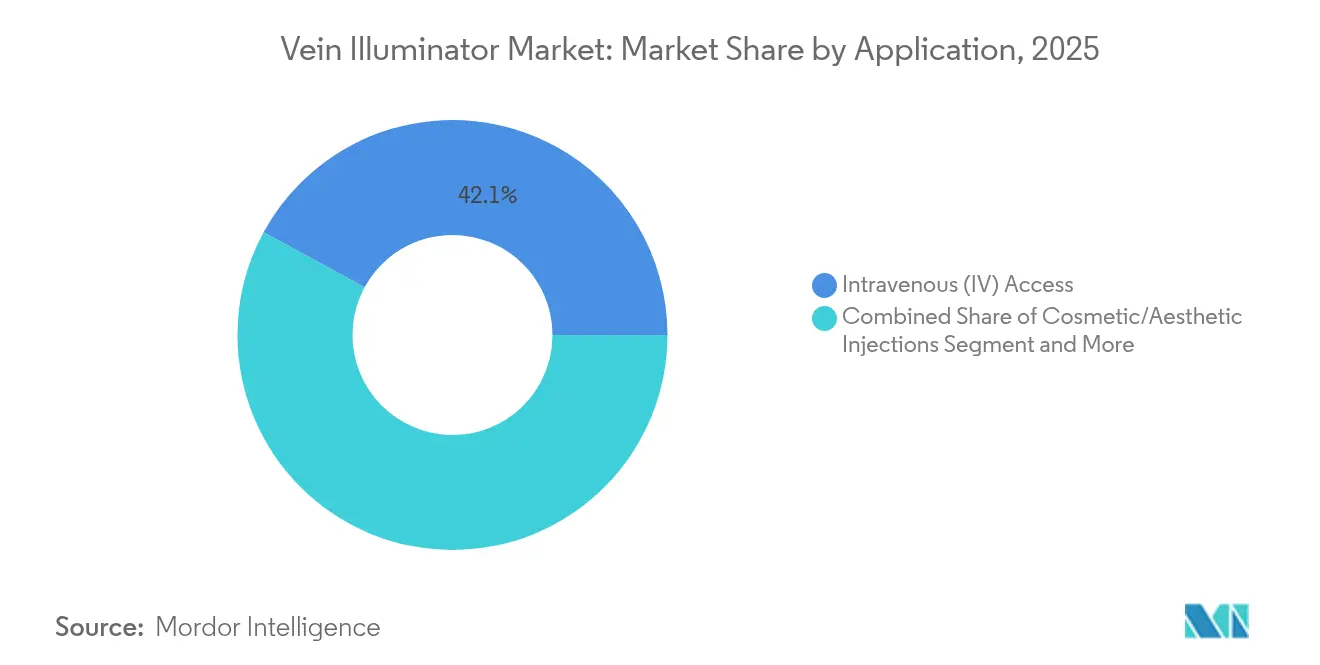
- By application, Intravenous Access accounted for 42.08% of the vein illuminator market size in 2025; Sclerotherapy and Varicose Vein Treatment are forecast to grow at 30.6% CAGR to 2031.
- By end-user, Hospitals and Clinics captured 45.60% revenue in 2025; Ambulatory Surgical Centers recorded the highest 29.55% CAGR through 2031.
- By geography, North America dominated with 36.80% 2025 revenue; Asia-Pacific is the fastest-growing region at 31.7% CAGR through 2031.
Note: Market size and forecast figures in this report are generated using Mordor Intelligence’s proprietary estimation framework, updated with the latest available data and insights as of 2026.
Global Vein Illuminator Market Trends and Insights
Drivers Impact Analysis*
| Driver | (~) % Impact on CAGR Forecast | Geographic Relevance | Impact Timeline |
|---|---|---|---|
| Rising first-attempt success rates for IV and phlebotomy | +8.5% | North America, Europe, global hospitals | Medium term (2-4 years) |
| Growth in chronic-disease blood draws | +7.2% | Asia-Pacific, North America | Long term (≥ 4 years) |
| Ageing and obese populations with difficult venous access | +6.8% | North America, Europe, emerging Asia-Pacific | Long term (≥ 4 years) |
| Hospital push for patient-experience KPIs | +4.3% | North America, Europe | Short term (≤ 2 years) |
| AI-integrated mobile vein-finder apps | +3.1% | Early adoption in North America | Medium term (2-4 years) |
| Adoption in cosmetic/aesthetic injections | +2.9% | North America, Europe | Medium term (2-4 years) |
| Source: Mordor Intelligence | |||
Rising First-Attempt Success Rates Drive Quality Metrics
Clinical trials in pediatric units showed first-stick success climbing to 74.1% with AccuVein AV400 compared with 40.7% using palpation, trimming procedure time from 169 seconds to 44 seconds. [2]Sevil Inal, “Impact of Peripheral Venous Catheter Placement With Vein Visualization Device Support on Success Rate and Pain Levels in Pediatric Patients,” Pediatric Emergency Care, researchgate.net Health-system executives translate these gains directly into higher HCAHPS patient-experience scores, which shape Medicare reimbursements, elevating device purchases to strategic priorities. Patient surveys reveal 93% of respondents rate hospitals higher when staff employ visualization tools.
Growth in Chronic-Disease Blood Draws
More frequent HbA1c, lipid, and renal tests among diabetic and cardiovascular cohorts raise annual venipuncture volumes, stressing phlebotomy capacity. Aging vasculature and drug-induced vein fragility heighten failure risk, prompting facilities to equip labs with portable NIR finders that cut repeat sticks and consumable waste.
Ageing and Obese Populations Challenge Traditional Methods
Obese patients (BMI > 30) experienced a 3.5-fold jump in IV placement success when clinicians used NIR devices, reaching 96% success within two attempts for BMI > 40. Geriatric skin thinning and altered subcutaneous fat distribution compound access difficulty, moving nursing homes and bariatric centers to standardize visualization.
Hospital Push for Patient-Experience KPIs
U.S. value-based payment formulas directly link revenue to patient satisfaction, and vein illuminators measurably raise comfort scores. Maury Regional Health adopted a visualization system-wide to bolster HCAHPS metrics and reduce missed sticks.
Restraints Impact Analysis*
| Restraint | (~) % Impact on CAGR Forecast | Geographic Relevance | Impact Timeline |
|---|---|---|---|
| High capital and per-unit device costs | –4.8% | Emerging markets worldwide | Short term (≤ 2 years) |
| Lack of reimbursement codes | –3.2% | North America, Europe | Medium term (2-4 years) |
| Training gaps in low-resource settings | –2.1% | Asia-Pacific, Africa, Latin America | Long term (≥ 4 years) |
| Regulatory ambiguity for aesthetic-only devices | –1.9% | Global | Medium term (2-4 years) |
| Source: Mordor Intelligence | |||
High Capital and Per-Unit Device Costs
Premium NIR systems list between USD 4,000 and USD 27,000, squeezing budgets of small hospitals. Experimental open-source models built from recycled optics have demonstrated comparable vein contrast for USD 25, hinting at future price erosion.
Lack of Reimbursement Codes
Because illumination is bundled into broader IV or phlebotomy codes, providers cannot recoup capital outlays directly. LimFlow’s 2025 CMS approval for a dedicated vascular device category signals that distinct coding pathways could emerge for visualizers.
*Our forecasts treat driver/restraint impacts as directional, not additive. The impact forecasts reflect baseline growth, mix effects, and variable interactions.
Segment Analysis
By Technology: NIR Dominance Faces Hybrid Disruption
Near-Infrared Illumination controlled 49.74% revenue in 2025, underpinning the vein illuminator market with a mature, cost-efficient platform. Ultrasound-Augmented units, posting 30.9% CAGR to 2031, carve share in difficult-access patients via deeper imaging and synergy with existing ultrasound carts. Transillumination remains a pediatric niche due to softer light, while multispectral hybrids gain research traction. Patent filings such as the dual-mode VeinCAP system illustrate convergence trends toward single devices offering NIR plus diffuse hyperspectral views. As feature sets widen, vendors differentiate on AI algorithms that auto-grade vein quality and log success metrics to electronic health records.


By Product Type: Portability Drives Innovation
Hand-held and Portable devices occupied 60.55% of 2025 revenue because nurses favor pocketable tools that shift easily between wards. Wearable and Clip-On Modules, climbing at 32.4% CAGR, free clinicians’ hands during complex cannulations, and feed video to smart glasses for teaching. Table-top carts persist in blood banks where mounted cameras stay calibrated for long draws. IoT connectivity is redefining design priorities: next-generation wearables integrate Wi-Fi and cloud dashboards that benchmark first-stick rates, transforming basic lights into quality-management nodes.
By Application: Aesthetic Expansion Accelerates Growth
Intravenous Access held a 42.08% share in 2025, the base use case anchoring the vein illuminator market. Yet cosmetic practices fuel the fastest 30.6% CAGR in Sclerotherapy and Varicose Vein Treatment after FDA safety notices highlighted injection-site complication risks. Facial-vein mapping cuts bruising and hematoma rates, making imaging a standard of care in high-volume med-spa chains.
By End-user: Ambulatory Centers Drive Adoption
Hospitals and Clinics captured 45.60% revenue in 2025, but outpatient Ambulatory Surgical Centers are expanding fastest at 29.55% CAGR through 2031. Time-based reimbursement models reward ASC operators who shave minutes off IV setups with visualization, reinforcing spending despite tight capital budgets. Blood Donation Camps value donor comfort to secure repeat visits, while nursing homes purchase compact models that accompany mobile phlebotomy carts.
Geography Analysis
North America retained 36.80% 2025 revenue leadership on the back of sophisticated infrastructure and reimbursement programs that pay for patient-experience outcomes. U.S. hospitals embed first-stick statistics into quality dashboards, ensuring repeat device orders. Canada’s single-payer system favors province-wide contracts that lower per-unit costs, while Mexico’s private medical-tourism clinics install finders as patient-comfort differentiators.
Europe’s multi-payer environment produces steady uptake; Germany’s university hospitals pilot multi-modal units, and the United Kingdom’s NHS negotiates bulk pricing to support vascular-access safety goals. CE Mark harmonization smooths cross-border sales and encourages newer entrants from Scandinavia and Eastern Europe.
The vein illuminator market size in Asia-Pacific is expanding at a 31.7% CAGR, making it the global growth engine. India’s Production-Linked Incentive scheme subsidizes domestic device plants, reducing import reliance. China’s hospital-upgrade program requires equipment that boosts nursing efficiency; local brands undercut imports by bundling visualization with IV kits. Japan’s super-aged population and high device standards favor premium dual-mode systems, while South Korea’s start-ups test AI-enabled smartphone adapters for home infusion services.

Competitive Landscape
Market concentration is moderate: AccuVein, Christie Medical, and Translite together account for slightly less than half of global sales, while dozens of regional firms compete on price. Leaders defend their share through clinical evidence, 40-plus granted patents, and global distribution networks. Price competition is most acute in basic NIR models, where Asian OEMs ship sub-USD 500 units to community hospitals. Innovation is shifting toward platform propositions that pair imaging with analytics dashboards, cloud logbooks, and AI vein-grading. Strategic moves during 2024-2025 included Christie adding Bluetooth-enabled AVV-X series and AccuVein partnering with cloud-EHR vendors to auto-record cannulation attempts.
Consolidation is expected as firms seek scale for R&D and regulatory compliance. Likely buyers include infusion-therapy giants aiming to bundle visualization with IV set consumables, echoing Philips’ 2024 move to launch LumiGuide surgical navigation that embeds optics expertise within broader vascular portfolios. [3]Koninklijke Philips N.V., “Philips LumiGuide: 3D Human GPS Powered by Light,” philips.com
Vein Illuminator Industry Leaders
AccuVein Inc.
Christie Medical Holdings Inc.
TransLite LLC (Veinlite)
VueTek Scientific LLC
Venoscope LLC
- *Disclaimer: Major Players sorted in no particular order

Recent Industry Developments
- January 2025: LimFlow received FDA approval and CMS payment codes for the TADV System, setting a coding precedent that could benefit visualization devices.
- December 2024: Therma Bright signed a U.S. distribution agreement for Venowave VW5, underscoring distributor appetite for vascular-access tools.
- December 2024: Inari Medical secured reimbursement for ClotTriever in Japan, illustrating Asia-Pacific’s willingness to pay for vascular innovation.
- September 2024: Medical San obtained FDA clearance for the Liftendo laser varicose-vein system, expanding the interventional device pipeline.


Research Methodology Framework and Report Scope
Market Definitions and Key Coverage
Our study defines the vein illuminator market as all dedicated medical devices that use near-infrared, transillumination, or focused ultrasound light to project a real-time map of sub-cutaneous veins on the skin during cannulation, blood draws, and sclerotherapy. These units are sold as portable, tabletop, or fixed systems to hospitals, ambulatory centers, blood banks, and home-care providers worldwide.
Exclusions include wearable smartphone attachments, general purpose ultrasound scanners, and optical guidance systems bundled inside infusion pumps, which are outside our scope.
Segmentation Overview
- By Technology
- Near-Infrared (NIR) Illumination
- Transillumination
- Ultrasound-Augmented
- Multispectral/Hybrid
- Others
- By Product Type
- Hand-held and Portable
- Table-Top/Cart-Mounted
- Wearable and Clip-On Modules
- By Application
- Intravenous (IV) Access
- Blood Draw/Venipuncture Assistance
- Sclerotherapy and Varicose Vein Treatment
- Emergency and Critical Care
- Cosmetic/Aesthetic Injections
- By End-user
- Hospitals and Clinics
- Blood Donation Camps and Blood Banks
- Ambulatory Surgical Centers
- Rehabilitation and Nursing Homes
- Academic and Research Institutions
- By Geography
- North America
- United States
- Canada
- Mexico
- South America
- Brazil
- Argentina
- Chile
- Rest of South America
- Europe
- Germany
- United Kingdom
- France
- Italy
- Spain
- Russia
- Rest of Europe
- Asia-Pacific
- China
- India
- Japan
- South Korea
- Malaysia
- Singapore
- Australia
- Rest of Asia-Pacific
- Middle East and Africa
- Middle East
- United Arab Emirates
- Saudi Arabia
- Turkey
- Rest of Middle East
- Africa
- South Africa
- Nigeria
- Rest of Africa
- Middle East
- North America
Detailed Research Methodology and Data Validation
Primary Research
Interviews and surveys with biomedical engineers, nursing educators, procurement heads, and regional distributors across North America, Europe, and key Asia-Pacific markets helped us validate installed base estimates, average selling prices, replacement cycles, and early-stage regulatory influences. These expert conversations fine-tuned adoption rates and stress-tested our forecast drivers.
Desk Research
We draw initial sizing cues from procedure volumes and device clearances published by sources such as the U S FDA 510(k) database, the Infusion Nurses Society guidelines, UN and WHO venipuncture safety briefs, and hospital discharge statistics issued by bodies like the Centers for Medicare & Medicaid Services. Our analysts also mine customs shipment records and patent trends through Questel to map exporter clusters and innovation pacing.
Financial filings, investor decks, and press releases from leading manufacturers add pricing corridors, while trade journals and regional health-tech associations flag emerging demand pockets. The sources listed here are illustrative; many additional public datasets and news feeds were reviewed to cross-check numbers and narrative insights.
Market-Sizing & Forecasting
Mordor analysts start with a top-down model that reconstructs annual demand from global venipuncture and IV procedure counts, adjusted for device penetration by end-user setting and average unit life. Select bottom-up checks, such as sampled shipments from major vendors and channel audit calls, provide a reasonableness lens before totals are locked. Key variables include inpatient and outpatient blood-draw episodes, chronic disease prevalence, average selling price by form factor, hospital capital-equipment budgets, and regional nurse-to-bed ratios. We project forward with a multivariate regression that blends procedure growth, technology substitution curves, and macro health-spend trends, then run scenario analysis for pricing shocks or reimbursement shifts.
Data Validation & Update Cycle
Outputs undergo variance screens against historical series, peer values, and live news triggers. A second analyst reviews anomalies, and senior review signs off on the final dashboard. Reports refresh each year, while material regulatory or merger events prompt interim updates so clients receive the latest view.
Why Mordor's Vein Illuminator Baseline Earns Decision-Maker Trust
Published market estimates often diverge because firms mix adjacent products, apply different currency years, or extrapolate growth from narrow regional snapshots. Our disciplined scope, dual-method model, and annual refresh cadence reduce these pitfalls.
Key gap drivers we notice include the inclusion of broader vascular imaging kits, aggressive price inflation without volume proof, and unvetted device counts from press stories. Mordor's base case stays anchored to clinically deployed illuminators only, uses procedure-linked uptake curves, and converts revenues at the IMF's average annual exchange rates.
Benchmark comparison
| Market Size | Anonymized source | Primary gap driver |
|---|---|---|
| USD 0.30 B (2025) | Mordor Intelligence | - |
| USD 0.23 B (2024) | Global Consultancy A | Omits home-care channel and applies uniform ASP across geographies |
| USD 0.08 B (2024) | Industry Database B | Uses hospital-only procedure pool, ignoring ambulatory and blood-bank demand |
| USD 88.23 B (2023) | Regional Digest C | Bundles vascular imaging, doppler probes, and infusion pumps under one heading, inflating totals |
In sum, the disciplined variable selection and repeatable steps embedded in Mordor's methodology produce a balanced, transparent baseline that healthcare strategists can rely on for budgeting, partnering, and investment decisions.


Key Questions Answered in the Report
What is the current size of the vein illuminator market and its growth outlook?
The vein illuminator market size is USD 381.3 million in 2026 and is projected to reach USD 1.26 billion by 2031, advancing at a 27.10% CAGR.
Which region is forecast to grow the fastest?
Asia-Pacific is expected to expand at a 31.70% CAGR through 2031, driven by medical-device manufacturing incentives in India and hospital modernization in China.
Which technology holds the largest market share?
Near-Infrared Illumination led with a 49.74% revenue share in 2025, supported by mature clinical validation and cost-efficient components.
Which end-user segment shows the highest growth rate?
Ambulatory Surgical Centers are growing the fastest with a 29.55% CAGR as outpatient care models prioritize shorter procedure times and higher patient satisfaction.
What are the primary factors accelerating adoption?
Higher first-attempt venipuncture success rates, rising chronic-disease blood draws, and hospital patient-experience KPIs are the leading demand drivers.
What key barriers restrain wider deployment?
High capital costs for premium devices and the absence of dedicated reimbursement codes reduce purchasing incentives, especially in cost-sensitive settings.
Page last updated on:


