Market Overview
| Study Period | 2020 - 2031 |
|---|---|
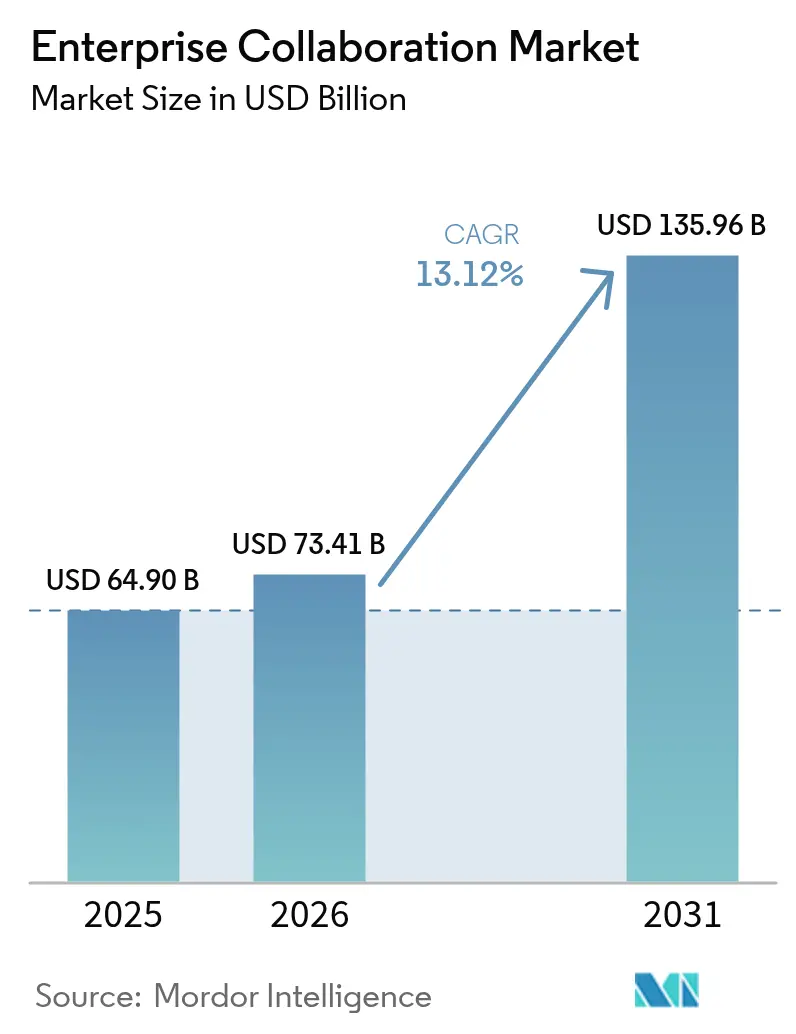
| Market Size (2026) | USD 73.41 Billion |
| Market Size (2031) | USD 135.96 Billion |
| Growth Rate (2026 - 2031) | 13.12% CAGR |
| Fastest Growing Market | Asia Pacific |
| Largest Market | North America |
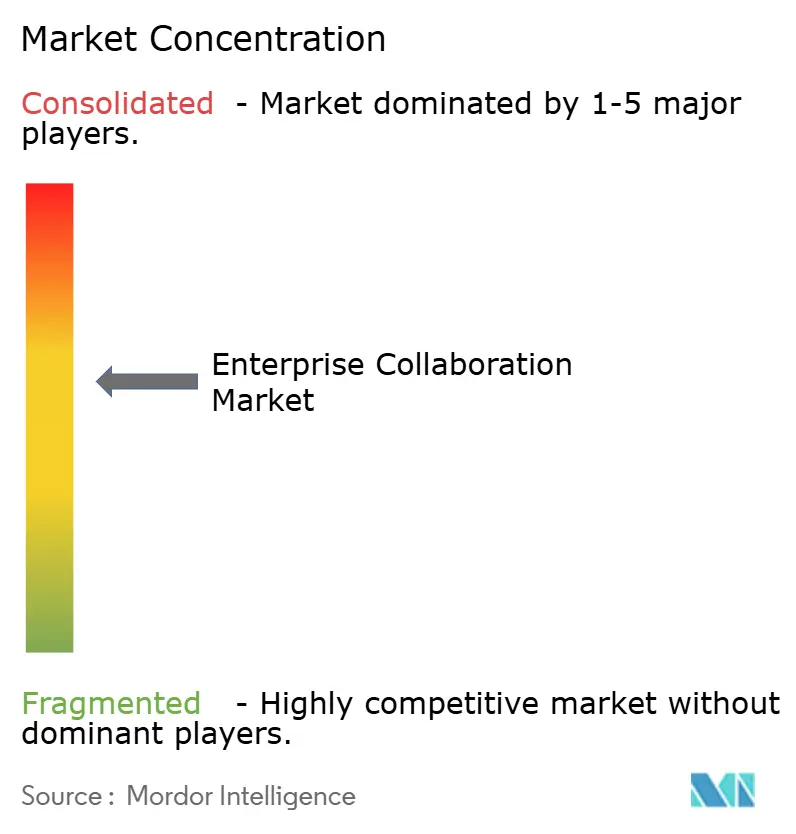
| Market Concentration | Medium |
Major Players *Disclaimer: Major Players sorted in no particular order Image © Mordor Intelligence. Reuse requires attribution under CC BY 4.0. | |
Enterprise Collaboration Market Analysis by Mordor Intelligence
The enterprise collaboration market size in 2026 is estimated at USD 73.41 billion, growing from 2025 value of USD 64.90 billion with 2031 projections showing USD 135.96 billion, growing at 13.12% CAGR over 2026-2031. Strong growth is tied to rapid adoption of generative-AI copilots, hybrid-work mandates, and the need for secure, scalable platforms that unify voice, video, messaging, and knowledge management. Software continues to anchor spending, though services rise faster as enterprises seek specialized AI integration talent. Cloud migration remains brisk despite data-sovereignty concerns that keep many workloads on-premise. Regionally, North America retains revenue leadership on the strength of early AI deployment, while Asia-Pacific emerges as the standout growth engine on the back of 5G rollouts, aggressive digital-infrastructure investment, and supportive government policy.
Key Report Takeaways
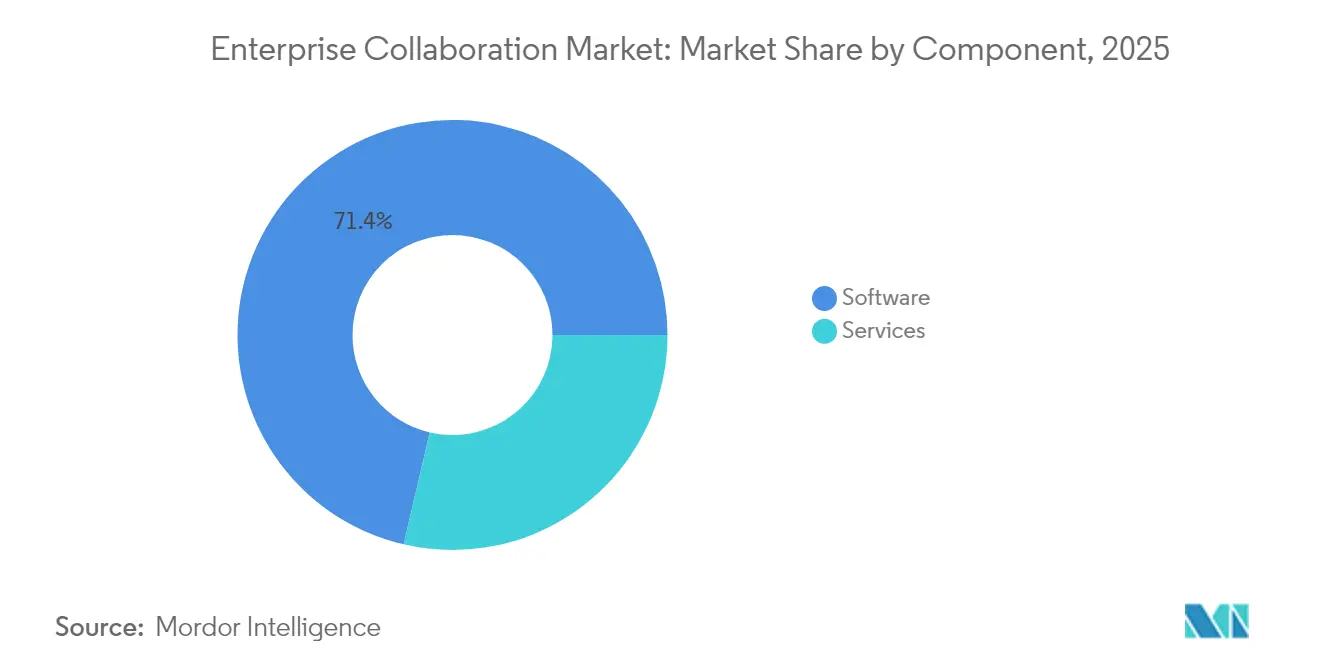
- By component, software captured 71.35% of 2025 revenue, while services are forecast to grow at 14.22% through 2031.
- By deployment type, on-premise solutions held 67.60% of the enterprise collaboration market share in 2025; cloud implementations are advancing at a 14.26% CAGR.
- By application, communication tools accounted for a 40.55% share of the enterprise collaboration market in 2025; social and knowledge-sharing platforms are expected to rise at 13.55% CAGR.
- By organization size, large enterprises led with 60.85% of 2025 revenue, whereas SMEs are expanding at 14.05% CAGR.
- By end-user industry, IT and telecommunications held 23.05% of revenue in 2025; healthcare and life sciences are projected to grow at 13.42% CAGR.
- By geography, North America commanded 39.55% revenue in 2025, while Asia-Pacific is positioned for a 13.76% CAGR through 2031.
Note: Market size and forecast figures in this report are generated using Mordor Intelligence’s proprietary estimation framework, updated with the latest available data and insights as of 2026.
Market Trends and Insights
Drivers Impact Analysis of Enterprise Collaboration Market*
| Restraint | (~) % Impact on CAGR Forecast | Geographic Relevance | Impact Timeline |
|---|---|---|---|
| Rising vendor lock-in and interoperability concerns | –1.8% | Global; Europe most acute | Medium term (2-4 years) |
| Tightening data-sovereignty regulations | –1.5% | Europe, APAC, emerging markets | Long term (≥ 4 years) |
| App-fatigue lowers user-engagement KPIs | –1.2% | North America and Europe | Short term (≤ 2 years) |
| Escalating zero-day exploits | –1.9% | Global; enterprise-sector focus | Short term (≤ 2 years) |
| Source: Mordor Intelligence | |||
API Integration to Unify Fragmented Workflows
Modern enterprises juggle an average of 9.4 applications per worker, creating costly context-switching overhead. By 2026, 75% of firms plan to deploy AI-enabled communications APIs that connect CRM systems, project-management suites, and messaging hubs, cutting product launch cycles by 25% and lifting the enterprise collaboration market’s overall productivity value. Successful adopters report smoother data synchronization that feeds AI copilots richer context, enabling them to automate mundane updates and free employees for higher-value tasks.
Mobile-First Design Accelerates Frontline Adoption
Frontline workers comprise 80% of the global workforce yet historically lacked purpose-built tools. Mobile-native interfaces now deliver real-time task management, saving firms as much as 391% ROI relative to desktop-centric rollouts[1]Microsoft, “Work Trend Index 2025,” blogs.microsoft.com. Asia-Pacific leads this shift due to long-standing mobile-first consumer behavior, propelling regional growth within the enterprise collaboration market.
Generative-AI Copilots Automate Repetitive Tasks
Ninety-two percent of enterprises increased AI budgets in 2025 even though only 1% deem their deployments mature. Microsoft’s Copilot across Teams and Office products illustrates time savings of 30-50% on note-taking, document drafting, and spreadsheet analysis. Partnerships such as Moveworks and Microsoft Azure extend these benefits by embedding large-language-model chat agents directly into business systems.
Hybrid-Work Mandates Boost UCaaS Deployments
Unified Communications-as-a-Service has become a linchpin for distributed teams. Organizations converge contact-center and collaboration silos on single stacks to ensure consistent experiences for staff and customers. Seventy-six percent of enterprises plan to unify platforms, bolstering demand across the enterprise collaboration market.
Verticalised “Micro-Suite” Bundles
Vendors now package industry-specific workflows—such as telehealth and secure clinical messaging—into targeted micro-suites that reduce integration burden. This tailored approach builds loyalty among regulated industries and further accelerates services revenue.
Low-Latency Edge Points of Presence (PoPs) in Emerging Markets
Edge PoPs reduce round-trip latency, enabling AI-driven translation, summarization, and real-time analytics in bandwidth-constrained regions. Providers that deploy edge infrastructure gain a strategic foothold in fast-growing frontier economies.
Restraints Impact Analysis of Enterprise Collaboration Market*
| Restraint | (~) % Impact on CAGR Forecast | Geographic Relevance | Impact Timeline |
|---|---|---|---|
| Rising vendor lock-in and interoperability concerns | –1.8% | Global; Europe most acute | Medium term (2-4 years) |
| Tightening data-sovereignty regulations | –1.5% | Europe, APAC, emerging markets | Long term (≥ 4 years) |
| App-fatigue lowers user-engagement KPIs | –1.2% | North America and Europe | Short term (≤ 2 years) |
| Escalating zero-day exploits | –1.9% | Global; enterprise-sector focus | Short term (≤ 2 years) |
| Source: Mordor Intelligence | |||
Rising Vendor Lock-In and Interoperability Concerns
Regulators now probe cloud ecosystems for anti-competitive practices as egress fees and proprietary AI models create costly switching barriers[2]Ofcom, “Cloud Services Market Study 2025,” ofcom.org.uk. Enterprises counter by adopting open standards and containerized deployment, yet the learning curve of retraining users on alternative AI interfaces remains high.
Tightening Data-Sovereignty Regulations
New U.S. and EU rules restrict offshore data transfers for sensitive content. Sovereign-cloud offerings address compliance but raise cost and complexity, tempering the enterprise collaboration market’s cloud-migration pace.
*Our forecasts treat driver/restraint impacts as directional, not additive. The impact forecasts reflect baseline growth, mix effects, and variable interactions.
Enterprise Collaboration Market Segment Analysis
By Component:
Services Surge as AI Integration Demands ExpertiseSoftware retained a 71.35% slice of 2025 revenue, cementing its role as the core platform layer in the enterprise collaboration market. Services, however, are forecast to expand at 14.22% CAGR, topping the overall 13.12% pace as enterprises recognize that AI copilots require custom prompt engineering, model fine-tuning, and governance frameworks. The enterprise collaboration market size for services is on track to reach USD 42.61 billion by 2031, reflecting sustained demand for professional and managed offerings. Vendors bundle training, change-management, and continuous optimization contracts that typically run 40–60% longer than traditional collaboration engagements.
Historical data show services CAGR accelerating from 11.8% during 2019-2024 to 14.22% through 2031, mirroring the escalating complexity that AI and edge computing introduce. Providers such as Tata Consultancy Services build industry-specific centers of excellence, enabling clients to launch AI-infused communications faster and with lower risk. As a result, the enterprise collaboration market continues to see a blurring line between software license value and service-delivered innovation.


By Deployment Type:
Cloud Migration Accelerates Despite On-Premise DominanceOn-premise solutions preserved 67.60% of 2025 revenue, underscoring the grip of data-sovereignty rules in sectors like finance and government. Cloud deployments, while smaller, are rising at a 14.26% CAGR—outpacing on-premise by 3.7 percentage points—as organizations pursue elastic consumption models and native AI add-ons. The enterprise collaboration market size for cloud implementations is projected to hit USD 44.06 billion by 2031, illustrating how hybrid designs that pair local control with cloud innovation will dominate architectural blueprints.
Sovereign-cloud frameworks, edge PoPs, and confidential-computing techniques help reconcile regulatory constraints with AI ambitions. By 2027, 70% of enterprises plan to evaluate provider choices through a “digital sovereignty” lens. That requirement inflates demand for regional data centers and multi-cloud orchestration skills, fueling the enterprise collaboration industry’s services upswing.
By Application:
Social Platforms Drive Knowledge Capture InnovationCommunication tools contributed 40.55% of 2025 spend, anchoring day-to-day voice, video, and chat workloads. Yet social and knowledge-sharing platforms are on course for 13.55% CAGR, propelled by AI-driven tagging and content-discovery engines that trim information-search time by 35%. Segment momentum signals a shift from transient conversations to persistent knowledge repositories that strengthen institutional memory across the enterprise collaboration market.
Conferencing tools maintain healthy, though slower, growth as hybrid meetings become routine. Coordination modules gain relevance through AI copilots that convert conversation transcripts into actionable tasks and timelines. In turn, the enterprise collaboration market share for knowledge-centric platforms is projected to widen steadily as firms prioritize organizational learning and compliance documentation.
By Organisation Size:
SMEs Embrace Cloud-Native SolutionsLarge enterprises still own 60.85% of 2025 revenue thanks to global footprints and entrenched ERP/CRM systems. However, SMEs will expand at a 14.05% CAGR amid falling entry barriers and subscription pricing that removes heavy capital outlays. Cloud-native suites provide SMEs with the same AI copilots enjoyed by large companies, leveling the playing field and introducing competitive agility.
The enterprise collaboration market sees SMEs leveraging template-based deployments that slash implementation time, often wrapping in industry-specific workflows. Vendors also embed self-service analytics, allowing small IT teams to monitor adoption and adjust configurations rapidly. As AI models democratize advanced capabilities, SMEs transform from laggards into early adopters in many vertical niches.

By End-User Industry:
Healthcare Accelerates AI-Powered ComplianceIT and telecom retained a 23.05% share in 2025, validating its early-adopter reputation. Healthcare and life sciences, though smaller, are heading toward 13.42% CAGR as HIPAA-grade encryption, AI-assisted redaction, and real-time clinical support become must-have features. The enterprise collaboration market size for healthcare-focused platforms is forecast to double by 2030, driven by telehealth expansion and stricter data-protection rules.
Financial services, retail, education, logistics, and travel display varied but steady gains, each seeking vertical-specific micro-suites. Education institutions adopt automated grading and immersive learning capabilities, while retailers rely on AI copilots for demand planning and customer engagement. Across industries, vendors that tailor compliance, analytics, and user experience to domain nuances secure premium margins.
Geography Analysis
North America Enterprise Collaboration Market
North America generated 39.55% of 2025 revenue for the enterprise collaboration market, reflecting deep cloud penetration, early AI adoption, and robust VC funding. Regional enterprises now embed generative AI in customer-facing workflows as a competitive necessity, underpinning consistent double-digit growth. Expanding sovereign-cloud zones and edge zones ensure regulated sectors can balance compliance with innovation.
APAC Enterprise Collaboration Market
Asia-Pacific is the fastest-growing territory at 13.76% CAGR through 2031. Governments invest aggressively in 5G backbones and cloud infrastructure, while organizations report a 3.6× ROI on AI rollouts. Coupled with a mobile-first workforce and supportive policy regimes, this dynamic elevates Asia-Pacific to a primary engine of global expansion for the enterprise collaboration market. In Australia, Japan, and Singapore, digital-sovereignty frameworks align with open-cloud ecosystems, fostering hybrid architectures that blend local data residency with global AI resources.
EMEA and LATAM Enterprise Collaboration Market
Europe advances steadily on the back of the Digital Markets Act and strict GDPR enforcement, which favor local providers that can certify higher-than-standard data safeguards. Meanwhile, Latin America and the Middle East, and Africa benefit from improving broadband coverage and the proliferation of regional data centers. Edge PoP deployments in Mexico, Brazil, and the UAE reduce latency, supporting AI-heavy features even where international bandwidth is cost-prohibitive.


Regulatory Landscape
Regulation affecting enterprise collaboration increasingly centers on AI governance, interoperability, and cross-border data controls that shape deployment choices between on-premise, cloud, and sovereign-cloud models. In the EU, the AI Act (Regulation 2024/1689) sets phased obligations, with initial chapters applying from February 2025, general-purpose AI obligations applying from August 2025, and the general application date anchored at August 2, 2026. This raises compliance demands for copilots embedded in collaboration suites.
Competition and platform rules also influence integration strategy. Under the EU Digital Markets Act, interoperability obligations for designated gatekeepers (Article 6(7)) have been reinforced through a March 2025 European Commission decision (Case DMA.100204) that confirmed applicability to operating systems, supporting third-party interconnection and increasing pressure on collaboration providers to publish robust APIs and reduce switching friction. In the United States, communications-related rules continue to touch collaboration stacks that bundle voice, with an FCC Final Rule published February 17, 2026 (effective March 19, 2026) requiring updated certifications for interconnected VoIP providers with direct access to NANP resources.
Value Chain Analysis
The enterprise collaboration value chain starts with core technology inputs, including cloud infrastructure, security tooling (identity, encryption, key management), AI model and data-layer components, and enterprise system connectors that draw context from ERP/CRM/ITSM and content repositories. Platform vendors package these into collaboration suites spanning voice, video, messaging, project workspaces, and knowledge management, while preserving extensibility through APIs and app marketplaces to address interoperability concerns and reduce context switching across the average multi-application environment.
Downstream value creation focuses on implementation and ongoing operations. Systems integrators and managed service providers (for example, Accenture, Capgemini, Cognizant, Infosys, and TCS) deliver tenant migrations, governance configuration, custom workflow integration, and change management, which has become more critical as organizations operationalize generative-AI copilots and agent-based automation. Distribution runs through direct enterprise sales and channel partners, with recurring revenue reinforced by add-on security, compliance, and analytics services. Data silos and fragmented partner environments remain bottlenecks, which lifts demand for bi-directional integrations rather than system replacement and increases the role of services in stabilizing deployments across hybrid and multi-cloud estates.
Competitive Landscape
The enterprise collaboration market remains moderately concentrated. Microsoft, Cisco, and Zoom hold sway through integrated suites, continuous AI releases, and global channel ecosystems. Microsoft phased out Skype in May 2025 to streamline investment behind Teams, which now integrates Copilot, Viva Insights, and Dynamics data streams for unified productivity. Cisco partnered with NVIDIA to deliver AI-ready data-center fabric and secured FedRAMP authorization for Meraki, boosting federal contracts. Zoom recorded 100% year-over-year cloud contact-center growth by bundling AI Companion features and unveiling partner-first pricing.
Competition pivots on AI differentiation and ecosystem openness. Vendors entice customers with turnkey copilots that summarize meetings, translate chat, and auto-generate project plans—capabilities that materially lift adoption metrics. Interoperability also shapes buying decisions; platforms that publish robust APIs and embrace open-source standards mitigate vendor-lock fears and tilt RFPs in their favor.
Emerging disruptors carve niches via vertical micro-suites. Moveworks embeds conversational AI into IT-service workflows, while specialist providers build compliance-oriented solutions for finance and healthcare. Strategic alliances—such as TCS’s NVIDIA unit—underscore how services firms amplify vendor reach by offering domain expertise that accelerates AI payoff. Over time, the enterprise collaboration industry will likely witness further consolidation as leading vendors acquire niche players to fast-track vertical capabilities.
Enterprise Collaboration Industry Leaders
Microsoft Corporation
Huawei Technologies Co. Ltd.
Adobe Systems Inc.
SAP SE
IBM Corporation
- *Disclaimer: Major Players sorted in no particular order
Enterprise Collaboration Market Companies Covered in this Report
- Microsoft Corporation
- Cisco Systems Inc.
- Zoom Video Communications Inc.
- Slack Technologies Inc. (Salesforce)
- Google LLC
- IBM Corporation
- SAP SE
- Atlassian Corporation PLC
- Adobe Inc.
- Huawei Technologies Co. Ltd.
- Mitel Networks Corp.
- TIBCO Software Inc.
- Zoho Corp.
- Axero Solutions LLC
- Trello (Atlassian)
- monday.com Ltd.
- Asana Inc.
- Jive Software
- Poly (HP)
- RingCentral Inc.

Market Opportunities and Future Outlook
A major opportunity is the shift from collaboration as communication to collaboration as execution, where agents can take actions across connected business systems. Microsoft moving Copilot Cowork to general availability in June 2026, with sensitivity label inheritance and third-party plugins (including Salesforce and monday.com), points to growing focus on governed, cross-application task completion rather than standalone meeting summarization. That creates whitespace for vendors and services firms that can operationalize agent registries, access controls, and auditability across Microsoft 365, CRM, and project-management ecosystems.
Governance and interoperability are also among the most monetizable gaps as enterprises accelerate agentic workflows ahead of policy and control maturity. SAP has highlighted governance readiness constraints in 2026 survey findings, and SAPs May 2026 expansion with Anthropic to bring Claude into SAP Business AI Platform and Joule underscores the multi-model reality enterprises face when managing agents across suites. This supports demand for security and compliance overlays, data-residency aligned architectures (including sovereign-cloud), and integration services that reconcile identity, logging, and policy enforcement across collaboration, business applications, and data platforms.
Recent Industry Developments in Enterprise Collaboration Market
- July 2026: Microsoft announced a public preview of SharePoint Copilot Apps, enabling developers to create guided, action-oriented experiences within Microsoft 365 Copilot. This expands the extensibility layer around Copilot and encourages deeper third-party and in-house workflow automation inside collaboration and content hubs.
- June 2026: Microsoft and Atos Group expanded their strategic collaboration to scale secure agentic AI across Atos workforce and clients, including deployment of Microsoft 365 Copilot E7 to 56,000 employees. The partnership reinforces enterprise-grade adoption of agentic collaboration capabilities and increases demand for services-led rollout, governance, and security integration.
- May 2026: SAP announced an expanded collaboration with Anthropic to embed Claude agentic AI into SAP Business AI Platform and the Joule assistant. This strengthens multi-model AI options inside enterprise work systems and elevates integration requirements between collaboration interfaces, business applications, and governed data foundations.


Enterprise Collaboration Market Report Scope and Research Methodology
Market Definition and Coverage
For this methodology, the enterprise collaboration market is defined as revenue generated from software and related services that help employees communicate, share content, and coordinate work across teams and locations within an organization.
Scope exclusions: Consumer-only messaging apps and basic email clients are excluded from the market values.
Segments Covered in This Report
- By Component
- Software
- Services
- By Deployment Type
- Cloud-based
- On-premise
- By Application
- Communication Tools
- Conferencing Tools
- Coordination / Project-Mgmt Tools
- Social and Knowledge-Sharing Platforms
- By Organisation Size
- Large Enterprises
- Small and Medium Enterprises (SMEs)
- By End-user Industry
- IT and Telecommunication
- BFSI
- Retail and Consumer Goods
- Healthcare and Life Sciences
- Education
- Transportation and Logistics
- Travel and Hospitality
- Other Industries
- By Geography
- North America
- United States
- Canada
- Mexico
- Europe
- Germany
- United Kingdom
- France
- Italy
- Spain
- Russia
- Rest of Europe
- Asia-Pacific
- China
- Japan
- South Korea
- India
- ASEAN
- Australia and New Zealand
- Rest of Asia-Pacific
- South America
- Brazil
- Argentina
- Rest of South America
- Middle East and Africa
- Middle East
- Saudi Arabia
- UAE
- Turkey
- Rest of Middle East
- Africa
- South Africa
- Nigeria
- Rest of Africa
- Middle East
- North America
Data Sources, Market Sizing, and Validation
Desk Research
Desk research is used to set up the model structure and to anchor assumptions we can check against public data. We refer to sources such as the US Bureau of Labor Statistics (employment and wage trends by industry), the US Census Bureau and OECD datasets (business formation and enterprise counts), the International Telecommunication Union (connectivity indicators), and the World Bank (macroeconomic series that affect IT spend cycles).
On the industry side, we review company annual reports, investor presentations, product documentation, and credible press coverage to track packaging changes and shifts in deployment. When disclosures are limited, paid subscriptions for company financials and intelligence, news and financials, and patent databases are used to speed up data capture and to cross-check timelines for product roadmaps. The desk research source list above is illustrative and not exhaustive, since other references were used for data collection, validation, and clarification.
Primary Interviews and Surveys
Primary work is used to confirm what buyers actually budget for and what gets renewed, since collaboration tools are often bundled and pricing can shift during contract cycles. We speak with software providers, channel partners, IT decision-makers, and enterprise users across APAC, EMEA, and the Americas, then use these inputs to fill data gaps, test adoption assumptions, and sanity-check the final market curve.
Distribution of primary research fieldwork respondents
| Company type | Respondent position | Region |
|---|---|---|
| Top tier: 25% | CXOs: 14% | APAC: 44% |
| Mid tier: 61% | Functional/Unit leaders: 40% | EMEA: 33% |
| Smaller Players: 14% | Managers: 46% | Americas: 23% |
Market-Sizing & Forecasting
Sizing starts with a top-down reconstruction of the addressable enterprise software spend pool, then applies collaboration category share and adoption by deployment type (cloud, on-premise, and hybrid) across regions. After that build, the totals are corroborated with selective bottom-up approximations from sampled supplier revenues, channel checks, and a simple ASP times active-seat volume approach for a few representative use cases.
Key inputs that keep the model grounded include the enterprise employee base and hybrid work intensity, average knowledge-worker penetration by industry, subscription seat pricing ranges by plan tier, service attach rates for integration and migration work, and renewal cycles that shift spend between years. When disclosures are limited, gaps are handled by proxy indicators like IT spending growth and headcount trends, then adjusted using interview-led inputs so the final numbers still reflect how buyers contract and renew.
For forecasting, we use scenario analysis supported by a light multivariate regression view, where growth is linked to variables such as enterprise employment, cloud adoption pace, macro IT budget expectations, and security and compliance requirements that can slow deployments. Final forward values are reviewed with experts to keep the trend realistic in years with weaker budget sentiment.
Data Validation & Update Cycle
Validation is done through multiple checks, where model outputs are compared with independent signals such as enterprise software spending trends, vendor-reported subscription momentum, and region-level IT investment direction. If an outlier shows up, assumptions are revisited, and we re-contact selected interviewees when the variance cannot be explained by pricing or mix changes.
Before sign-off, the dataset and calculations go through a step-by-step analyst review so definitional alignment and currency conversions are consistent across years. Reports are refreshed annually, and interim updates are made when material events occur, such as major licensing changes, large M&A activity, or sharp macro shifts. Right before delivery, a final pass is completed so clients receive the most current view available.
Mordor Intelligence's Enterprise Collaboration Market Size Measured Against Other Published Estimates
Published market numbers for enterprise collaboration can differ even when the topic sounds similar, since each publisher sets its own scope and then makes choices about how to treat bundles, services, and the deployment mix. Differences also show up when base years vary, when forecasts lean conservative or aggressive, and when currency timing is not aligned.
The main gap comes from what is counted as collaboration revenue versus adjacent communications or productivity spend, and how services are treated when tools are implemented or integrated. Some estimates also mix broader categories like unified communications and conferencing into the same total, or apply faster seat growth without checking renewal cycles and downgrade behavior. The scope and inclusion rules used by Mordor Intelligence separate enterprise collaboration software and related services from consumer tools and basic email, which narrows the number but keeps it tied to what enterprises actually budget for.
Benchmark comparison
| Source | Market Size | Gaps in Research Methodology |
|---|---|---|
| Mordor Intelligence | USD 73.41 B (2026) | |
| Global Consultancy A | USD 66.43 B (2026) | Uses a different base-year framing around 2025 and applies a broader segmentation structure where category mapping can undercount integration-heavy deployments, which typically pushes the 2026 point estimate lower versus a revenue-in-scope view. |
| Industry Portal B | USD 56.80 B (2025) | Anchors the estimate to a prior year and may rely on generalized adoption growth assumptions without clearly separating enterprise-only spend from adjacent collaboration-like tools, which can shift values depending on what is included and the currency timing used. |
Looking across the three numbers, most of the spread can be explained by scope alignment, year selection, and how bundled offerings and services are handled. By keeping the inputs traceable to enterprise headcount, seat pricing, deployment mix, and renewal behavior, we can explain each step and adjust assumptions when validation checks indicate a mismatch.


Key Questions Answered in the Report
What is the current size of the enterprise collaboration market?
The enterprise collaboration market size reached USD 73.41 billion in 2026 and is forecast to climb to USD 135.96 billion by 2031 at a 13.12% CAGR.
Which component segment is growing fastest?
Services are expanding at 14.22% CAGR because enterprises need expert support for AI integration, workflow redesign, and ongoing optimization.
Why is Asia-Pacific the fastest-growing region?
Aggressive 5G investments, supportive government policy, and a mobile-first workforce drive a 13.76% CAGR for Asia-Pacific through 2031.
How are data-sovereignty rules affecting deployment decisions?
Regulations encourage hybrid and sovereign-cloud models; on-premise retains 67.60% share, but compliant cloud offerings grow at 14.26% CAGR.
What role do generative-AI copilots play in market expansion?
Copilots automate meeting notes, document creation, and analytics tasks, cutting routine workloads by 30-50% and fueling platform upgrades.
Which industries are accelerating adoption the most?
Healthcare and life sciences lead with 13.42% CAGR due to secure messaging, AI-aided diagnosis support, and strict compliance needs.
Page last updated on:


