
Engineered Foam Market Size and Share
Market Overview
| Study Period | 2020 - 2031 |
|---|---|
| Market Size (2026) | USD 128.81 Billion |
| Market Size (2031) | USD 158.03 Billion |
| Growth Rate (2026 - 2031) | 4.17 % |
| Fastest Growing Market | Asia Pacific |
| Largest Market | Asia Pacific |
| Market Concentration | Medium |
Major Players *Disclaimer: Major Players sorted in no particular order Image © Mordor Intelligence. Reuse requires attribution under CC BY 4.0. | |
Engineered Foam Market Analysis by Mordor Intelligence
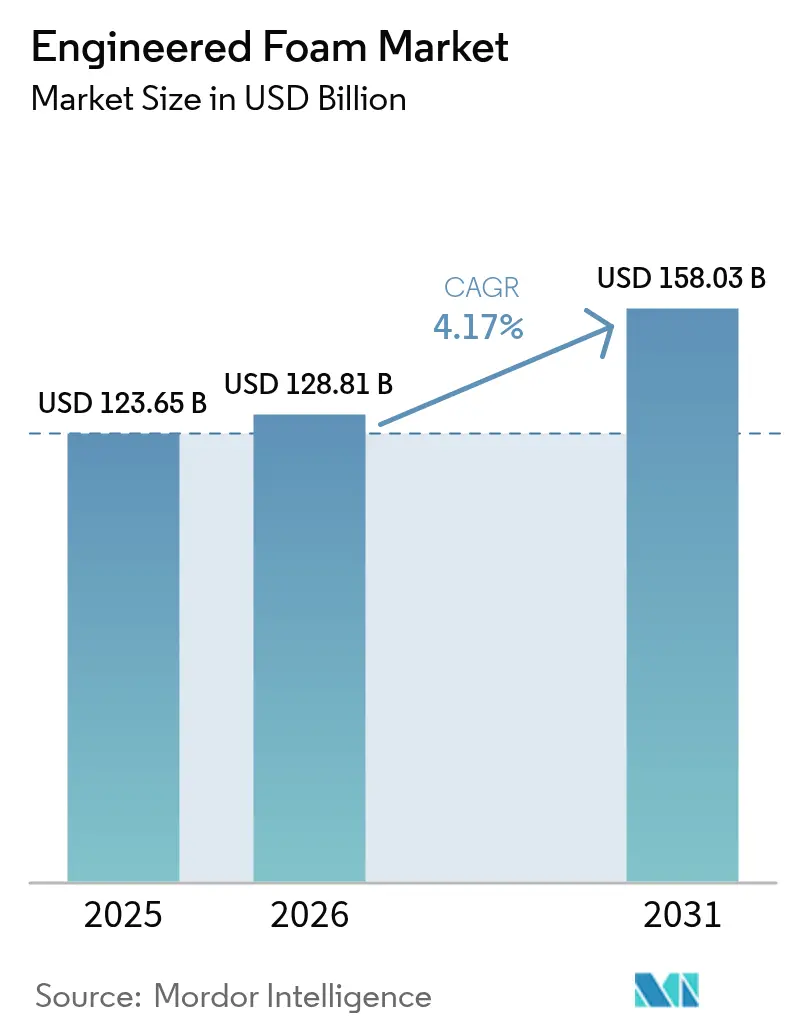
Engineered Foam Market size market size in 2026 is estimated at USD 128.81 billion, growing from 2025 value of USD 123.65 billion with 2031 projections showing USD 158.03 billion, growing at 4.17% CAGR over 2026-2031. Regulations that raise building-envelope R-values, automakers’ appetite for lighter and quieter electric vehicles, and the phase-down of high-GWP blowing agents collectively accelerate volume growth. Producers are also benefiting from e-commerce packaging demand and from early hydrogen-infrastructure pilots that require cryogenic foams. Asia-Pacific anchors supply and demand thanks to new TPU capacity in China and large-scale civil-engineering projects, while North America acts as a regulatory bellwether for low-GWP spray systems. Short-term margin pressure stems from isocyanate and polyol price swings, but integrated suppliers that lock in raw-material streams and commercialize bio-based polyols are positioned to defend profitability.
Key Report Takeaways
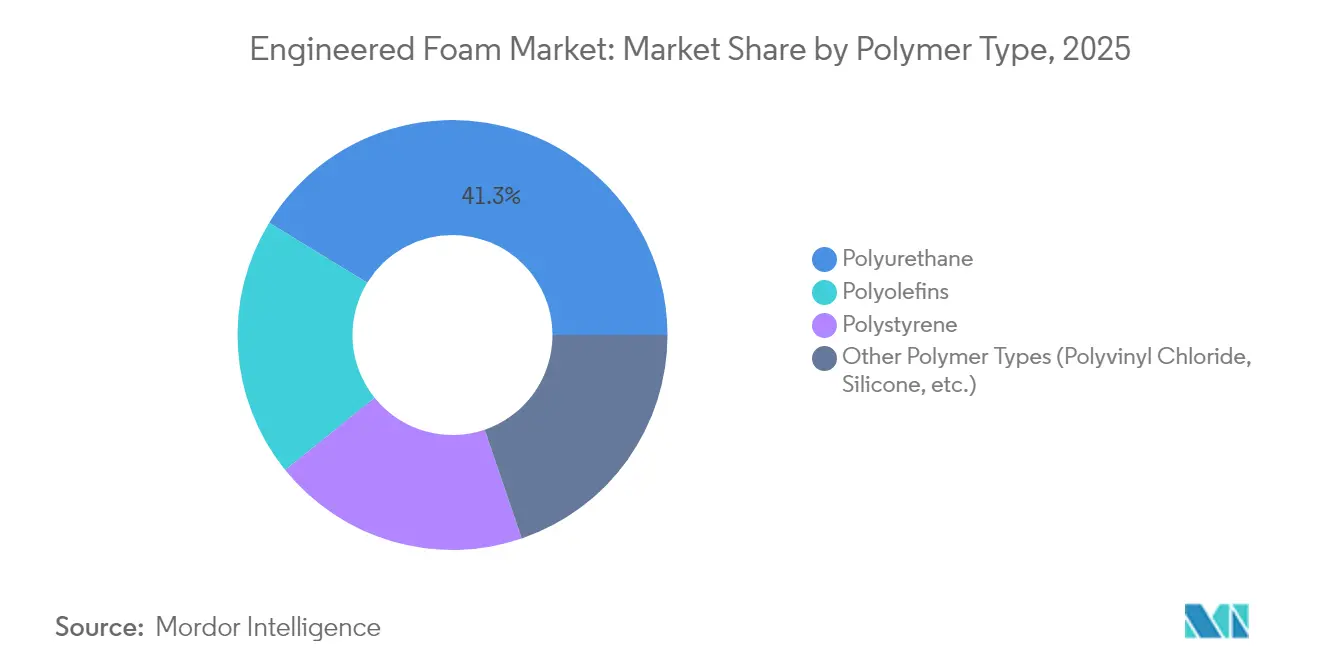
- By polymer type, polyurethane led with 41.25% engineered foam market share in 2025, whereas the Other Polymer Types segment is projected to widen at a 5.06% CAGR through 2031.
- By foam type, flexible foams accounted for 52.30% revenue in 2025; spray foams are forecast to post the fastest expansion at 5.03% CAGR to 2031.
- By function, thermal-insulation applications held 39.55% of the engineered foam market size in 2025 and structural core and lightweighting foams are advancing at a 4.85% CAGR through 2031.
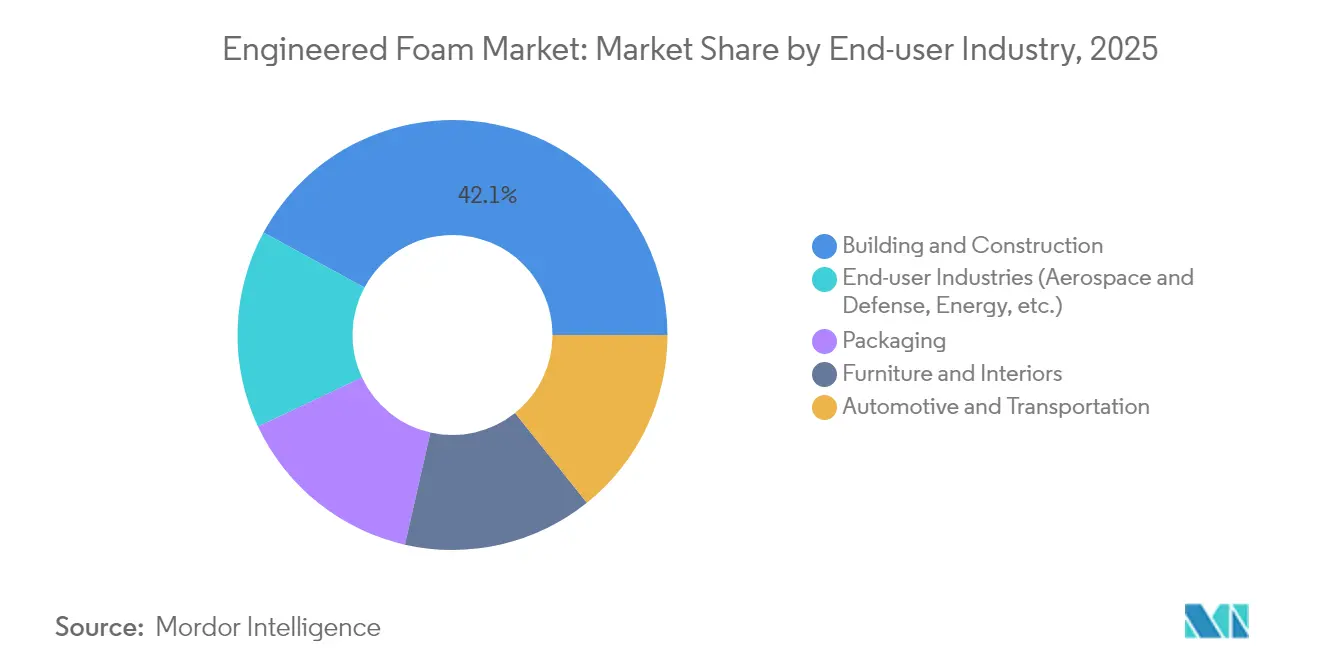
- By end-user industry, building and construction commanded 42.10% revenue in 2025, while the aggregate of aerospace, energy, and other niche industries is expected to climb at a 5.12% CAGR, through 2031.
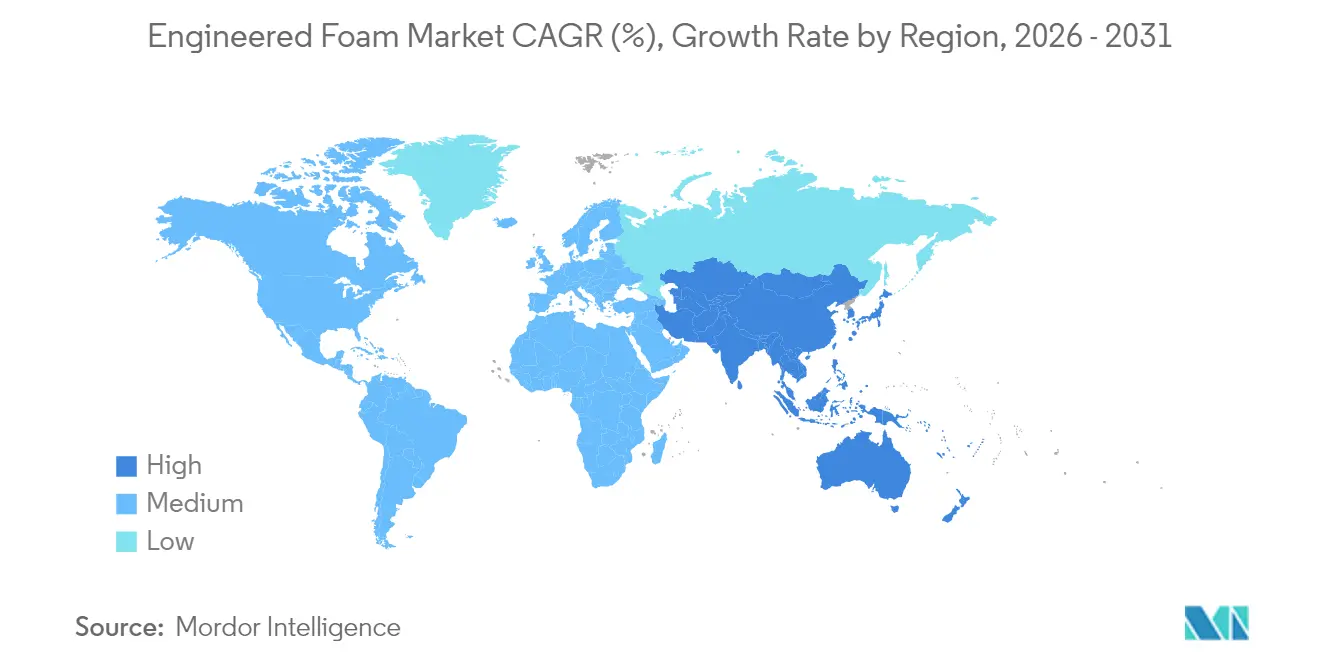
- By geography, Asia-Pacific captured 44.30% of global demand in 2025 and is simultaneously slated to grow at 4.90% CAGR through 2031
Note: Market size and forecast figures in this report are generated using Mordor Intelligence’s proprietary estimation framework, updated with the latest available data and insights as of 2026.
Market Trends and Insights
Drivers Impact Analysis of Engineered Foam Market*
| Driver | (~) % Impact on CAGR Forecast | Geographic Relevance | Impact Timeline |
|---|---|---|---|
| Surging Demand for Lightweight, Fuel-Efficient Materials in Automotive | +0.8% | Global, with concentration in Asia-Pacific and North America | Medium term (2-4 years) |
| Stringent Building Energy Codes Driving Demand for Engineered Insulation Foams | +0.7% | North America s EU, expanding to Asia-Pacific | Long term (≥ 4 years) |
| Expanding E-Commerce Boosting Protective Foam Packaging | +0.5% | Global, led by North America and Asia-Pacific | Short term (≤ 2 years) |
| Rapid Adoption of Acoustic Metamaterial Foams in EV Cabins | +0.4% | Asia-Pacific core, spill-over to North America and EU | Medium term (2-4 years) |
| Growing Demand for Cryogenic-Capable Foams for Hydrogen Infrastructure Insulation | +0.3% | EU and North America, early adoption in Japan | Long term (≥ 4 years) |
| Source: Mordor Intelligence | |||
Surging demand for lightweight, fuel-efficient materials in automotive
Automakers target weight savings to shore up EV driving range and meet fleet-average CO₂ limits. Polyurethane systems such as Huntsman’s SHOKLESS™ provide density windows that secure battery modules while cutting mass Life-cycle analyses show natural-fiber composites cut energy demand versus metals, reinforcing the appeal of hybrid foam–composite architectures. Mexico’s 13% output surge and its rise to fourth-largest polyurethane market underline the regional pull created by near-shoring strategies. As EV skateboard platforms proliferate, foams that fuse structural support, thermal management, and NVH damping shift from optional to critical components in the engineered foam market.
Stringent building energy codes driving demand for engineered insulation foams
The 2021 IECC mandates exterior continuous insulation in climate zones 4 and 5, cementing closed-cell spray polyurethane foam’s R-7 per inch profile. Federal adoption lifts new-home efficiency by 34.4% compared with 2009 baselines, even after a USD 7 229 incremental build cost[1]Federal Register, “Adoption of Energy Efficiency Standards for New Construction of HUD- and USDA-Financed Housing,” federalregister.gov. Huntsman estimates that insulating the existing US housing stock could save 648 billion kWh a year—power equivalent to taking 38.9 million cars off the road. Commercial builders seeking LEED points specify rigid panels blown with greater than 10 GWP agents, accelerating the conversion away from HFC-141b. Consequently, code pressure channels the bulk of insulation volume toward higher-performance foams in the engineered foam market.
Expanding e-commerce boosting protective foam packaging
Online order volumes keep rising, forcing brand owners to trim damage rates without inflating dimensional weight. Sealed Air’s closed-cell polyethylene profiles achieve that balance, replacing bulkier corrugated designs while protecting delicate items. The firm’s Cellu-Pro™ range embeds 95% recycled content, meeting EU recycled-material quotas. Patent filings around starch-derived biodegradable cushions reinforce momentum toward circular packaging. These shifts translate into continuous order books for converters and bolster the engineered foam market.
Rapid adoption of acoustic metamaterial foams in EV cabins
With ICE noise gone, EV interiors expose occupants to wind and tire frequencies. Research shows aerogel-loaded non-wovens achieve a 0.33 average absorption coefficient at 500–1 600 Hz while retaining 0.026 W/mK thermal conductivity. Covestro’s Bayfit® cavity fillers shave 3–5 dB from cabin noise without appreciable weight gain. Similar metamaterial logic now migrates into 100% recyclable aircraft seat foams, evidencing cross-sector pull. NVH performance therefore ranks among the most bankable growth levers inside the engineered foam market.
Restraints Impact Analysis of Engineered Foam Market*
| Restraint | (~) % Impact on CAGR Forecast | Geographic Relevance | Impact Timeline |
|---|---|---|---|
| Volatility in Isocyanate and Polyol Prices | -0.6% | Global, particularly impacting North America and Asia-Pacific | Short term (≤ 2 years) |
| Tightening VOC Blowing-Agent Regulations | -0.4% | North America and EU, expanding globally | Medium term (2-4 years) |
| Scarcity of Certified Bio-Based Polyol Feedstock | -0.3% | Global, with acute shortages in developed markets | Long term (≥ 4 years) |
| Source: Mordor Intelligence | |||
Volatility in isocyanate and polyol prices
MDI spot indices swung double-digit in 2024, lifting polyurethane resin quotes even as automotive demand dipped 25% BASF’s buy-out of the Alsachimie PA 6.6 joint venture secures adipic-acid and HMD streams, illustrating how backward integration hedges cost risk. Mid-tier converters rely on multi-source contracts, yet price lags still compress margins across the engineered foam market.
Tightening VOC blowing-agent regulations
The US EPA bans HFC-blown spray foams with GWPs above 150 from January 2025, obliging formulators to switch to HFOs and hydrocarbons[2]American Chemistry Council, “State Phase-Down of HFCs in the Spray Foam Industry,” americanchemistry.com . Europe’s F-gas overhaul follows suit. Low-GWP agents impose higher raw-material bills and flammability-handling costs, thinning out smaller applicators. Compliance complexity thus tempers near-term volume in pockets of the engineered foam market even as long-run sustainability arcs favor compliant suppliers.
*Our forecasts treat driver/restraint impacts as directional, not additive. The impact forecasts reflect baseline growth, mix effects, and variable interactions.
Engineered Foam Market Segment Analysis
By Polymer Type:
Portfolio diversification gathers pacePolyurethane retained the largest engineered foam market share at 41.25% in 2025, rooted in closed-cell systems that deliver R-7 per inch and dominate cold-chain and roofing builds. Nonetheless, bio-based routes, non-isocyanate chemistries, and CO₂-modified backbones fuel a 5.06% CAGR for the Other Polymer Types segment. BASF’s Ludwigshafen EPS expansion targets appliance and packaging niches, while Covestro’s prototype rigid foam with 20% captured CO₂ hits spec parity with petro-based incumbents.
Second-generation polyolefins improve recyclability, giving e-commerce shippers a low-density option that meets circular pledges. Specialty silicones penetrate rolling-stock interiors thanks to intrinsic flame-smoke-toxicity compliance. As feedstock diversification deepens, polyurethane’s revenue dominance will narrow slightly, yet it will still anchor engineered foam market size in 2030 because of unmatched insulation efficiency and mature supply chains.



By Foam Type:
Spray systems capture code-driven upsideFlexible foams accounted for 52.30% revenue in 2025, buoyed by bedding, furniture, and seat applications. Rigid boards preserved food-retail cold lanes, and elastomeric foams served HVAC gasket needs. Spray foams, however, are slated for a 5.03% CAGR—fastest in class—because they meet air-sealing and insulation codes in one pass, raising their engineered foam market size share year-over-year. Huntsman Building Solutions’ Icynene Series reaches 7.4 per-inch R-value and rolls out in low-pressure kits for remodelers.
HFO-blown chemistry now dominates new launches, while roofing contractors exploit high-lift closed-cell variants to curb labor hours. As insurers tighten energy-loss clauses, spray foam penetration could top 20% of North American wall-and-roof insulation by 2030, further enlarging the engineered foam market.
By Function:
Insulation leads; lightweighting acceleratesThermal-insulation duties held 39.55% of 2025 revenue, the largest slice of the engineered foam market size, because codes and cold-chain logistics value low λ materials. Structural core and lightweighting foams log a 4.85% CAGR, helped by sandwich-panel use in battery enclosures and 3D-printed lattice cores that shed 35% weight versus honeycombs.
Acoustic and vibration foams ride EV demand, while energy-absorption cushions expand with omnichannel retail. Buoyancy foams hold steady in marine energy and recreation. Function-level diversity shelters producers from sector cyclicality and enlarges participation in the engineered foam market.
By End-user Industry:
Construction still rules, niche sectors outpaceBuilding and construction contributed 42.10% of revenue in 2025, underpinned by code-mandated exterior insulation. Yet aerospace, hydrogen energy, and medical devices cluster into the Other End-user Industries segment, which is expanding at 5.12% CAGR. Aircraft seat makers adopt fully recyclable foams to cut turnaround emissions, and cryogenic insulation systems guard liquid-hydrogen tanks at –253 °C. These higher-value niches diversify the engineered foam market revenue stream beyond cyclical housing trends.
Geography Analysis
APAC Engineered Foam Market
Asia-Pacific’s 44.30% share and 4.90% CAGR reflect a full-spectrum industrial ecosystem that spans civil construction, auto assembly, and consumer electronics. China’s renewable-powered TPU complex in Zhanjiang underscores commitment to local value chains. Japan refines NVH foams for premium EVs, and India’s construction boom absorbs rigid boards and spray systems in new urban housing. South Korea contributes advanced resins for memory-chip packaging, whereas ASEAN factories gain share by offering cost-competitive conversion. Together these dynamics sustain the engineered foam market’s highest regional momentum.
North America Engineered Foam Market
North America combines strict building codes with capital access, supporting leadership in low-GWP spray-foam capacity. Huntsman’s Icynene Series and regionwide installer training push open-cell products deeper into retrofit attic jobs. Mexico’s near-shoring wave powers automotive PU usage, and Canada’s cold climate bolsters insulation demand. Upside persists, yet feedstock volatility remains a cost wild card for engineered foam market players across the region.
Europe Engineered Foam Market
Europe plays sustainability spearhead, mainstreaming CO₂-based polyols and bio-circular attributions. Covestro’s rigid-foam prototypes with 20% captured CO₂ set new life-cycle benchmarks. Nordic housing stimuli amplify demand for high-R SIP panels, whereas Germany’s automotive tier system pilots flame-retardant lightweight cores for EV battery trays. Regulatory certainty around F-gas and VOC ceilings helps long-term investment planning, anchoring the engineered foam market’s European strategy.

Regulatory Landscape
Regulation is tightening around both climate impact and chemical safety across key engineered-foam end uses. Building codes and fluorinated-gas policy are influencing product selection for insulation and spray foam. In the United States, the 2021 IECC materially lifts baseline building-efficiency requirements and reinforces demand for higher-R engineered insulation systems. The EPA ban on HFC-blown spray foams with GWPs above 150 from January 2025 is also accelerating adoption of HFO- and hydrocarbon-blown formulations in SPF applications.
In Europe, REACH remains the primary compliance framework for substances used across foam chemistries, and recent amendments are adding pressure on legacy formulations and additives. In October 2025, the European Commission adopted Regulation (EU) 2025/1988 amending REACH Annex XVII to restrict PFAS in firefighting foams, with an enforcement milestone in October 2026 for labeling requirements and usage restrictions for foams containing at or above 1 mg/L PFAS. In June 2026, Regulation (EU) 2026/1168 further amended REACH Annex XVII for synthetic polymer microparticles, adding another compliance layer for formulators and converters that use polymeric additives and functional fillers in foam systems.
Value Chain Analysis
The engineered foam value chain starts with upstream petrochemical and specialty-chemical feedstocks, then moves into system formulation, foam conversion, and distribution into building and construction, automotive and transportation, packaging, furniture and interiors, and other niche end users. Major upstream suppliers such as BASF, Covestro, Dow, SABIC, and Huntsman provide core inputs including isocyanates, polyols, styrenics, and polyolefins. These are compounded and formulated into foam systems or resins, while converters and foam product manufacturers process them via slabstock, molding, extrusion, lamination, and spray application into engineered products such as rigid insulation boards and panels, flexible cushioning, protective packaging, and NVH components. Sales typically flow either directly to OEMs and builders or through distributor and installer networks.
Value capture is shifting toward formulation know-how, including low-GWP blowing-agent packages and fire-safety compliant systems, as well as EV-focused NVH and thermal management. Supply assurance for volatile inputs such as MDI and polyether polyols also carries more weight. The chain remains exposed to raw-material price swings and logistics disruptions, which can lengthen lead times and raise working-capital needs for converters, particularly in regions dependent on imported liquid intermediates. Downstream, specification and compliance requirements in construction and transportation increase the role of technical service and installer training, notably for spray foam, along with documentation such as environmental declarations. This reinforces advantages for integrated suppliers that can bundle materials, technical support, and compliance readiness.
Competitive Landscape
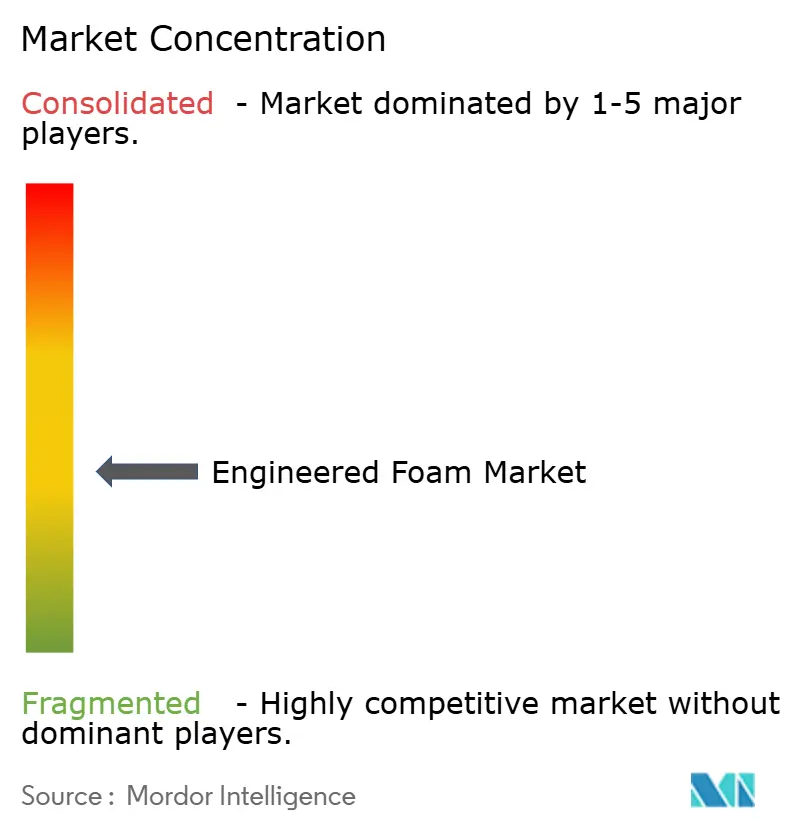
Moderate fragmentation defines the engineered foam market. Carpenter’s purchase of Recticel’s Engineered Foams Division for EUR 656 million vaults it to the largest vertically integrated flexible-foam supplier. Armacell’s full buy-out of AJA boosts aerogel-based high-temperature insulation capacity beyond 700 t/y, opening LNG and district-heating applications. BASF’s Alsachimie acquisition fortifies upstream control over polyamide precursors, illustrating vertical-integration logic.
Technology differentiation now trumps volume. Covestro markets Bayfit® NVH fillers that deliver 3 dB attenuation at equal mass, earning premium placements in EV platforms. Huntsman’s SHOKLESS™ resists thermal runaway in battery packs, tapping the EV safety up-cycle. Dow’s bio-based NORDEL™ REN EPDM signals a push to renewable elastomer matrices. Companies with R&D heft, captive monomer streams, and regulatory-affairs expertise therefore hold strategic high ground.
Mid-tier converters hedge raw-material risk via tolling agreements and localized recycling, but margin resilience still trails that of integrated peers. Private-equity funds remain active buyers, targeting specialty formulators with aerospace and medical access where price realizations are higher. Overall, intellectual-property breadth, low-carbon credentials, and M&A scale will dictate share gains inside the engineered foam market.
Engineered Foam Industry Leaders
BASF SE
Dow Inc.
Huntsman Corporation
Armacell International SA
Carpenter Co.
- *Disclaimer: Major Players sorted in no particular order
Engineered Foam Market Companies Covered in this Report
- BASF SE
- Armacell International SA
- Carpenter Co.
- Covestro AG
- Dow Inc.
- Evonik Industries AG
- Huntsman Corporation
- Kaneka Corporation
- Rogers Foam Corporation
- SABIC
- Sealed Air
- Trelleborg
- Woodbridge
- Zotefoams plc

Market Opportunities and Future Outlook
A near-term whitespace sits at the intersection of lower-embodied-carbon insulation and code-driven performance, especially in North America where spray foam demand is pulled by air-sealing requirements and low-GWP mandates. BASF introduced ELASTOSPRAY BMB isocyanate in April 2026 for the North American spray polyurethane foam market, signaling supplier prioritization of biomass balance inputs in SPF systems and expanding the options for builders and specifiers seeking lower-carbon routes without changing application methods.
Circularity and end-of-life solutions for polyurethane foams remain a major unmet need, especially for cross-linked and thermoset systems that are poorly served by mechanical recycling. Covestro and Fraunhofer UMSICHT signed a contract in March 2026 to develop a 2 kt per year smart pyrolysis pilot plant for rigid polyurethane foam recycling, creating a concrete pathway for scaling chemical recycling for hard-to-recycle foam streams. In packaging and consumer-facing applications, demand for drop-in bio-based alternatives creates room for new foam chemistries that can use existing converting assets. Investments such as SEKISUI Voltek opening a USD 39 million expansion in Coldwater, Michigan in May 2026 also point to continued capital allocation to high-performance closed-cell foam capacity close to end markets. Separately, greater use of automation and data-driven formulation tools is being deployed to reduce scrap and accelerate product development cycles, supporting suppliers and converters that can translate process capability into faster qualification with OEMs and building-product channels.
Recent Industry Developments in Engineered Foam Market
- April 2026: BASF launched ELASTOSPRAY BMB isocyanate for the North American spray polyurethane foam market, extending biomass balance options into SPF systems. The launch supports contractors and specifiers working under low-GWP and embodied-carbon requirements by offering a route to reduce footprint while maintaining familiar performance and application windows.
- November 2025: Carpenter announced the ZIPR mattress, using an adhesive-free assembly approach designed to improve disassembly and recyclability at end of life. The product move reinforces circular-design positioning in flexible foam applications and signals increasing customer pull for engineered foam solutions aligned with recycling and take-back narratives.
- July 2024: Sea-Land Chemical Company announced a distribution agreement with Carpenter to expand access to specialty chemical solutions used across foam-related applications. Broader channel coverage can improve regional supply responsiveness for converters and formulators, particularly when feedstock volatility and lead-time variability tighten procurement planning.


Engineered Foam Market Report Scope and Research Methodology
Market Definition and Coverage
For this study, the engineered foam market covers the value of engineered polymer foams sold into end uses where performance is designed for insulation, cushioning, sealing, vibration control, or lightweighting, across major regions.
Scope exclusions: Exclusions include non-foam solid plastics, mineral wool and fiberglass insulation, and non-polymer specialty porous materials that are not manufactured or sold as foams.
Segments Covered in This Report
- By Polymer Type
- Polyurethane
- Polyolefins
- Polystyrene
- Other Polymer Types (Polyvinyl Chloride, Silicone, etc.)
- By Foam Type
- Flexible
- Rigid
- Spray
- Other Foam Types (Elastomeric, etc.)
- By Function
- Thermal Insulation
- Acoustic and Vibration Control
- Energy Absorption and Cushioning
- Buoyancy and Floatation
- Structural Core and Lightweighting
- By End-user Industry
- Building and Construction
- Packaging
- Furniture and Interiors
- Automotive and Transportation
- End-user Industries (Aerospace and Defense, Energy, etc.)
- By Geography
- Asia-Pacific
- China
- Japan
- India
- South Korea
- ASEAN Countries
- Rest of Asia-Pacific
- North America
- United States
- Canada
- Mexico
- Europe
- Germany
- United Kingdom
- France
- Italy
- Spain
- Russia
- NORDIC Countries
- Rest of Europe
- South America
- Brazil
- Argentina
- Rest of South America
- Middle-East and Africa
- Saudi Arabia
- South Africa
- Rest of Middle-East and Africa
- Asia-Pacific
Data Sources, Market Sizing, and Validation
Desk Research
Desk work starts by mapping the supply chain and demand signals that can be checked without paywalls, so our inputs stay explainable. We mainly lean on public sources such as US Census Bureau manufacturing and trade releases, Eurostat industrial statistics, UN Comtrade trade flows, and IEA buildings and energy efficiency indicators, which help anchor construction and insulation activity.
To cross-check material exposure and application trends, we also review sources such as patent databases for foam formulations, building code and energy standard updates published by regulators, and peer-reviewed polymer and materials journals that discuss blowing agents and foam performance. Company annual reports, investor decks, and reputable press are then used to validate capacity additions, plant outages, and pricing narratives, and a paid subscription for company financials, patent data, and shipment-level import-export data is used selectively when public series is not granular enough. These sources are not exhaustive, and other public and proprietary references were used during data collection, validation, and clarification.
Primary Interviews and Surveys
Primary work is used to pressure-test what desk sources cannot settle cleanly, especially around foam-type mix, use-case intensity, and realistic average selling prices by region. We speak with raw material participants, foam converters, distributors, and large end users across APAC, EMEA, and the Americas, so assumptions on construction cycles, automotive lightweighting needs, and packaging demand reflect what is actually being purchased.
Distribution of primary research fieldwork respondents
| Company type | Respondent position | Region |
|---|---|---|
| Top tier: 33% | CXOs: 15% | APAC: 50% |
| Mid tier: 51% | Functional/Unit leaders: 34% | EMEA: 29% |
| Smaller Players: 16% | Managers: 51% | Americas: 21% |
Market-Sizing & Forecasting
The model is built using a top-down approach, where construction activity, insulation adoption signals, automotive and transport production, and packaging throughput are converted into foam demand pools by applying engineered-foam intensity factors. Once the larger totals are formed, they are corroborated with selective bottom-up approximations like sampled volume by foam type times indicative pricing, plus channel checks on major application areas, and then totals are adjusted when gaps appear.
Key inputs that are tracked include polyurethane and polyolefin feedstock pricing direction, building efficiency code tightening and retrofit rates, vehicle production and interior content trends, e-commerce shipment growth as a proxy for protective packaging, and reported capacity utilization commentary from public filings. For forecasting, we use scenario analysis with a light multivariate regression layer, since demand moves with construction and industrial cycles and respondents usually provide a practical range rather than one point estimate. Where bottom-up checks are thin in smaller countries, per-capita construction spend and import penetration are used as bridging variables, and we document the assumption so it can be revisited later.
Data Validation & Update Cycle
Validation is done by triangulating the final market value against independent signals like regional construction spending, polymer foam trade balances, and the implied volume and price mix by foam type, and then obvious variances are flagged for rework. Outliers are investigated through a second pass on unit conversions, currency timing, and application intensity, followed by an internal peer review before sign-off.
The report is refreshed annually, and interim updates are made when material events occur, such as major plant additions, regulatory shifts on blowing agents, or sharp feedstock price resets. Before delivery, we do a fresh scan of recent indicators and re-contact selected experts if the model starts to drift from current market conditions.
Mordor Intelligence's Engineered Foam Market Size Versus Other Published Estimates
Published market values for engineered foam can look different even when they sound like they cover the same topic, and this usually comes from scope interpretation, base-year pricing, and how quickly assumptions are refreshed. We keep the logic simple enough to follow, but detailed enough that each major end-use driver can be traced back to an input.
Key gaps often show up when one estimate blends standard commodity foams with engineered grades, or when a study counts installer labor and system accessories along with foam material revenue. Currency conversion timing also matters in a market with large cross-border resin flows, and ASP progression can change results if inflation is carried forward without checking it against actual demand softness.
Benchmark comparison
| Source | Market Size | Gaps in Research Methodology |
|---|---|---|
| Mordor Intelligence | USD 123.65 B (2025) | |
| Global Advisory A | USD 126.12 B (2025) | Often treated as a broader value bucket that can roll standard foams and some installed-system add-ons into the same line item, which lifts the reported total versus material-only revenue. |
| Trade Publisher B | USD 74.79 B (2023) | Usually anchored to a narrower application list and an older base year, and it can undercount construction insulation pull-through when regional imports and spray-foam adoption are not fully captured. |
Installed foam system labor and hardware sits outside Mordor Intelligence's scope, which explains why some published figures run higher even when the headline label looks similar. When the scope is kept to engineered foam material revenues and then checked against construction and industrial activity signals, the output becomes easier to reconcile year to year and simpler for clients to stress-test with their own assumptions.


Key Questions Answered in the Report
What is the current engineered foam market size and growth outlook?
The engineered foam market size stands at USD 128.81 billion in 2026 and is expected to reach USD 158.03 billion by 2031, growing at a 4.17% CAGR.
Which polymer type leads the engineered foam market?
Polyurethane holds the top position with 41.25% engineered foam market share in 2025, owing to its superior insulation and structural versatility.
Why is Asia-Pacific the fastest-growing region?
China’s renewable-powered TPU capacity, large infrastructure spending, and rapid EV adoption give Asia-Pacific both the largest share and the fastest 4.90% CAGR through 2031.
How are regulations influencing spray foam demand?
The 2021 IECC and the EPA’s low-GWP mandates are pushing builders toward closed-cell spray polyurethane foam that offers R-7 per inch and air-sealing in one pass.
What innovations are most disruptive in the engineered foam market?
CO₂-based polyols, aerogel-enhanced cryogenic foams, and metamaterial acoustic fillers are reshaping product portfolios and commanding premium pricing.
Page last updated on:


 Your data is secure and never sold or shared.


