Flexible Elastomeric Foam Market Size and Share
Market Overview
| Study Period | 2021 - 2031 |
|---|---|
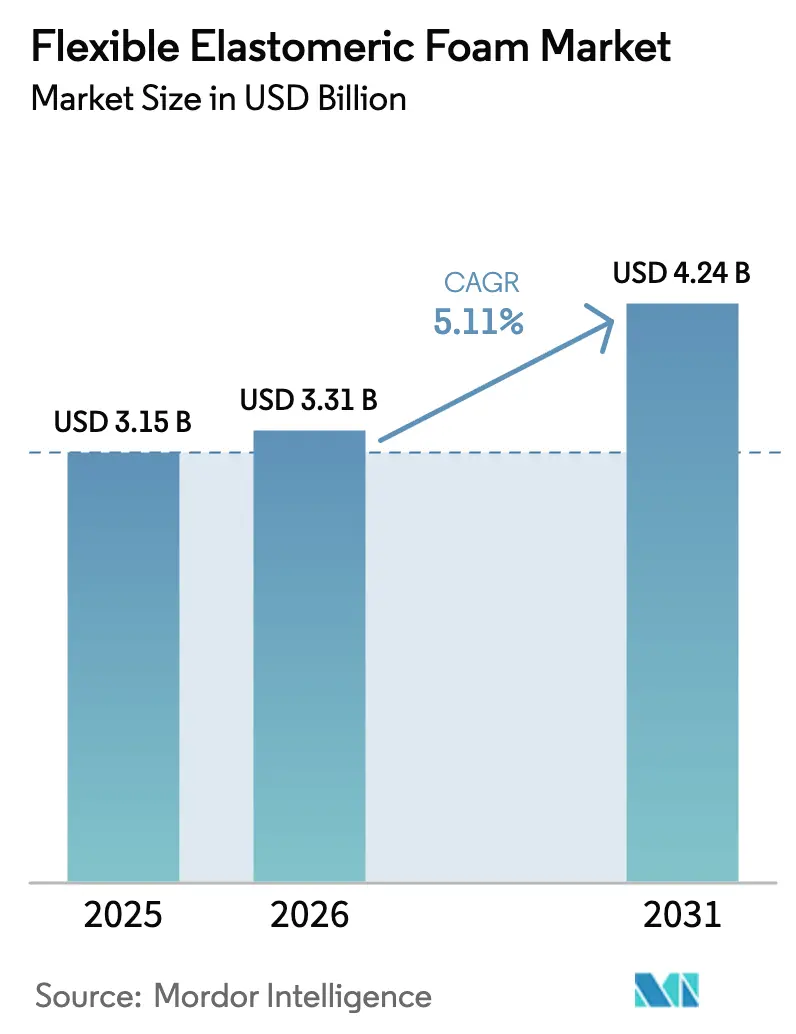
| Market Size (2026) | USD 3.31 Billion |
| Market Size (2031) | USD 4.24 Billion |
| Growth Rate (2025 - 2030) | 5.11% CAGR |
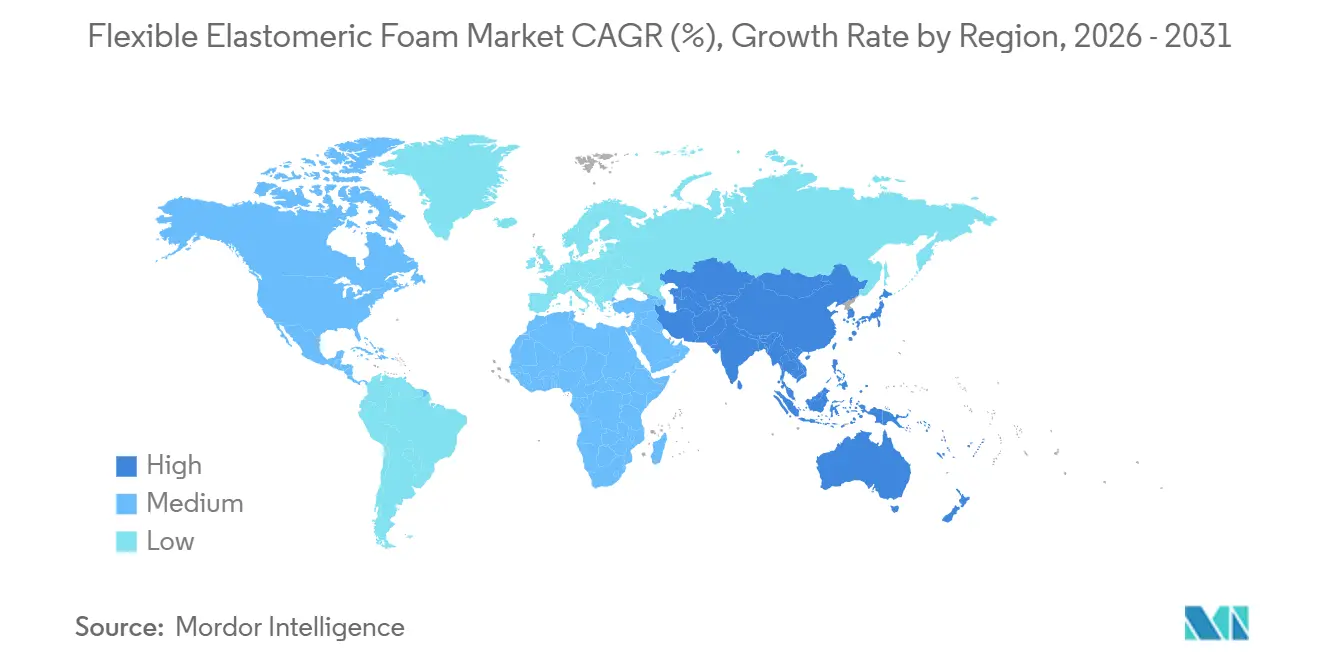
| Fastest Growing Market | Asia Pacific |
| Largest Market | Asia Pacific |
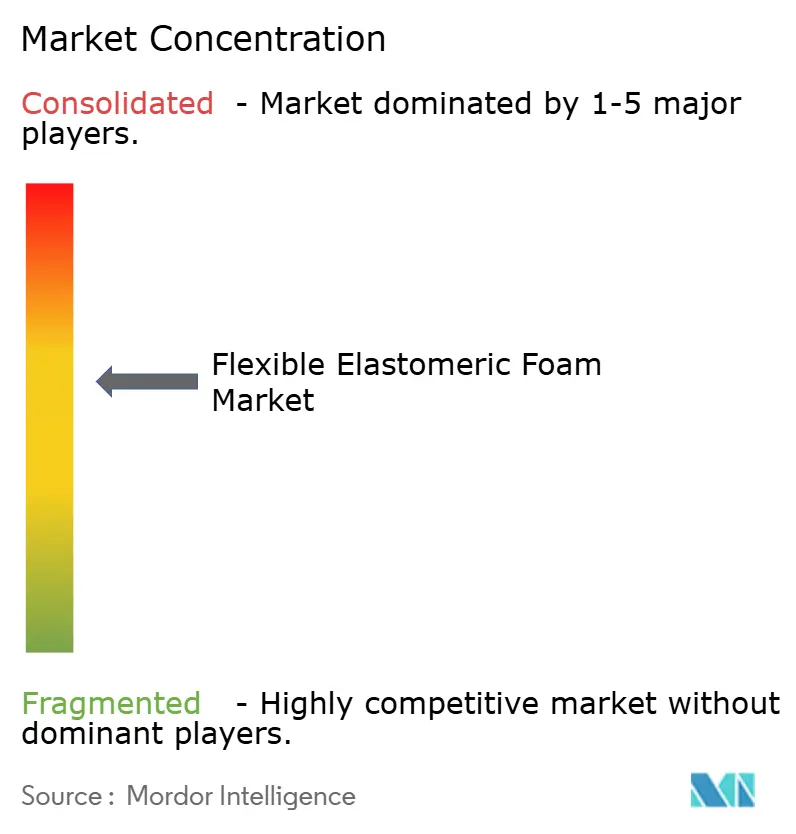
| Market Concentration | Medium |
Major Players *Disclaimer: Major Players sorted in no particular order Image © Mordor Intelligence. Reuse requires attribution under CC BY 4.0. | |
Flexible Elastomeric Foam Market Analysis by Mordor Intelligence
The Flexible Elastomeric Foam Market size was valued at USD 3.15 billion in 2025 and is estimated to grow from USD 3.31 billion in 2026 to reach USD 4.24 billion by 2031, at a CAGR of 5.11% during the forecast period (2026-2031). In the Asia-Pacific region, a surge in building-energy regulations, ongoing retrofits in HVAC and refrigeration, and a swift expansion of cold-chain projects are collectively driving up baseline demand. As regulators phase down high-GWP refrigerants, equipment replacements are occurring sooner than anticipated. Each transition from R-410A to the higher-pressure R-32 or R-454B chillers requires thicker, lower-permeability pipe insulation. This shift is significantly expanding the market for flexible elastomeric foam. Additionally, with supply-chain pressures on butadiene and neoprene, converters are increasingly turning to EPDM. This shift not only diversifies the material mix but also drives innovation in fire-safe, halogen-free, and low-carbon foams. Suppliers that integrate back into aerogel, biomass-balance, and super-critical CO₂ foaming are gaining a competitive edge, especially as customers demand evidence of embodied-carbon reduction.
Key Report Takeaways
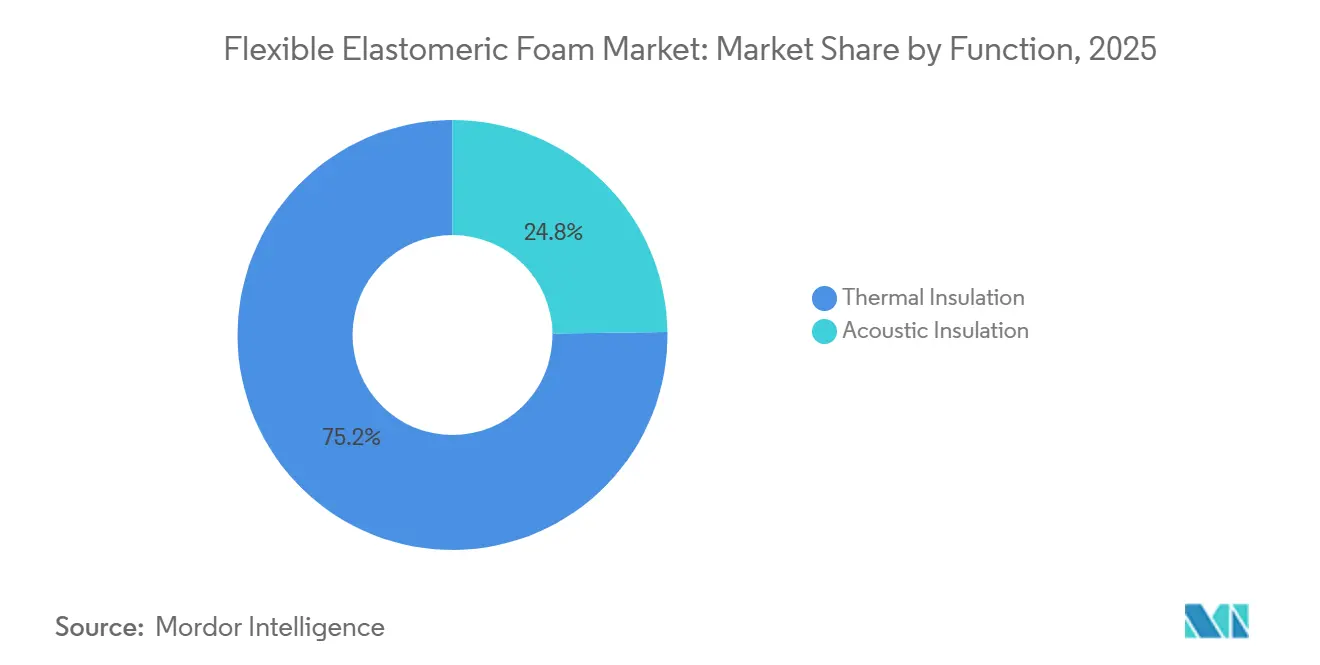
- By function, thermal insulation led with 75.22% of the flexible elastomeric foam market share in 2025 and is projected to post the fastest 5.29% CAGR through 2031.
- By type, nitrile butadiene rubber/polyvinyl chloride accounted for 54.08% of the flexible elastomeric foam market size in 2025, while ethylene propylene diene monomer is forecast to expand at a 6.25% CAGR to 2031.
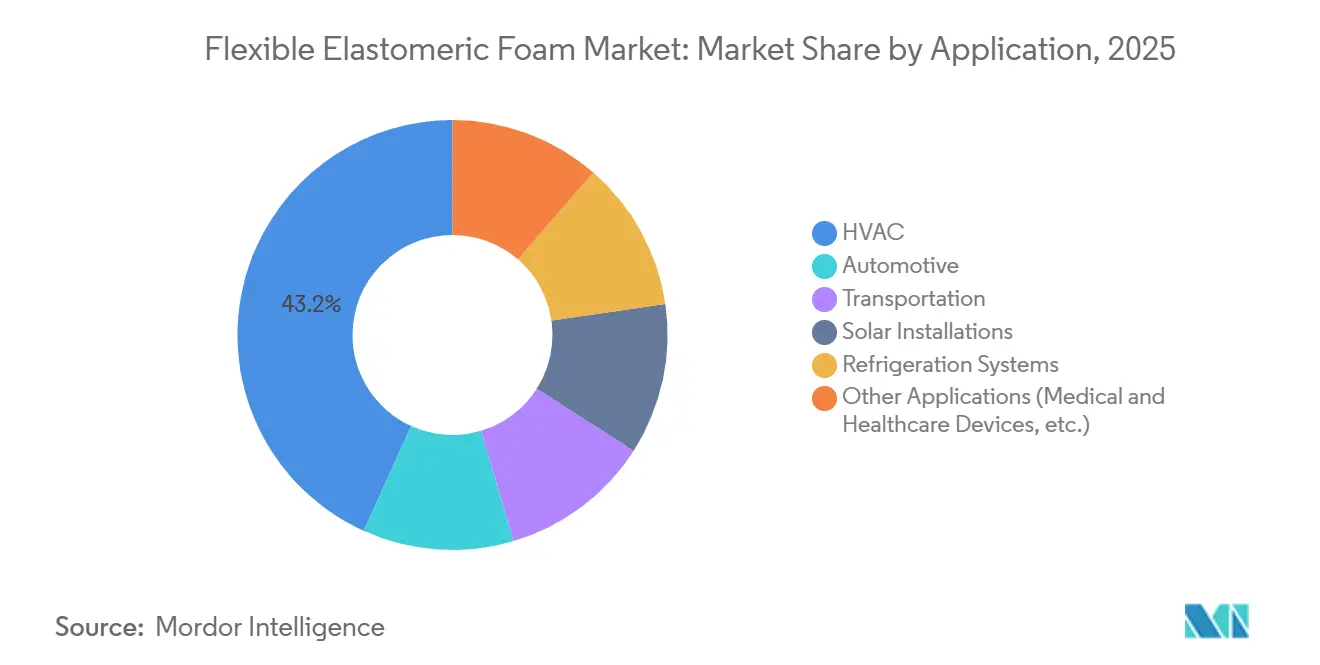
- By application, HVAC held 43.22% revenue share of the Flexible elastomeric foam market in 2025; solar installations are poised to rise at a 6.84% CAGR over 2026-2031.
- By geography, Asia-Pacific captured 45.25% of 2025 revenue and is advancing at a 7.09% CAGR, outpacing every other region in the flexible elastomeric foam market.
Note: Market size and forecast figures in this report are generated using Mordor Intelligence’s proprietary estimation framework, updated with the latest available data and insights as of January 2026.
Global Flexible Elastomeric Foam Market Trends and Insights
Drivers Impact Analysis*
| Driver | (~) % Impact on CAGR Forecast | Geographic Relevance | Impact Timeline |
|---|---|---|---|
| Increasing retrofitting activities in HVAC and refrigeration systems | +1.30% | Global, with concentration in North America, Europe, and China | Medium term (2-4 years) |
| Implementation of F-Gas phase-down compliance deadlines | +1.10% | Europe (primary), North America, Japan, South Korea | Short term (≤ 2 years) |
| Tightening building energy-efficiency regulations | +0.90% | North America (California, NYC, Oregon), Europe (Germany, UK, France) | Medium term (2-4 years) |
| Rapid growth of cold-chain infrastructure for last-mile grocery delivery | +0.80% | APAC core (India, Southeast Asia), spill-over to Middle-East | Long term (≥ 4 years) |
| Rising adoption of high-temperature foam in solar-thermal collectors | +0.40% | Global, with early traction in Spain, Morocco, China, Australia | Long term (≥ 4 years) |
| Source: Mordor Intelligence | |||
Increasing Retrofitting Activities in HVAC and Refrigeration Systems
Owners of commercial HVAC equipment, facing mandatory deadlines for leak repairs or phase-outs, are opting to replace entire systems sooner than anticipated. As the industry transitions from R-410A to R-32 and R-454B, discharge pressures have surged. Closed-cell elastomeric foam stands out as one of the few insulation materials capable of managing this increased condensation risk. The demand for this insulation is further bolstered by provincial subsidies in China promoting R-290 conversions, along with incentives for such transitions in public-sector buildings across Europe. Armacell's Advanced Insulation division, which underscores this trend, reported robust revenue growth, highlighting the impact of retrofit-driven demand. Supermarkets making the switch to CO₂ transcritical racks are now procuring foam rated for temperatures as low as -40°C, broadening their product selection from NBR/PVC to also encompass EPDM and chloroprene.
Implementation of F-Gas Phase-Down Compliance Deadlines
By 2030, the European Union is set to reduce its HFC quotas, with key checkpoints in 2027 and 2029. This move is hastening chiller-replacement cycles. Building owners face a choice: retrofit with drop-ins that still necessitate new insulation or transition to natural-refrigerant systems, which require a thicker wrap. Both options are driving a surge in near-term procurement. Similarly, Japan's expedited Kigali timeline and South Korea's enforced refrigerant reclamation are echoing this trend, pulling demand forward at least until 2027[1]South Korea Ministry of Environment, “Refrigerant Reclamation Mandate,” me.go.kr . Distributors throughout the EU are noting that orders for products in the flexible elastomeric foam market are booked out for six months, signaling a likely tight supply in 2026.
Tightening Building Energy-Efficiency Regulations
California's Title 24, New York City's Local Law 97, and similar regulations in states such as Oregon, Vermont, and Massachusetts mandate a baseline requirement for commercial retrofits to use elastomeric wraps, limiting heat loss[2]California Energy Commission, “Title 24 Building Energy Efficiency Standards,” energy.ca.gov . In Europe, the updated Energy Performance of Buildings Directive requires the renovation of the least efficient buildings by 2030, mandating insulation upgrades for all funded projects. Frameworks such as ISO 50001 and LEED v4.1 promote documented insulation measures and direct both public subsidies and private investments toward foam installations.
Rapid Growth of Cold-Chain Infrastructure for Last-Mile Grocery Delivery
In India and Southeast Asia, the logistics of e-grocery and pharmaceuticals are witnessing rapid growth. The emergence of dark stores and micro-fulfillment centers has spurred a rise in smaller refrigeration units with larger surface areas. This shift has heightened the demand for insulation, outpacing that of traditional centralized warehouses. Flexible elastomeric foam, delivered as pre-formed tubes, enables installers to fit them seamlessly, eliminating the need for spray gear. This advancement results in substantial labor savings, particularly in regions where there is a scarcity of certified sprayers. In the Middle-East, the introduction of temperature-controlled van fleets, designed to manage ambient peaks of 45°C, underscores a promising long-term growth trajectory for the flexible elastomeric foam market.
Restraints Impact Analysis*
| Restraint | (~) % Impact on CAGR Forecast | Geographic Relevance | Impact Timeline |
|---|---|---|---|
| Butadiene and neoprene feedstock volatility | -0.70% | Global, acute in Asia-Pacific (Japan, South Korea, China) | Short term (≤ 2 years) |
| Fire-safety bans on halogenated additives | -0.50% | Europe (UK, Germany, France), North America (California, NYC) | Medium term (2-4 years) |
| PFAS-linked blowing-agent supply risk | -0.60% | Global, regulatory pressure in US, EU, Canada | Short term (≤ 2 years) |
| Source: Mordor Intelligence | |||
Butadiene and Neoprene Feedstock Volatility
By early 2025, steam-cracker outages and rising naphtha costs significantly increased butadiene spot prices in the Asia-Pacific, directly influencing NBR cost curves. At the same time, a shutdown at DuPont’s LaPlace facility tightened the global neoprene supply, leading to a surge in North American prices. As margins narrowed, many converters shifted to EPDM, benefiting from its more stable ethylene and propylene streams. While this transition helps avoid price surges, it requires qualification testing with end users, temporarily delaying shipment cycles.
Fire-Safety Bans on Halogenated Additives
The United Kingdom's Building Safety Act has taken a decisive stand against the use of combustible insulation on façades located above 18 meters. This action effectively sidelines halogenated flame retardants in elastomeric foam. Following the lead of the United Kingdom, both Germany and France have introduced similar restrictions. In the United States, California's Proposition 65 listings are prompting distributors to pursue halogen-free certifications, even in the absence of an official ban. While mineral fillers and intumescent coatings meet the UL 94 V-0 standard, they come with a higher price tag, driving up raw material costs and increasing density. This heightened density further inflates freight and labor expenses. As a result, producers find themselves navigating a tightrope, balancing compliance with competitiveness, a dilemma that is hindering growth in specific subsegments.
*Our forecasts treat driver/restraint impacts as directional, not additive. The impact forecasts reflect baseline growth, mix effects, and variable interactions.
Segment Analysis
By Function: Thermal Dominance Masks Acoustic Opportunity
In 2025, thermal insulation accounted for 75.22% of the demand and is projected to grow at a CAGR of 5.29% during the forecast period of 2026-2031. This growth is primarily driven by the increasing demand for electric-vehicle battery housings and rail rolling stock, which require vibration dampening in the 500 Hz to 2 kHz range. The market share of flexible elastomeric foam in thermal applications is supported by a mandatory wrap requirement, as stipulated by U.S. and European energy codes. In contrast, its use in acoustic applications is influenced more by voluntary Leadership in Energy and Environmental Design (LEED) credits and tenant expectations.
Thermal applications are also benefiting from refrigerant transitions that necessitate thicker insulation. Meanwhile, the acoustic segment gains an advantage as companies emphasize sound transmission loss without compromising flexibility. With the expansion of electric vehicle platforms and emerging vibration challenges from data-center pumps, acoustic foam is poised for growth. However, thermal insulation is expected to maintain its lead in absolute revenues through 2031.


By Type: EPDM Outpaces Despite Smaller Base
In 2025, NBR/PVC dominated the market, accounting for 54.08% of the volume. EPDM is witnessing robust expansion, growing at a 6.25% CAGR. This growth is attributed to EPDM's superior qualities, including its resilience under high temperatures and its resistance to UV exposure. Furthermore, shifts in butadiene feedstock prices have altered cost dynamics, favoring EPDM and narrowing its price gap by early 2026.
Chloroprene, while a niche player, faces challenges due to supply constraints and a recent increase in prices. In contrast, natural rubber and certain exotic blends find their niche in specialized sectors, serving medical applications and environments with extreme cold. Looking ahead to the forecast period of 2026-2031, it is expected that EPDM will bolster its market share in flexible elastomeric foams, largely at the expense of NBR/PVC. This shift is anticipated in sectors such as solar-thermal, process-heat, and outdoor settings with high UV exposure.
By Application: Solar Installations Surge from Low Base
In 2025, HVAC accounted for 43.22% of the flexible elastomeric foam market, representing the largest share. Solar installations are advancing at a CAGR of 6.84% during the forecast period of 2026-2031, driven by Spain and China commissioning high-temperature collector fields. These fields require EPDM rated for temperatures of 150 degrees Celsius and above. Refrigeration is experiencing growth due to the cold-chain expansion in India and the Asia-Pacific region. The automotive sector is undergoing a shift, with internal combustion engine damping remaining stable while electric vehicle battery barriers are gaining market share.
Furthermore, industrial process-heat projects are transitioning from natural gas to solar-thermal or waste-heat recovery systems, contributing to additional demand. Data centers are introducing liquid-cooling loops that utilize low-temperature glycol mixes. These systems still require closed-cell, low-permeability foam, creating new revenue opportunities for specialized grades.
Geography Analysis
In 2025, the Asia-Pacific region accounted for 45.25% of total revenue. With India doubling its cold-storage capacity and China rolling out an extensive HVAC retrofit pipeline, the region is poised for a robust 7.09% CAGR during the forecast period of 2026-2031. Armacell has set up a new aerogel facility in Pune, while local players such as Huamei are optimizing their operations by leveraging localized supplies and aligning with industry codes.
In North America, leak-repair regulations that came into effect in January 2026, coupled with stringent envelope codes in California and New York, are driving the market. Consequently, distributors have bolstered their order books into late 2026, capitalizing on pre-buying opportunities. Europe's market growth is spurred by the F-Gas phase-down, which is accelerating the replacement of chillers and heat pumps. In response to high labor costs, markets are increasingly adopting pre-formed pipe sections to reduce installation time, a trend addressed by companies such as Hira Industries and K-Flex.
Although South America and the Middle-East and Africa hold a smaller share of global revenue, they are experiencing double-digit growth. This surge is largely fueled by the demands of pharmaceutical logistics and grocery deliveries in regions grappling with sweltering temperatures surpassing 45 degrees Celsius. Additionally, policy moves in Japan and South Korea are set to reshape the landscape by aiming to reclaim refrigerants and banning the import of virgin R-410A by 2027. Such initiatives position Northeast Asia on a rapid growth trajectory, mirroring Europe's ascent, ensuring the region remains buoyant even as the construction sector cools.

Competitive Landscape
The flexible elastomeric foam market is moderately consolidated. Armacell, leveraging backward integration, transitions from aerogel production in India to PET structural cores in Belgium, aiming to enhance both margins and market share. BASF, utilizing biomass-balance chemistry, rolls out products such as Elastoflex BMB, Basotect EcoBalanced, and Autofroth BMB. In a strategic alliance, BASF teams up with Hyundai Transys to deliver lightweight seating solutions for vehicles, underscoring its dedication to sustainability.
Rogers Corporation and Freudenberg, experts in multilayer composites, serve the electric vehicle (EV) battery and data-center pump sectors, commanding significant price premiums. Owens Corning and Sekisui Chemical, by investing in PFAS-free blowing-agent technology, strategically navigate potential liabilities associated with the United States (U.S.) CERCLA listing. On the other hand, smaller entities such as Rubberlite and Intec Foams thrive in custom die-cut gaskets, while Era Polymers and Hira Industries capitalize on swift service in the Gulf and Australian markets.
Recent patent applications spotlight fire-safe, halogen-free formulations and eco-conscious foaming methods with reduced global warming potential. In response to lead-time fluctuations, distributors have increased their buffer stock from four to eight weeks, a strategy that predominantly favors well-capitalized industry frontrunners. As energy-code deadlines loom, brand credibility and comprehensive compliance documentation have surfaced as pivotal purchase factors, erecting steeper entry barriers for newcomers in the flexible elastomeric foam market.
Flexible Elastomeric Foam Industry Leaders
Armacell International S.A.
L’Isolante K-FLEX S.p.A.
NMC SA
Aeroflex USA, Inc.
Zotefoams plc
- *Disclaimer: Major Players sorted in no particular order

Recent Industry Developments
- April 2025: Armacell introduced ArmaGel XGC - a revolutionary, flexible elastomeric foam product that sets a new industry standard by combining superior insulation efficiency with improved worker safety through proprietary low-dust technology.
- March 2025: In North America, Armacell launched ArmaFlex Ultima, its premier plenum-rated insulation. This ultra-low smoke density insulation, powered by the company's patented ArmaPrene technology, redefines fire safety and performance benchmarks for flexible closed-cell elastomeric insulation.


Research Methodology Framework and Report Scope
Market Definitions and Key Coverage
Our study views the flexible elastomeric foam market as all closed-cell synthetic rubber insulation sold in tubes, sheets, or rolls that meet typical HVAC and refrigeration specifications for low thermal conductivity, high vapor diffusion resistance, and sustained flexibility. Materials in scope include NBR/PVC blends, EPDM, natural rubber, and chloroprene compounds that are factory produced and distributed through OEM or aftermarket channels worldwide.
Scope exclusions include rigid elastomeric blocks, spray polyurethane or phenolic foams, and general-purpose flexible polyurethane cushioning, which are not counted.
Segmentation Overview
- By Function
- Thermal Insulation
- Acoustic Insulation
- By Type
- Natural Rubber/Latex
- Nitrile Butadiene Rubber/Polyvinyl Chloride
- Ethylene Propylene Diene Monomer
- Chloroprene
- Other Types (ECO, SBR, etc.)
- By Application
- HVAC
- Automotive
- Transportation
- Solar Installations
- Refrigeration Systems
- Other Applications (Medical and Healthcare Devices, etc.)
- By Geography
- Asia-Pacific
- China
- India
- Japan
- South Korea
- Rest of Asia-Pacific
- North America
- United States
- Canada
- Mexico
- Europe
- Germany
- United Kingdom
- France
- Italy
- Rest of Europe
- South America
- Brazil
- Argentina
- Rest of South America
- Middle-East and Africa
- Saudi Arabia
- South Africa
- Rest of Middle-East and Africa
- Asia-Pacific
Detailed Research Methodology and Data Validation
Primary Research
Mordor analysts held structured calls with insulation distributors, HVAC OEM sourcing managers, and plant engineers across Asia-Pacific, North America, Europe, and the Gulf. The conversations clarified average selling prices, grade mix shifts, and installation loss factors, letting us fine-tune assumptions gathered from desk study and spot regional anomalies.
Desk Research
We started with trade and production datasets such as UN Comtrade tube rubber codes, Eurostat PRODCOM elastomeric sheet output, the US Census Current Industrial Reports, and AHRI quarterly HVAC equipment shipments. Standards and energy efficiency rules from ASHRAE, the European F-Gas Regulation, and India's Bureau of Energy Efficiency helped us size regulatory pull. Company financials from D&B Hoovers, news flows on capacity additions from Dow Jones Factiva, and white papers from the International Copper Association rounded out demand indicators. These examples are illustrative; many other public and subscription sources informed our desk work.
Market-Sizing & Forecasting
A top-down build linked global HVAC and refrigeration equipment production, regional building floor space starts, automotive HVAC fitment rates, butadiene cost trends, and policy adoption scores to estimate the insulation demand pool, which is then cross-checked through sampled ASP × volume roll-ups. Bottom-up gaps, where distributor data were thin, were bridged using channel checks and import parity adjustments. Multivariate regression, tested for autocorrelation and seasonality, projects each driver through 2030. Scenarios are pressure tested with experts before finalizing the CAGR.
Data Validation & Update Cycle
Outputs pass a two-analyst variance check, followed by senior review that benchmarks against independent shipment tallies and price indices. Models refresh yearly, and we trigger mid-cycle updates if feedstock shocks or policy shifts move the baseline materially.
Why Mordor's Flexible Elastomeric Foam Baseline Earns Trust
Published numbers differ because providers pick dissimilar product baskets, currency bases, and refresh cadences. Some tally rigid and spray foams or bolt on broader polymer families, while others lift historic sales without re-rating for today's ASP drift.
Key gap drivers include (i) material scope that stretches into flexible polyurethane, inflating totals; (ii) single-region surveys projected globally; (iii) inconsistent FX conversion years; and (iv) static price decks that ignore volatile butadiene swings. By anchoring scope strictly to closed-cell rubber insulation and refreshing prices every six months, Mordor avoids these pitfalls.
Benchmark comparison
| Market Size | Anonymized source | Primary gap driver |
|---|---|---|
| USD 3.15 B (2025) | Mordor Intelligence | - |
| USD 2.80 B (2024) | Global Consultancy A | Excludes aftermarket retrofit volumes |
| USD 10.65 B (2024) | Industry Association B | Includes flexible polyurethane and other foams |
| USD 3.62 B (2024) | Trade Journal C | Uses unverified average price escalation |
Taken together, the comparison shows that Mordor's disciplined scope control, live pricing checks, and blended top-down and bottom-up modeling give decision-makers a balanced, transparent starting point they can trace back to real variables and repeatable steps.


Key Questions Answered in the Report
What is the projected value of the Flexible elastomeric foam market in 2031?
The flexible elastomeric foam market size stands at USD 3.31 billion in 2026, and it is projected to reach USD 4.24 billion by 2031 at a 5.11% CAGR.
Which segment is growing fastest within Flexible elastomeric foam applications?
Solar installations are advancing at a 6.84% CAGR through 2031.
Why is Asia-Pacific the largest regional market?
Rapid cold-chain expansion and the world’s biggest HVAC retrofit pipeline push Asia-Pacific to a 45.25% revenue share with a 7.09% CAGR.
How are regulators influencing material choice in insulation?
F-Gas phase-downs, leak-repair mandates, and strict energy codes require thicker, closed-cell elastomeric foam for compliance.
What feedstock risks could disrupt supply?
Volatility in butadiene and neoprene prices, plus halogenated additive bans, pose near-term challenges for converters.
Page last updated on:


