
Emotion Detection And Recognition (EDR) Market Size and Share
Market Overview
| Study Period | 2020 - 2031 |
|---|---|
| Market Size (2026) | USD 81.51 Billion |
| Market Size (2031) | USD 195.74 Billion |
| Growth Rate (2026 - 2031) | 19.15% CAGR |
| Fastest Growing Market | Asia Pacific |
| Largest Market | North America |
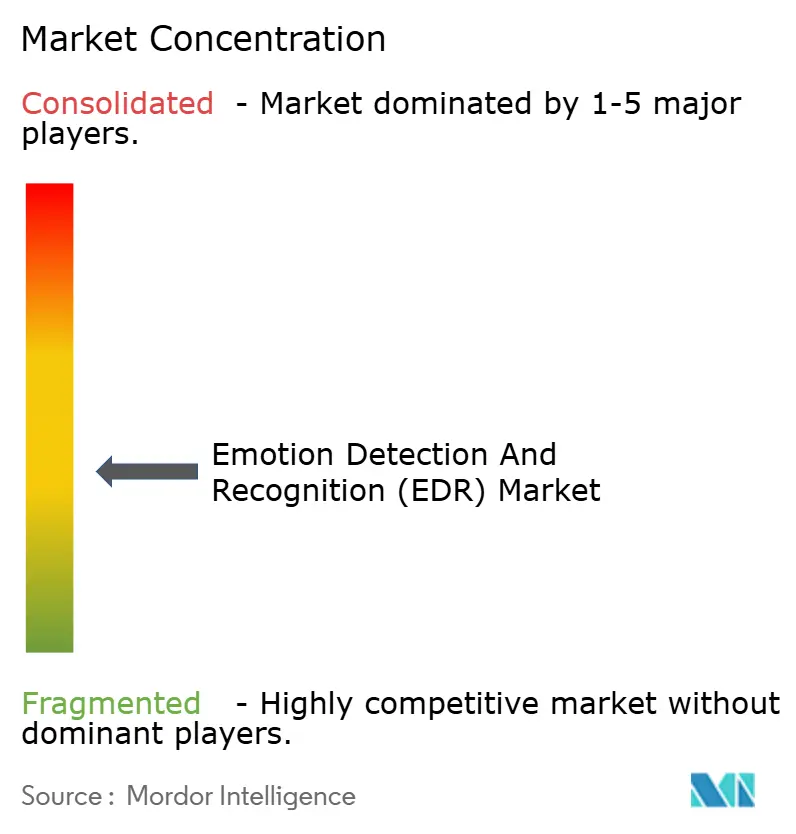
| Market Concentration | Medium |
Major Players
*Disclaimer: Major Players sorted in no particular order Image © Mordor Intelligence. Reuse requires attribution under CC BY 4.0. |
|
Emotion Detection And Recognition (EDR) Market Analysis by Mordor Intelligence
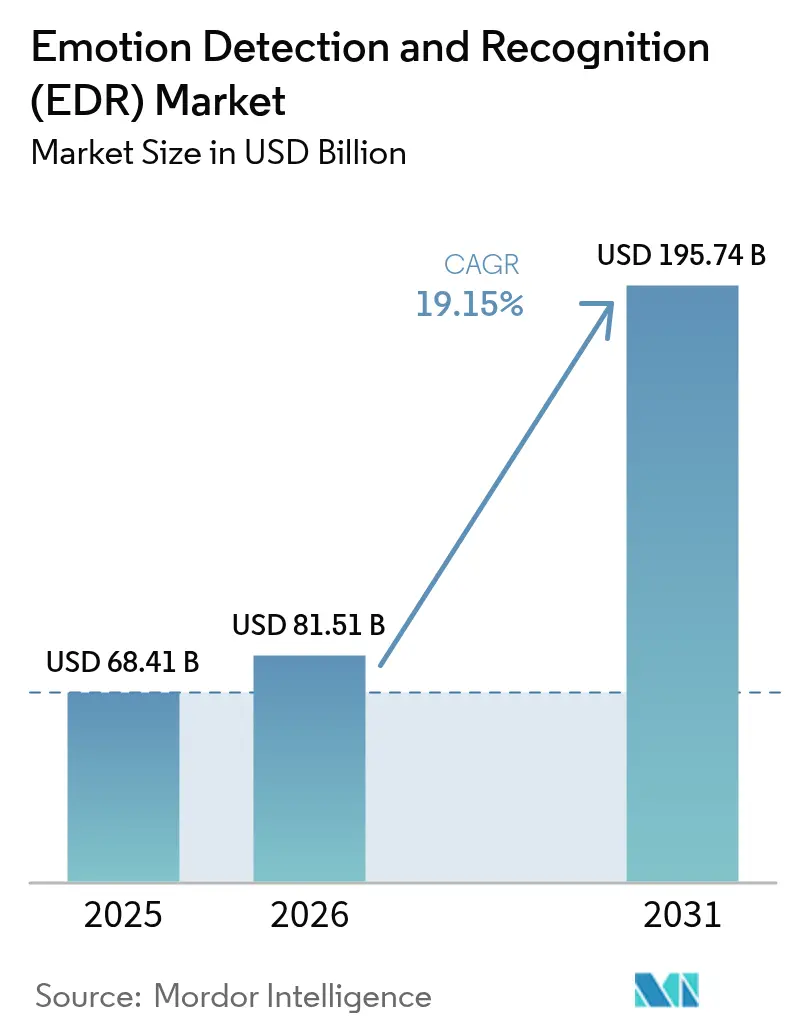
The Emotion Detection and Recognition market size in 2026 is estimated at USD 81.51 billion, growing from 2025 value of USD 68.41 billion with 2031 projections showing USD 195.74 billion, growing at 19.15% CAGR over 2026-2031. This expansion reflects higher enterprise spending on AI-enabled personalization, regulatory mandates in automotive safety, and the rising availability of multimodal data sources that enhance algorithm accuracy. Machine learning advances shorten model-training cycles, while edge hardware investments reduce latency and cloud costs. Automotive OEM requirements for in-cabin monitoring create a stable demand floor that accelerates scale benefits for suppliers, while healthcare adoption of tele-mental health triage tools broadens use cases beyond surveillance. The Emotion Detection and Recognition market also benefits from growing speech-based biometric security deployments across banking and government, a surge in IoT-wearable integration that addresses privacy concerns associated with cameras, and expanding ecosystem partnerships between cloud vendors and niche emotion-AI specialists.
Key Report Takeaways
- By 2025, machine learning is expected to command a 42.10% share of the Emotion Detection and Recognition market size; meanwhile, biosensors are projected to advance at a 19.03% CAGR through 2031.
- By application, customer experience management led the Emotion Detection and Recognition market with a 26.60% share of the market size in 2025; automotive driver monitoring is poised for the fastest 19.45% CAGR from 2025 to 2031.
- By end user, government agencies captured 30.60% of the Emotion Detection and Recognition market share in 2025, while healthcare providers posted a 19.62% CAGR through 2031.
- By 2025, facial expression analysis software tools are expected to retain a 37.40% share of the Emotion Detection and Recognition market size; gesture and posture recognition is anticipated to grow at a 19.33% CAGR over the forecast period.
- By geography, the Asia Pacific held a 33.70% market share in the Emotion Detection and Recognition market in 2025, while North America was projected to have the highest CAGR of 19.28% from 2025 to 2031.
Note: Market size and forecast figures in this report are generated using Mordor Intelligence’s proprietary estimation framework, updated with the latest available data and insights as of 2026.
Global Emotion Detection And Recognition (EDR) Market Trends and Insights
Drivers Impact Analysis*
| Driver | (~ ) % Impact on CAGR Forecast | Geographic Relevance | Impact Timeline |
|---|---|---|---|
| Proliferation of IoT-enabled wearables | +3.2% | Global, with APAC leadership | Medium term (2-4 years) |
| Surge in demand for speech-based biometric security | +2.8% | North America and EU | Short term (≤ 2 years) |
| Rising need for personalized customer experience tools | +3.5% | Global, retail-focused regions | Medium term (2-4 years) |
| Automotive OEM mandates for in-cabin driver emotion monitoring | +4.1% | Europe, North America, China | Long term (≥ 4 years) |
| Integration of emotion AI into tele-mental-health triage platforms | + 2.9% | North America, EU, Australia | Medium term (2-4 years) |
| Edge-based multimodal analytics to avoid cloud-privacy penalties | +2.7% | EU, California, privacy-conscious regions | Short term (≤ 2 years) |
| Source: Mordor Intelligence | |||
Proliferation of IoT-Enabled Wearables
Continuous emotion tracking migrates from cameras toward wrist, ear, and head-worn devices that collect heart-rate variability, galvanic-skin-response, and motion data. Apple’s patent filings highlight mainstream interest in multimodal sensing that extends fitness wearables into emotional-wellness functions USPTO. Enterprises see value in fatigue detection for drivers, warehouse staff, and pilots, while insurers explore risk-based pricing tied to physiological stress. Regulatory acceptance is higher because face images are absent and data storage remains local, aligning with privacy statutes.
Surge in Demand for Speech-Based Biometric Security
Financial services and public-sector agencies integrate emotion recognition with voice authentication to flag coercion, stress, or deceit during transactions. Neural-network models surpass 85% accuracy across languages. Contact-center deployments lower fraud losses and shorten call-handling time, delivering quick ROI. Growth accelerates as pandemic-driven hygiene concerns keep demand for touchless authentication elevated.[2]EEE, “Transactions on Biomedical Engineering,” ieeexplore.ieee.org
Rising Need for Personalized Customer Experience Tools
Retailers and e-commerce platforms leverage emotion analytics to generate monetizable insights, increasing conversion rates by up to 25%. Real-time sentiment feeds into dynamic pricing, recommendation engines, and chatbots, replacing demographic segmentation with behavioral triggers. Media-streaming services track viewers' emotions to inform content investment, while hospitality firms tailor ambient lighting and music to match collective mood states.
Automotive OEM Mandates for In-Cabin Driver Emotion Monitoring
Euro NCAP safety rating criteria and Chinese EV brand differentiation prompt automakers to integrate emotion detection with drowsiness alerts. Integration extends to adaptive HVAC, lighting, and infotainment that respond to occupant mood.. Usage-based insurance models utilize emotional-state scores to refine risk, generating new revenue streams for data providers and telematics firms. Demand sustains silicon vendors specializing in low-power edge AI for cabin environments.
Restraints Impact Analysis*
| Restraint | (~ ) % Impact on CAGR Forecast | Geographic Relevance | Impact Timeline |
|---|---|---|---|
| Data-privacy regulation tightening (GDPR, CCPA) | -2.1% | EU, California, global diffusion | Short term (≤ 2 years) |
| Accuracy bias across ethnic groups | -1.8% | Global – diverse markets | Medium term (2-4 years) |
| GPU supply constraints inflating total cost of ownership | -1.5% | Global | Short term (≤ 2 years) |
| Pending EU ban on real-time public facial emotion surveillance | -1.3% | EU – global spillover | Medium term (2-4 years) |
| Source: Mordor Intelligence | |||
Data-Privacy Regulation Tightening (GDPR, CCPA)
Explicit-consent mandates, data-localization rules, and algorithm-explainability clauses increase compliance costs for deployers, favoring established companies and slowing consumer-facing rollouts. Vendors respond by adopting federated learning and differential privacy, which can degrade model performance and extend deployment cycles. Product-design revisions toward on-device inference gain urgency to avoid cross-border transfers of biometric data.
GPU Supply Constraints Inflating Total Cost of Ownership
Chip shortages have raised GPU acquisition costs by up to 60% since 2022, squeezing margins for deployments that require on-premises inference. Lower-budget sectors, such as education and small retail, defer adoption or pivot to lower-accuracy CPU-based models. Hardware scarcity also accelerates investment in alternative AI accelerators, which fosters fragmentation in the inference-hardware stack and complicates software support.
*Our forecasts treat driver/restraint impacts as directional, not additive. The impact forecasts reflect baseline growth, mix effects, and variable interactions.
Segment Analysis
By Software Tool: Facial Recognition Commands Wallet Share While Gesture Detection Accelerates
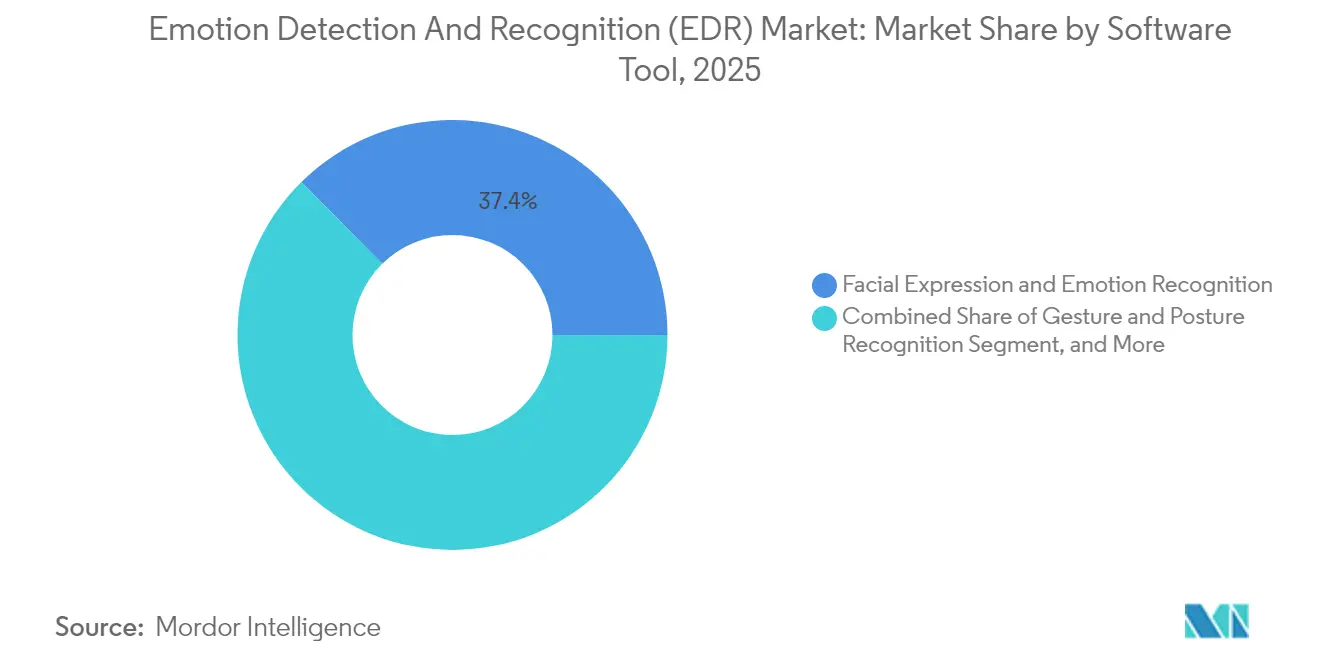
Facial expression recognition held a 37.40% share of the Emotion Detection and Recognition market size in 2025, reflecting the ubiquity of cameras and the maturity of vision models. Enterprise adoption spans retail analytics and marketing research. Yet growth moderates as privacy rules restrict public-space imaging. Gesture and posture recognition is expected to exhibit a forecasted 19.33% CAGR as organizations favor non-identifying signals to infer engagement or fatigue. The Emotion Detection and Recognition market continues to blend computer-vision libraries with skeletal-tracking modules inside edge devices for unobtrusive sensing. Speech and voice analysis captures call-center demand, while bio-sensing tools ride the wearable boom to penetrate healthcare and workplace-wellness ecosystems.
Regulators are increasingly prioritizing physiological monitoring over face-based systems, which is boosting interest in multimodal fusion that combines galvanic skin response, heart rate variability, and respiratory data. Bio-sensing tools, though small today, enjoy higher accuracy in low-light or obstructed-face conditions and address fairness concerns. Vendors embed such analytics into smart headphones, watches, and vehicle seats. Cross-tool interoperability frameworks are emerging to enable enterprises to switch modalities without rewriting business logic, thereby reinforcing platform strategies across the Emotion Detection and Recognition market.



By Technology: Machine Learning Leads, Bio-Sensors Challenge Camera-Heavy Stacks
Machine learning technology accounted for 42.10% of the Emotion Detection and Recognition market share in 2025, driven by the maturity of its algorithms and the reusability of datasets across modalities. Transfer learning cuts time to deploy, while auto-ML tools democratize model building. Natural-language processing remains vital for text-centric sentiment analyses; computer vision persists for facial cues but faces regulatory drag. The Emotion Detection and Recognition market size associated with computer vision stacks grows more slowly as data protection agencies scrutinize facial analysis.
Bio-sensor technology is projected to post a 19.03% CAGR through 2031. Health systems adopt continuous monitoring to flag depressive episodes or post-surgical stress, aligning with tele-mental-health reimbursement policies, JMIR. Wearable device penetration supplies large labeled datasets that refine emotion-biomarker correlations, breaking the cold-start barrier. Regulatory leniency for physiological signals versus imagery supports this rise. Advanced sensor fusion enhances classifier confidence in noisy environments, thereby expanding its applicability to environments such as noisy factory floors and on-road settings. Edge-native chips capture data at the source, trimming cloud costs and appealing to privacy-first enterprises within the broader Emotion Detection and Recognition market.
By Application: Customer Experience Dominates, Automotive Accelerates Faster
Customer experience management is expected to own a 26.60% share of the Emotion Detection and Recognition market size by 2025. Retailers integrate real-time emotion scores into recommendation engines, customer journey mapping, and A/B tests for storefront displays. Conversion lifts of up to 25% underpin budget approval cycles. Hospitality and entertainment firms experiment with mood-responsive ambient environments that raise dwell time and repeat visits.
Automotive driver monitoring advances at a 19.45% CAGR, the fastest of any application, driven by Euro NCAP scoring and Chinese EV product differentiation. OEMs embed emotion trackers alongside existing eye-gaze sensors, combining drowsiness and aggression detection with comfort personalization. Insurers deploy emotion-driven risk scores for usage-based premiums, creating new data monetization channels. Healthcare applications are increasing steadily as telehealth workflows incorporate emotional metrics into triage, particularly for mental health screening during remote consultations. Law-enforcement surveillance occupies a niche but faces scrutiny; marketing analytics use cases are migrating to controlled panels where consent barriers are lower. These trends collectively expand the market for Emotion Detection and Recognition.
By End User Vertical: Government Budgets Anchor Demand, Healthcare Surges
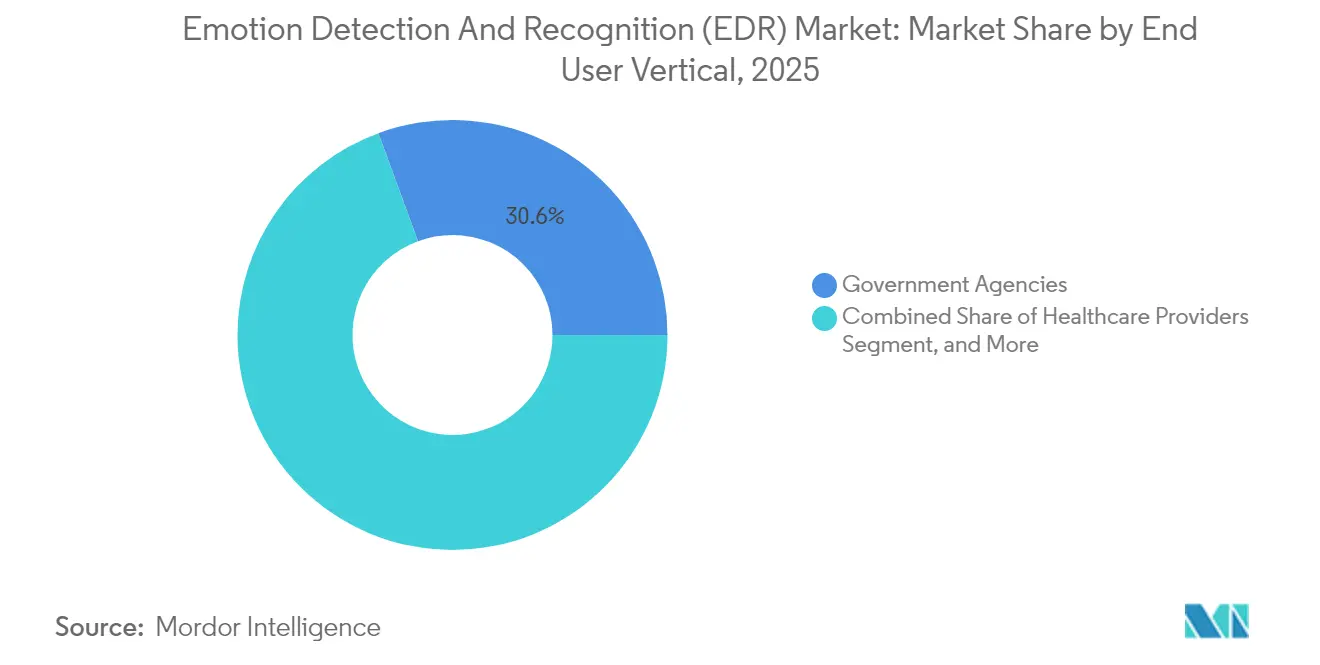
Government agencies captured 30.60% of the Emotion Detection and Recognition market share in 2025 as public safety and border control bodies integrate emotion detection into behavioral analytics dashboards. Deterrence goals justify large multi-year contracts, insulating vendors from economic cycles. The retail and e-commerce sectors are continuing to rapidly roll out in-store sentiment cameras and online voice-analysis bots to reduce cart abandonment.
Healthcare providers are projected to post the fastest growth rate at a 19.62% CAGR. Post-pandemic telehealth platforms require scalable mental health triage that complements clinician shortages. Emotion-AI chatbots identify at-risk patients based on voice inflection or facial tension signals, as reported in JMIR. Hospitals integrate bedside camera feeds with vital signs to predict agitation and intervene early. Transportation firms adopt affect analytics for driver-fatigue mitigation; media companies refine content investments via viewer mood telemetry. Across sectors, the ISO 27001 and HIPAA frameworks are shaping vendor vetting as the Emotion Detection and Recognition market matures.
By Deployment Model: Cloud Retains Scale, Edge Gains Privacy-Driven Momentum
Cloud deployments dominate in aggregate seats but cede share to edge and on-premises models where data sovereignty or latency constraints are present. Healthcare and defense stakeholders route sensitive data streams through on-device inference engines to comply with GDPR and HIPAA mandates. Commercial off-the-shelf edge boxes now ship with optimized AI accelerators that process multimodal cues at <20 ms latency, enabling driver-safety and industrial-automation scenarios prohibitively slow in the cloud ACM.
Edge models also sidestep escalating GPU service fees. However, they demand upfront capital and specialized support teams. Cloud still excels in batch analytics, model retraining, and global rollout speed. Hybrid architectures emerge: raw sensing remains local, while anonymized features are synced to the cloud for aggregated learning. This bifurcated design anchors vendor roadmaps and influences buying criteria throughout the Emotion Detection and Recognition market.
Geography Analysis
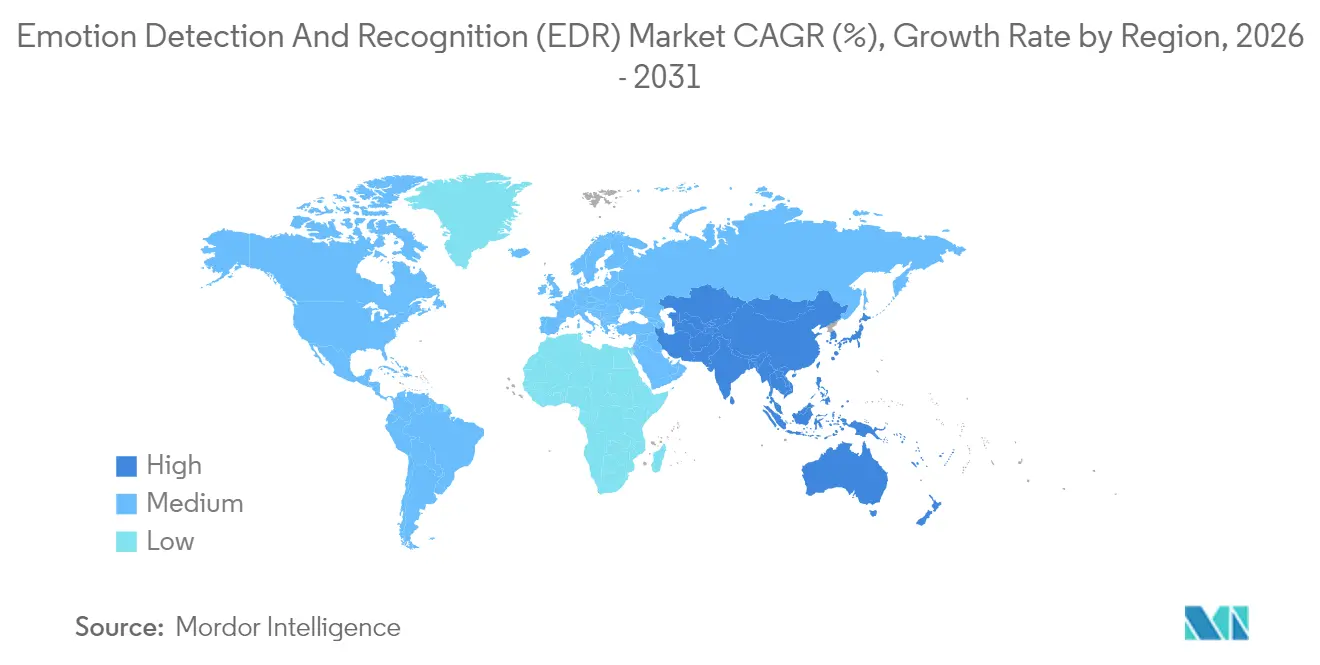
Asia Pacific maintains a 33.70% share of the Emotion Detection and Recognition market, led by China’s large-scale surveillance infrastructure and Japan’s innovation in automotive HMIs. Government grants subsidize AI startup pilots in healthcare and smart city programs, while a comparatively permissive regulatory climate accelerates commercial deployments. South Korea leverages consumer electronics supply chains to embed emotion AI in smartphones and home appliances, while India’s IT services giants build export-oriented emotion analytics modules for U.S. clients.
North America ranks second in AI spending for emotional applications. U.S. retailers, banks, and tech platforms can quickly run pilot-to-production cycles, thanks to deep venture funding and mature cloud offerings. Healthcare growth accelerates under reimbursement codes for remote behavioral assessment. Canadian research groups partner with wearable firms to validate emotion biomarkers, reinforcing the region’s reputation for ethical AI frameworks even as CCPA-like state laws proliferate.
Europe experiences mixed momentum. GDPR compliance hurdles and looming AI-Act restrictions deter some public-space deployments. Yet, the continent leads in automotive driver monitoring due to safety regulations, and German Tier-1 suppliers funnel R&D into cabin-embedded sensors. Financial hubs in the United Kingdom are adopting voice-emotion analytics to flag potential fraud, capitalizing on the use of regulatory sandboxes. Privacy-preserving techniques, such as federated learning, flourish as vendors adapt to strict rules, influencing product designs exported worldwide. Collectively, these dynamics sustain a wide geographic dispersion of revenue within the Emotion Detection and Recognition market.

Regulatory Landscape
Regulation is tightening around emotion recognition, especially when biometric data is used to infer an individual's emotional state. In the European Union, the AI Act (Regulation (EU) 2024/1689) explicitly defines emotion recognition AI systems and introduces prohibitions for use in workplaces and educational institutions, with limited carve-outs for medical or safety purposes. Deployments in other contexts can fall under high-risk obligations, raising expectations for governance, transparency, and data practices.
Outside the EU, standards and proposed legislation are shaping compliance requirements. ISO/IEC 30150-1:2022 provides an Affective Computing User Interface (AUI) model that vendors use to structure emotional feature collection and presentation, while ISO/IEC work on emotion annotation supports more standardized training and validation. In the United States, introduced federal proposals such as the Facial Recognition Act of 2025 (H.R. 4695) incorporate emotion inference into facial recognition definitions and point toward NIST-aligned accuracy testing expectations, increasing the validation burden for facial and multimodal EDR offerings.
Value Chain Analysis
The EDR value chain starts with multimodal data capture and enabling hardware, spanning cameras, microphones, and biosensors embedded in smartphones, wearables, vehicles, and contact-center endpoints, alongside edge AI accelerators and GPUs that shape inference performance and cost. Upstream activities also include data collection, labeling, and emotion-annotation workflows aligned to emerging standards (for example, the ISO/IEC 30150 series). These inputs then feed model development across machine learning, computer vision, NLP, and biosignal processing, followed by MLOps tooling for deployment, monitoring, and bias/accuracy audits.
Midstream and downstream value is concentrated in packaged APIs and vertical solutions delivered via cloud, edge, and hybrid architectures, with system integrators and platform providers embedding emotion analytics into customer experience management, driver monitoring, and tele-mental-health triage. Compliance and assurance act as gating steps in the chain, particularly for biometric-based inference under the EU AI Act. This has been pushing vendors toward on-device processing, privacy-preserving feature extraction, and clearer separation between safety/medical use cases and prohibited workplace or education scenarios. Consolidation and bundling also affect channel power, as automotive-focused suppliers integrate emotion AI into broader interior sensing stacks for OEM procurement.
Competitive Landscape
The Emotion Detection and Recognition market exhibits a moderate concentration. Tech giants exploit cloud ecosystems to cross-sell emotion-AI APIs, embedding them into customer-experience suites and healthcare clouds. Specialized vendors retain an edge in modality-specific IP, such as eye tracking, vocal affect, or biosignal fusion. Acquisition activity underscores convergence: Smart Eye’s USD 73.5 million purchase of Affectiva folded emotion AI into driver-monitoring packages, enabling one-stop procurement for OEMs.[3]Smart Eye, “Smart Eye Completes Integration of Affectiva Technology,” smarteye.se
Cloud hyperscalers launched bias-mitigated emotion services with differential-privacy toggles, addressing enterprise procurement hurdles. Patent races intensify in multimodal fusion, with more than 300 new filings in 2024 referencing emotion analytics across at least two sensor types. Hardware entrants differentiate via low-power neuromorphic chips tailored for on-device affect inference, courting automotive and wearable OEMs. Regionally, Asian suppliers bundle emotion sensing with consumer-electronics firmware, while European specialists concentrate on automotive and industrial verticals. Moderate fragmentation leaves room for alliances, as customers increasingly favor end-to-end stacks in a more regulated Emotion Detection and Recognition market.
Emotion Detection And Recognition (EDR) Industry Leaders
-
Affectiva Inc. (Smart Eye)
-
IBM Corporation
-
Microsoft Corporation
-
Google LLC (Alphabet)
-
Apple Inc.
- *Disclaimer: Major Players sorted in no particular order

Market Opportunities and Future Outlook
A key whitespace is compliant emotion sensing that avoids prohibited or high-friction biometric inference pathways, particularly in regions shaped by the EU AI Act. This is driving product design toward privacy-preserving modalities (biosensing, on-device inference, and feature-level sharing instead of raw video) and toward narrowly scoped safety and medical use cases where exceptions apply. Automotive interior sensing remains a practical commercialization channel for EDR capabilities, since driver monitoring and safety framing support clearer justification, and suppliers are bundling combined drowsiness, attention, and affect signals into single stacks for OEM integration.
Consumer and enterprise opportunities are also expanding in wearables and ambient assistants that blend context with multimodal signals, but these uses depend on careful data-governance and consent frameworks. For example, Meta disclosed a published patent (US 2026/0182881 A1, published in July 2026) describing persistent emotional monitoring via voice and contextual analysis in wearable form factors, highlighting ongoing R&D focused on continuous, non-camera-first emotion understanding. In parallel, advances in interpretable speech emotion reasoning and longer-horizon emotional modeling for virtual agents are improving the fit of EDR for customer service automation and digital humans, where buyers increasingly ask for explainability, auditability, and bias controls alongside accuracy.
Recent Industry Developments
- June 2026: IBM and Google Cloud announced a strategic partnership and launched a Google Cloud Practice that combines IBM Consulting Advantage with Googles Gemini Enterprise Agent Platform. The move strengthens go-to-market capacity for enterprise AI deployments where emotion and sentiment capabilities are often embedded into customer experience and service workflows. It also reinforces the role of governed, production-grade AI delivery.
- February 2026: Smart Eye entered into an agreement to acquire Sightic Analytics, expanding its interior sensing and analytics capabilities. The transaction adds technology depth for automotive cabin and driver monitoring programs. It supports more integrated sensing stacks that can incorporate affective signals alongside attention and safety functions.
- January 2025: Smart Eye launched its AIS+ system at CES 2025, adding new functionality to its fleet driver safety system. The product update broadens deployment pathways beyond passenger vehicles into commercial fleets. Fatigue and behavioral monitoring requirements in these environments create recurring demand for multimodal driver-state analytics.


Research Methodology Framework and Report Scope
Market Definition and Coverage
For this study, the emotion detection and recognition (EDR) market is defined as revenues generated from software and related services that infer human emotion from signals such as face, voice, text, and biosensing, and then turn those outputs into usable insights for end users.
Scope exclusions: We do not count general-purpose cameras, sensors, or consumer devices unless their value is explicitly captured as part of EDR software or EDR services revenue.
Segmentation Overview
-
By Software Tool
- Facial Expression and Emotion Recognition
- Gesture and Posture Recognition
- Speech and Voice Recognition
- Bio-Sensing Software Tools
-
By Technology
- Machine Learning
- Natural Language Processing
- Computer Vision and 3-D Modeling
- Bio-Sensors Technology
-
By Application
- Customer Experience Management
- Law Enforcement Surveillance and Monitoring
- Healthcare and Medical Diagnostics
- Automotive Driver Monitoring
- Marketing and Advertising Analytics
-
By End User Vertical
- Government Agencies
- Healthcare Providers
- Retail and E-Commerce
- Media and Entertainment
- Transportation and Logistics
-
By Deployment Model
- Cloud
- Edge and On-Premises
-
By Geography
-
North America
- United States
- Canada
-
South America
- Brazil
- Argentina
- Rest of South America
-
Europe
- Germany
- France
- United Kingdom
- Italy
- Spain
- Russia
- Rest of Europe
-
Asia Pacific
- China
- Japan
- India
- South Korea
- Rest of Asia Pacific
-
Middle East
- Saudi Arabia
- United Arab Emirates
- Turkey
- Rest of Middle East
-
Africa
- South Africa
- Nigeria
- Rest of Africa
-
North America
Data Sources, Market Sizing, and Validation
Desk Research
Desk research is used to set the market boundaries and to anchor our assumptions on technology adoption and spend patterns. We start with public sources such as the US Bureau of Labor Statistics, the US Census Bureau, OECD digital economy indicators, and ITU connectivity statistics to understand the broader digital and services footprint behind deployments.
To keep the model tied to real-world use, we review sources such as NIST publications on face and speech evaluation, standards and guidance from ISO and IEC, and peer-reviewed journals covering affective computing and computer vision. These are then complemented with company annual reports, earnings call transcripts, investor presentations, and reputable press coverage to track product direction and pricing signals. When needed, paid subscriptions are used for company financial intelligence, patent lookups, and news screening to reduce gaps and double-check timelines. The sources listed here are not exhaustive, and additional references are reviewed for data collection, validation, and clarification.
Primary Interviews and Surveys
Primary interviews and short surveys are used to validate adoption patterns, pricing logic, and deployment mixes across cloud, edge, and on-premises setups. We typically speak with solution teams, system integrators, and end-user stakeholders across APAC, EMEA, and the Americas so gaps from desk research can be closed, and the final sizing assumptions can be stress-tested before sign-off.
Distribution of primary research fieldwork respondents
| Company type | Respondent position | Region |
|---|---|---|
| Top tier: 30% | CXOs: 17% | APAC: 47% |
| Mid tier: 49% | Functional/Unit leaders: 28% | EMEA: 34% |
| Smaller Players: 21% | Managers: 55% | Americas: 19% |
Market-Sizing & Forecasting
The market is first reconstructed using a top-down approach, where enterprise and public-sector digital spend pools are translated into an EDR demand pool through penetration and use-case attach rates by region and major end-user verticals. Once the demand pool is built, it is split across software and services, and then further aligned to common delivery patterns such as cloud versus edge/on-premises deployments.
To keep the totals realistic, we corroborate the outputs with selective bottom-up approximations such as sampled vendor revenue disclosure, solution pricing checks, and volume proxies from large deployment categories. Key inputs used in the model include the mix of facial versus speech and voice versus biosensing use, typical contract duration for analytics services, adoption pace in government and healthcare programs, AI workload migration to cloud and edge, and observable pricing movement for API-based emotion inference. When a bottom-up view is incomplete for smaller providers, we bridge the gap using peer-group revenue ranges and a conservative normalization of average selling prices, which is then rechecked through interviews.
For forecasting, scenario analysis is used with a base case that follows expected enterprise AI rollout cycles, followed by an upper and lower case that adjusts adoption speed and pricing pressure. The year-by-year path is then smoothed using exponential smoothing checks so the trend does not jump unrealistically between years, which keeps the forecast easy to trace and reproduce.
Data Validation & Update Cycle
Validation is done through multiple passes that compare the final totals against independent signals such as reported AI software growth, services intensity in major verticals, and region-level deployment sentiment shared by interviewees. When a segment shows unusual jumps, the assumptions are revisited, the inputs are rechecked for unit consistency, and follow-up calls are triggered to confirm whether the change is real or model-driven.
Before publication, the model and narrative go through an internal review so the logic, math, and scope interpretation stay consistent across sections. Reports are refreshed annually, and interim updates are made when material events occur, such as major regulation changes, sharp currency moves, or step-changes in enterprise buying. Right before delivery, a fresh pass is done to ensure the latest public developments are reflected in the final numbers clients see.
Mordor Intelligence's Emotion Detection and Recognition Edr Market Size Compared With Other Published Estimates
Published market sizes for EDR can differ even when the topic looks similar, because the year chosen, the currency conversion timing, and the way average selling prices are carried forward can move the total quite a lot. Differences also show up when one study counts hardware-heavy deployments broadly, while another focuses mainly on software and service revenues tied to emotion inference.
The spread is usually driven by three practical choices, which are scope boundary (software and services only versus including cameras and sensors), the base-year calendar used for currency and inflation adjustments, and how pricing is modeled as API usage scales. In this report, the refresh cadence and end-year currency alignment are handled as part of the annual update workflow, which helps keep the 2026 values consistent across regions and deployment models, a discipline applied by Mordor Intelligence.
Benchmark comparison
| Source | Market Size | Gaps in Research Methodology |
|---|---|---|
| Mordor Intelligence | USD 81.51 B (2026) | |
| Global Consultancy A | USD 42.83 B (2025) | Uses an earlier base year and a broader component lens that can blend software with hardware categories, and the longer horizon can also dampen near-term ASP changes compared with a tighter refresh cycle. |
| Industry Publisher B | USD 56.05 B (2024) | Starts from a different base year and tool definition, and the roll-forward can vary depending on how deployment mix and regional currency timing are treated when moving from 2024 into later years. |
Overall, the table shows that timing and boundary choices explain most of the difference, rather than a disagreement on the direction of growth. By keeping the scope tied to EDR software and services, and by checking pricing and adoption assumptions with real buyer and provider inputs, the final number stays traceable to clear variables and repeatable steps.


Key Questions Answered in the Report
What is the current value of the Emotion Detection and Recognition market?
The Emotion Detection and Recognition market size stands at USD 81.51 billion in 2026.
Which region leads spending on emotion AI solutions?
Asia Pacific holds the largest 33.70% revenue share, driven by China's AI infrastructure and Japan's automotive innovations.
Which application is growing fastest in emotion detection?
Automotive driver monitoring exhibits the highest 19.45% CAGR through 2031 due to safety mandates.
Why are bio-sensors gaining traction over facial recognition?
Bio-sensor approaches sidestep privacy concerns, meet healthcare compliance, and achieve robust emotion detection in low-light conditions.
How do privacy regulations affect adoption?
Statutes such as GDPR and CCPA impose explicit-consent and data-localization requirements, raising compliance costs and steering deployments toward edge processing.
What is the competitive outlook of the sector?
The market is moderately concentrated with strategic M&A; tech giants offer platform scale while niche vendors lead modality innovation.
Page last updated on:






