
Electronics Manufacturing Services Market Size and Share
Market Overview
| Study Period | 2020 - 2031 |
|---|---|
| Market Size (2026) | USD 663.34 Billion |
| Market Size (2031) | USD 909.32 Billion |
| Growth Rate (2026 - 2031) | 6.51 % |
| Fastest Growing Market | Asia Pacific |
| Largest Market | Asia Pacific |
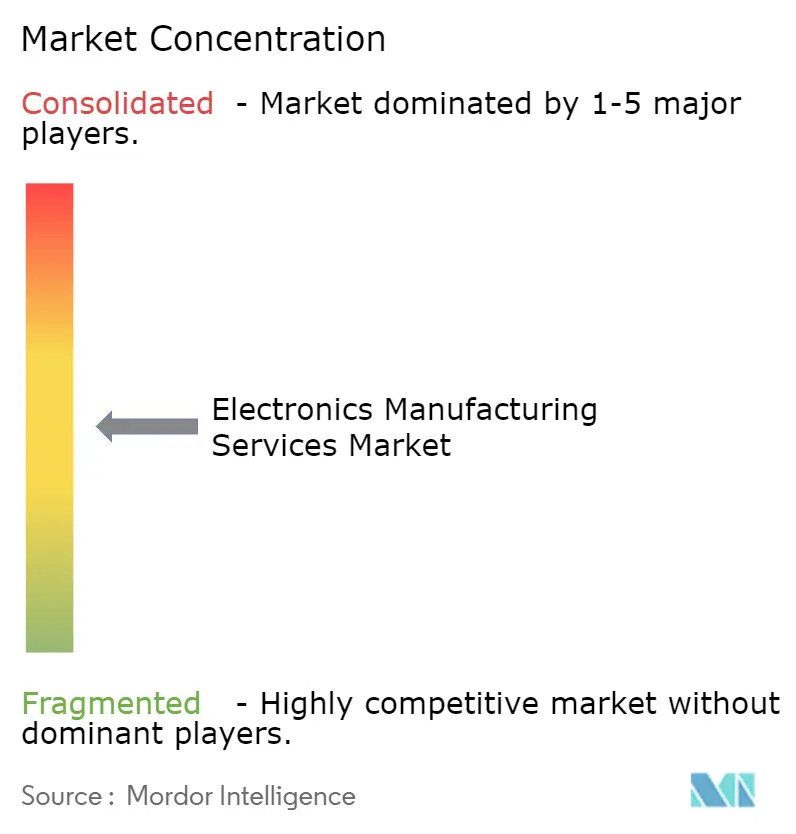
| Market Concentration | Medium |
Major Players *Disclaimer: Major Players sorted in no particular order Image © Mordor Intelligence. Reuse requires attribution under CC BY 4.0. | |
Electronics Manufacturing Services Market Analysis by Mordor Intelligence
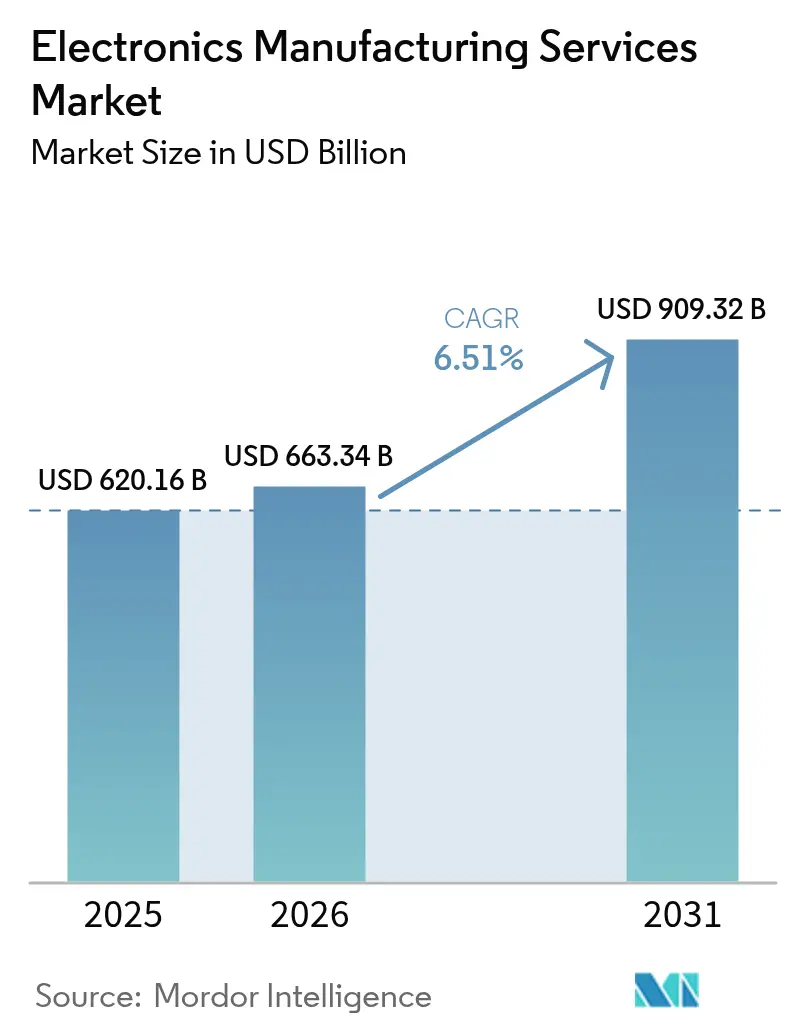
The Electronics manufacturing services market size is projected to be USD 620.16 billion in 2025, USD 663.34 billion in 2026, and reach USD 909.32 billion by 2031, growing at a CAGR of 6.51% from 2026 to 2031. Mature brands are funneling capital into chip design, software ecosystems, and go-to-market channels while off-loading factory ownership to contract assemblers. Near-shoring to Mexico and Eastern Europe, plus re-shoring inside ASEAN corridors, is reshaping purchase orders toward sites that balance cost with trade-agreement benefits. Electric-vehicle electronics are triggering step-function jumps in printed-circuit-board layer counts, thereby widening the capability gap between tier-1 and tier-2 assemblers. Edge-computing gateways, industrial sensors, and system-in-package modules are blurring boundaries between the Electronics manufacturing services market and back-end semiconductor assembly. Competitive intensity is rising because original design manufacturers integrate connectors, batteries, and acoustics, forcing pure-play contractors either to climb the value chain or accept lower-margin, build-to-print volumes.
Key Report Takeaways
- By service, printed-circuit-board assembly controlled 43.32% of 2025 revenue; electromechanical assembly and box build are advancing at a 6.83% CAGR to 2031.
- By business model, contract manufacturing accounted for 62.46% share of the Electronics manufacturing services market size in 2025; hybrid and turnkey models post the fastest 7.02% CAGR over 2026-2031.
- By manufacturing process, surface-mount technology delivered 54.37% of Electronics manufacturing services (EMS) market share in 2025, whereas advanced packaging and hybrid flows are set to expand at a 7.16% CAGR.
- By end-user, consumer electronics generated 38.94% of 2025 EMS market revenue; automotive applications accelerate at an 8.27% CAGR through 2031.
- By geography, Asia-Pacific led with 56.48% revenue in 2025 while South-East Asian corridors and India push the region to a 6.63% CAGR through 2031.
Note: Market size and forecast figures in this report are generated using Mordor Intelligence’s proprietary estimation framework, updated with the latest available data and insights as of 2026.
Market Trends and Insights
Drivers Impact Analysis of Electronics Manufacturing Services Market*
| Driver | (~) % Impact on CAGR Forecast | Geographic Relevance | Impact Timeline |
|---|---|---|---|
| OEMs Outsourcing to Focus on Core Competencies | +1.2% | Global, concentrated in North America and Europe | Medium term (2-4 years) |
| Accelerated Near- and Re-Shoring of Supply Chains | +1.5% | Mexico, Poland, Czech Republic, Romania, Vietnam, Thailand, Malaysia | Short term (≤ 2 years) |
| Surge in EV Power-Electronics Requiring Advanced PCB Assembly | +1.3% | Europe and China, spill-over to North America | Medium term (2-4 years) |
| Proliferation of IIoT Edge Devices Driving HDI and Advanced Packaging | +0.9% | China, Japan, South Korea, North America, Europe | Long term (≥ 4 years) |
| Government Tax Incentives for Domestic EMS Facilities | +0.8% | India, Vietnam | Short term (≤ 2 years) |
| AI-Driven Digital MES Improving First-Pass Yield | +0.7% | Tier-1 sites in Asia-Pacific and North America | Medium term (2-4 years) |
| Source: Mordor Intelligence | |||
OEMs Outsourcing to Focus on Core Competencies
Electronics brands are doubling down on silicon roadmaps and AI model training, shifting an expanding slice of mechanical and board-level work to external contractors.[1]Stephen Nellis, “Tech Companies Outsource More Manufacturing to Focus on AI Chip Design,” Reuters, reuters.com Apple’s choice to farm out state-of-the-art package assembly underscores the capital-intensive nature of high-fixed-cost factories and illustrates why even vertically integrated giants see value in the Electronics manufacturing services market. Product lifecycles below 18 months in smartphones and wearables heighten this migration, because internal fabs struggle to flex to rapid model changes. Smaller industrial and medical brands extend outsourcing beyond soldering into firmware flashing and regulatory dossiers, creating a two-tier field where engineering-rich providers capture margins 8-12 points higher than commodity handlers.
Accelerated Near- and Re-Shoring of Supply Chains
Tariff uncertainty and export controls sparked a 23% jump in 2025 plant announcements across Mexico, Poland, and Vietnam. Mexico’s 16% labor-cost edge versus coastal China plus USMCA duty-free status make it the preferred hub for power electronics and industrial controls. Eastern Europe secures medical-device subassemblies because EU customs harmonization trims door-to-door transit to under four days. Vietnam locks smartphone and acoustic module lines by offering decade-long corporate-tax holidays, while Thailand and Malaysia co-opt semiconductor back-end prowess to court chiplet in-package programs.[2]SEMI Editorial Team, “Advanced Packaging EMS Convergence,” SEMI, semi.org
Surge in EV Power-Electronics Requiring Advanced PCB Assembly
Silicon-carbide traction inverters now demand six-layer to eight-layer boards with embedded copper coins, driving capital investment in laser drilling, X-ray inspection, and thick-copper plating lines.[3]IEEE Staff, “Thermal Management PCB for EV Power Electronics,” IEEE Xplore, ieee.org Only 30% of tier-2 factories possessed these assets by late 2025, compelling automakers to award longer contracts to tier-1 Electronics manufacturing services market incumbents that hold IATF 16949 and ISO 26262 credentials. Jabil, Sanmina, and Celestica each earmarked USD 50-150 million for sequential-lamination and micro-via upgrades. Chinese assemblers co-locate next to battery cell gigafactories, slicing lead times from eight weeks to three.
Proliferation of IIoT Edge Devices Driving HDI and Advanced Packaging
Industrial gateways and smart sensors embed processors, radios, and power management in system-in-package modules that shrink board area by up to 70%, but require flip-chip bonders and laser-drilled micro-vias on 75 micron pitch. Contract manufacturers now bridge into outsourced semiconductor assembly and test, offering turnkey flows that trim logistics costs 12-18%. Functional-safety mandates such as IEC 61508 push demand for full serial-number genealogy from wafer lot to finished product. Data-sovereignty clauses in EU privacy law convince retailers and healthcare operators to favor regional assembly over transoceanic moves, reinforcing local Electronics manufacturing services market footprints.
Restraints Impact Analysis of Electronics Manufacturing Services Market*
| Restraint | (~) % Impact on CAGR Forecast | Geographic Relevance | Impact Timeline |
|---|---|---|---|
| Rising Semiconductor and Passive Component Cost Volatility | -0.9% | Asia-Pacific and North America | Short term (≤ 2 years) |
| Competition from ODMs and OEM In-House Lines in Smartphones | -0.6% | China and Taiwan, global spill-over | Medium term (2-4 years) |
| IP Protection Concerns Limiting Outsourcing in EU Aerospace and Defense | -0.4% | France, Germany, United Kingdom | Long term (≥ 4 years) |
| Environmental Compliance Raising Capex for Legacy Facilities | -0.5% | Europe, North America, China | Medium term (2-4 years) |
| Source: Mordor Intelligence | |||
Rising Semiconductor and Passive Component Cost Volatility
Spot prices for automotive-grade multilayer ceramic capacitors swung 35-50% between Q1 2025 and Q4 2025, crushing gross margins by up to 120 basis points for Electronics manufacturing services market participants that lacked long-term allocation deals. Microcontroller lead times ballooned from 12 to 26 weeks, compelling contractors to fund two additional months of inventory and freeze working capital that could have financed capacity upgrades. Tier-1 vendors with USD 5 billion or more in annual revenue wield leverage to secure priority allocation, whereas regional firms pay 20-40% spot premiums, weakening bids on consumer electronics programs.[4]Tripp Mickle, “Component Cost Volatility EMS Tier Structure,” Wall Street Journal, wsj.com Launch windows slipped four-to-eight weeks as engineers scrambled to redesign bills of material around scarce passives, derailing revenue recognition in the Electronics manufacturing services market.
Competition from ODMs and OEM In-House Lines in Smartphones
Original design manufacturers such as Luxshare and BYD Electronics integrate connectors, acoustics, and battery packs, marketing turnkey devices that erode addressable share for third-party assemblers. Flagship smartphone brands also pull elements of assembly back inside captive plants to protect intellectual property, squeezing volumes available to external partners. As screen sizes plateau and unit growth moderates, margin stacking within the Electronics manufacturing services industry becomes more acute, raising the threshold for economic order quantities that justify outsourcing. Contractors retaliate by diversifying into wearables and smart-home hubs, but those verticals carry lower average selling prices and press lesser volumes. The net consequence is a negative drag on overall Electronics manufacturing services market growth until automotive, industrial, and medical offsets mature.
*Our forecasts treat driver/restraint impacts as directional, not additive. The impact forecasts reflect baseline growth, mix effects, and variable interactions.
Electronics Manufacturing Services Market Segment Analysis
By EM Services:
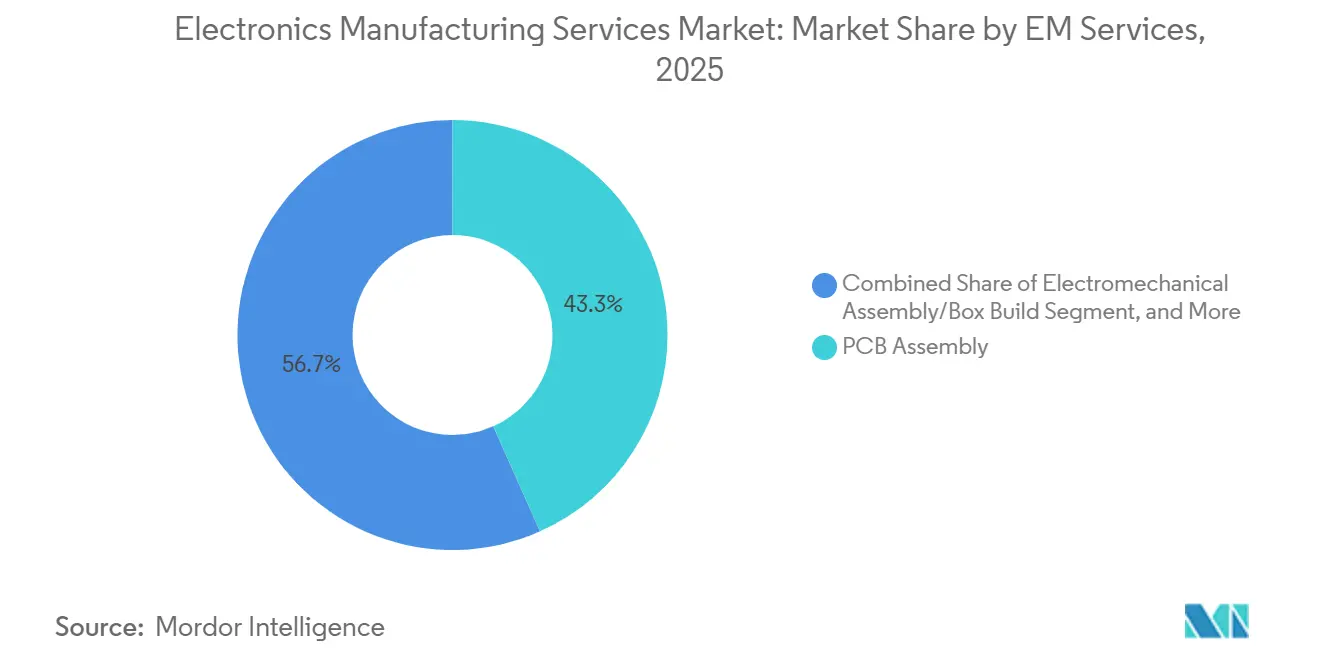
Box-Build Momentum Strengthens Customer Preference for Single-Source AccountabilityElectromechanical assembly and box build are forecast to expand at a 6.83% CAGR, outpacing the 6.51% headline growth of the Electronics manufacturing services market. Automotive and industrial buyers want one purchase order that covers cables, enclosures, and final test, trimming project lead time by two to three weeks. PCB assembly still held a 43.32% Electronics manufacturing services market share in 2025, but gross margins slipped below 6% on consumer-grade orders. Engineering services generate 30-50% higher revenue per program because brands need design-for-manufacturability checks and regulatory files for FDA and IEC audits.
Testing and development now command a growing budget slice as recalls in medical and automotive segments can climb past USD 100 million. Logistics add-ons such as configure-to-order fulfillment and vendor-managed inventory grant line-of-sight into constrained components, raising switching costs for customers. Prototyping with 48-hour turnarounds helps contractors lock in design wins before BOMs are frozen. Together, these value-added layers let tier-1 vendors defend margins in a core service that might otherwise commoditize. The Electronics manufacturing services market therefore tilts toward suppliers able to blend box build depth with engineering and supply-chain orchestration.



By Business Model:
Hybrid and Turnkey Programs Blur Classic EMS-ODM BoundariesContract manufacturing captured 62.46% of 2025 revenue, yet hybrid and turnkey models are projected to climb 7.02% each year through 2031. Start-ups without procurement muscle embrace turnkey deals even at 8-12% price premiums because they sidestep component sourcing risk. Automotive and industrial brands choose hybrid structures, supplying proprietary firmware while contractors design power stages and communication boards. This collaboration protects intellectual property and still harnesses external economies of scale.
Joint-development agreements deepen that alignment by sharing tooling costs in return for multi-year volume pledges. The structure forces customers to reveal roadmaps 18-24 months ahead, tightening vendor lock-in and stabilizing factory utilization. Original design manufacturers extend the model in consumer electronics by bundling connectors, batteries, and acoustics, which compresses the Electronics manufacturing services market size available to pure contract assemblers. Consequently, engineering depth and capital access now matter more than hourly labor rates. The landscape favors providers that can pivot among contract, hybrid, and design-rich programs without diluting returns.
By Manufacturing Process:
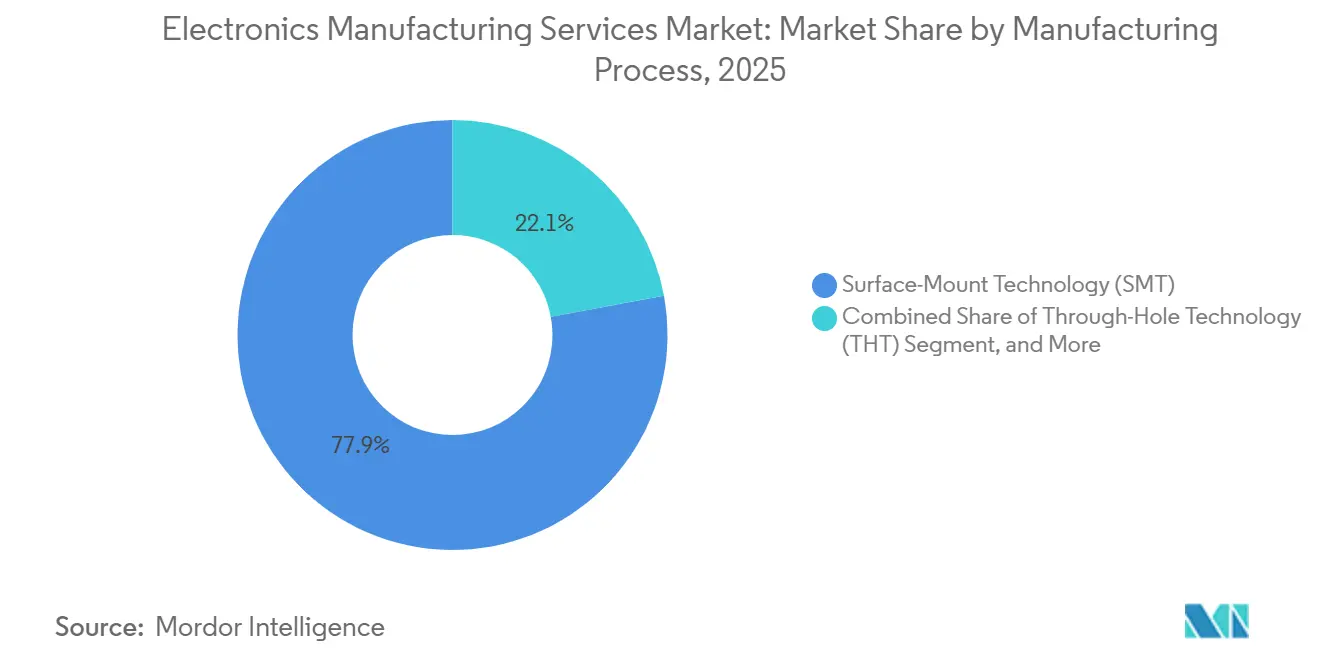
Advanced Packaging Convergence Expands EMS Scope Beyond SMTSurface-mount technology delivered 54.37% of process revenue in 2025, reflecting legacy dominance in smartphones and tablets. Density gains have slowed, so investment is flowing to chiplet-ready advanced packaging lines that should grow 7.16% a year. These flows combine wafer-level fan-out, flip-chip attach, and board integration under one roof, shaving interposer spend by 10-15%.
Traditional contractors are buying dicing saws and wire-bond tools, collapsing the gap between outsourced semiconductor assembly and the Electronics manufacturing services industry. Embedded-component boards support aerospace avionics and implantable medical devices, yet yields below 95% still cap penetration at under 5% of shipments. Through-hole stages linger in heavy-duty power and defense where field repairability matters. As a result, factory footprints now mix legacy SMT, thick-copper sequential lamination, and wafer-level packaging, letting suppliers capture wallet share across diverse customer roadmaps.
By End-User:
Automotive Electronics Outpaces Consumer Devices on EV TailwindsAutomotive revenue will post an 8.27% CAGR through 2031, the fastest among end-uses, as silicon-carbide inverters, battery-management systems, and radar controllers boost board counts and traceability mandates. Each electric vehicle can equal the semiconductor demand of three smartphones, elevating average selling prices on assembly programs.
Consumer electronics still generated 38.94% of 2025 turnover, but brand consolidation and rising in-house capacity compress margins. Industrial automation, medical devices, and communication infrastructure deliver steadier, regulation-anchored volumes that cushion smartphone cyclicality. Medical builds earn 15-25% pricing premiums by requiring ISO 13485 cleanrooms and unique-device identification labels. Meanwhile, private 5G networks in factories create a rebound path for communication hardware after the 2026 operator spending pause. These cross-currents keep the Electronics manufacturing services market diversified, with automotive growth balancing consumer maturity.
Geography Analysis
APAC Electronics Manufacturing Services Market
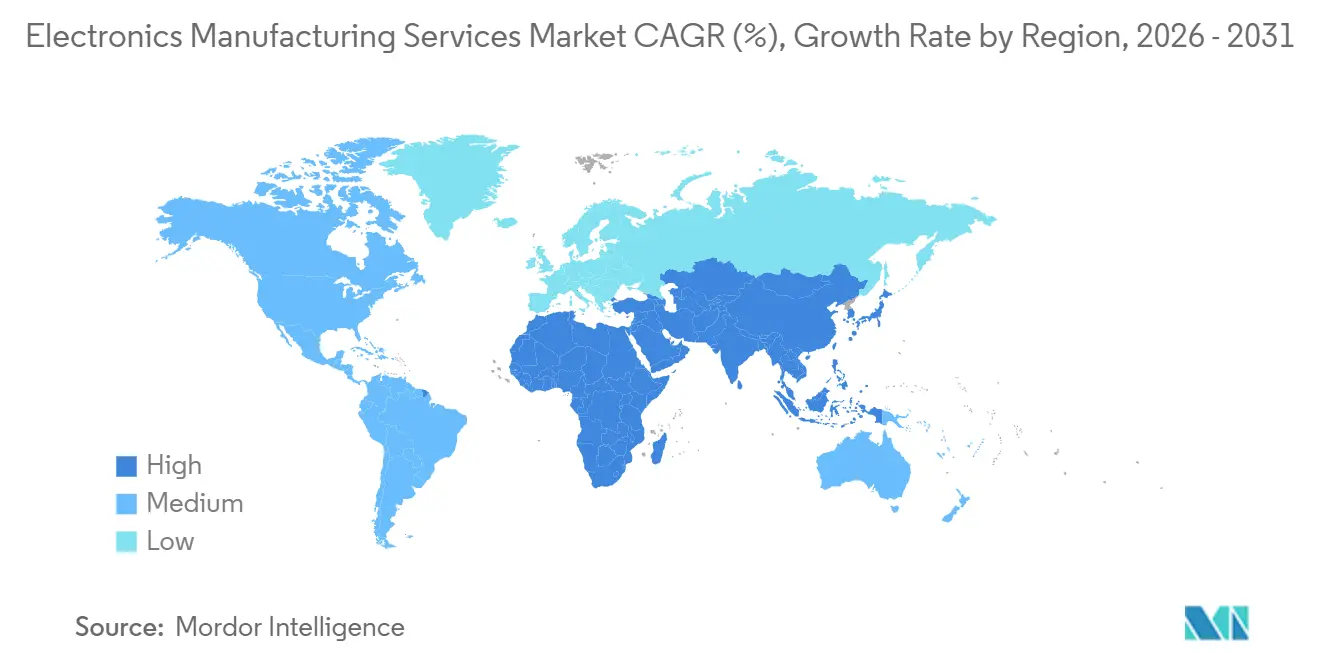
Asia-Pacific held 56.48% of global Electronics manufacturing services market share in 2025 and is projected to grow at a 6.63% CAGR through 2031. China provided the largest revenue base, Japan specialized in precision automotive and industrial modules, and South Korea remained dominant in display and memory-adjacent builds. India’s Production Linked Incentive program, which reimburses 4-6% of incremental sales, attracted fresh smartphone and appliance lines, while Vietnam’s ten-year corporate tax holidays drew acoustic modules and final assembly for premium handsets. Southeast Asian nations also upgraded packaging equipment so they can bid for chiplet integration projects that bridge semiconductor back-end and board assembly.
North America and Europe Electronics Manufacturing Services Market
Near-shoring has reshaped North American activity, with Mexico capturing the bulk of new capacity thanks to USMCA tariff relief, a 16% labor-cost edge over coastal China, and two-day truck routes to Texas design centers. The United States kept high-mix, low-volume lines for aerospace, defense, and medical devices where intellectual-property security offsets a 40-60% cost premium. Canada’s Ontario-Quebec corridor concentrated on automotive telematics and rugged industrial gateways, leveraging bilingual engineering talent and just-in-time logistics that meet Detroit and Midwest delivery windows. In Europe, Poland, Czech Republic, and Romania landed medical-device and automotive subassemblies because EU customs alignment allows same-week replenishment, while Germany, France, and the United Kingdom preserved flight-critical and defense electronics in domestic plants.
South America and MEA Electronics Manufacturing Services Market
South America and the Middle East and Africa contributed smaller slices of Electronics manufacturing services market size but show targeted momentum. Brazil’s telecommunications local-content rules and renewable-energy inverter programs anchor regional demand, encouraging contractors to localize through joint ventures with domestic distributors. South Africa’s push for grid-tied solar inverters and smart-meter rollouts nurtures niche box-build orders that reward suppliers skilled in harsh-environment conformal coating. Although absolute numbers remain modest, these pockets diversify revenue streams and provide future landing zones for providers eager to spread geopolitical risk.
Mordor Intelligence provides coverage of the electronics manufacturing services market across other key regional markets, including Europe, Asia, and North America, each with their regulatory frameworks and demand patterns. Detailed country-level analysis extends to United Kingdom, Taiwan, United States, China, Vietnam, India, and Thailand incorporating local coverage and market participation, as required.

Regulatory Landscape
EMS providers operate under a layered compliance stack that spans product safety, environmental rules, and trade and government procurement restrictions tied to semiconductor provenance. In January 2026, the United States imposed a 25% ad valorem duty on specific semiconductor articles and derivative products under Section 232, bringing tariff classification and end-use documentation into sourcing decisions for electronics and subassemblies that embed covered logic ICs.
Public-sector demand adds another compliance constraint on component selection and traceability. In February 2026, the US Federal Acquisition Regulatory Council proposed rules to implement Section 5949 of the FY2023 NDAA, which prohibits executive agencies from procuring products or services containing covered semiconductor products or services, with a full effectiveness date by December 23, 2027. For EMS players serving aerospace, defense, and critical infrastructure programs, compliance is shifting from RoHS/REACH-only workflows toward component-level declarations, supplier audits, and certification-ready bills of materials that can support government contracting requirements.
Value Chain Analysis
The EMS value chain starts with upstream electronic components and materials (ICs, passives such as MLCCs, connectors, copper-clad laminates, glass fabric, and industrial gases), then moves through PCB fabrication, PCB assembly (SMT/THT), electromechanical assembly and box build, and extends into test, compliance documentation, and logistics services such as configure-to-order fulfillment and vendor-managed inventory. OEMs and ODMs place programs with EMS providers that can combine engineering services (DFM/NPI), automated inspection, and end-to-end traceability, especially for automotive and industrial builds where standards and recalls raise the cost of quality escapes.
Recent supply-chain evidence suggests bottlenecks have migrated from finished components toward upstream materials and long-lead devices, reshaping procurement and inventory behavior across EMS networks. In Q2 2026, supply-chain risk tracking pointed to sharp memory contract-price increases tied to AI data-center demand, alongside extended lead times for certain discretes and MOSFETs. In July 2026, Murata pricing actions on MLCCs used in AI servers and high-end automotive further reinforced passives as a margin and availability swing factor. This environment increases the importance of distributor relationships, allocation agreements, and regional dual-sourcing, and it raises the value of EMS providers that can secure component supply while coordinating manufacturing footprints across Mexico, Eastern Europe, and ASEAN corridors.
Competitive Landscape
The five largest vendors, Foxconn, Pegatron, Flex, Jabil, and Luxshare, controlled roughly 35-40% of 2025 revenue, giving the Electronics manufacturing services market a moderate concentration profile that still leaves room for hundreds of regional specialists. Incumbents expand vertically into advanced packaging, system-in-package modules, and design consulting to defend margins that have fallen below 6% for commodity smartphone builds. Original design manufacturers raise the bar by bundling batteries, connectors, and acoustics, pushing pure contract assemblers either to buy niche technology or cede volume at thinner returns.
Strategic investments illustrate the race up the value ladder. Foxconn earmarked USD 500 million to install automotive power-module and AI-accelerator packaging lines in Bangalore, positioning the campus for Indian and European vehicle platforms. Jabil purchased a 120,000 square-foot ISO 13485 plant in Penang, adding cleanrooms and unique-device identification serialization that command premium pricing from regional medical brands. Flex secured a five-year USD 800 million battery-management contract that splits assembly between Poland and Mexico, proving that dual-continent footprints can win long-duration automotive awards.
Technology adoption now separates leaders from followers. Benchmark added collaborative robots and AI vision systems that lift first-pass yield above 98%, while Sanmina retrofitted Guadalajara with laser-drill micro-via and sequential-lamination presses to court high-density automotive boards. Celestica signed a turnkey die-to-board alliance with a Japanese chip supplier, compressing logistics and letting customers under one purchase order buy bare die, package, and finished board. As more programs demand chiplet architectures and regional compliance, suppliers that blend deep engineering, automated quality control, and multi-country capacity are positioned to capture outsized share even as headline growth moderates.
Electronics Manufacturing Services Industry Leaders
Vinatronic Inc.
Benchmark Electronics Inc.
Hon Hai Precision Industry Co. Ltd (Foxconn)
Flex Ltd.
Sanmina Corporation
- *Disclaimer: Major Players sorted in no particular order
Electronics Manufacturing Services Market Companies Covered in this Report
- Hon Hai Precision Industry Co., Ltd. (Foxconn)
- Pegatron Corp.
- Flex Ltd.
- Jabil Inc.
- Luxshare Precision Industry Co., Ltd.
- Wistron Corp.
- Sanmina Corp.
- Celestica Inc.
- Benchmark Electronics Inc.
- Plexus Corp.
- Compal Electronics Inc.
- Inventec Corp.
- Universal Scientific Industrial Co., Ltd. (USI)
- BYD Electronics (International) Co., Ltd.
- Shenzhen Kaifa Technology Co., Ltd.
- Asteelflash Group
- Kimball Electronics Inc.
- Sumitronics Corp.
- Nortech Systems Inc.
- Creation Technologies Ltd.
- Integrated Micro-Electronics Inc.
- Zollner Elektronik AG
- New Kinpo Group (Cal-Comp)
- SIIX Corp.
Read Analysis of Electronics Manufacturing Services Companies

Market Opportunities and Future Outlook
Capability-led investment in semiconductors and substrates is creating whitespace for EMS providers that colocate assembly, test, and advanced-packaging-adjacent processes near new fab and substrate clusters, reducing logistics risk and shortening new-product-introduction cycles. In June 2026, AT&S announced a EUR 1.5 to 2.0 billion expansion of its Kulim, Malaysia site for IC substrates and advanced PCBs, reinforcing Southeast Asia as a hub for higher-layer-count boards and packaging-compatible interconnect, where EMS firms can differentiate with HDI, sequential lamination, and reliability testing for AI infrastructure and automotive power electronics.
Regionalization and policy-driven supply-chain controls also open room for programs that require verifiable sourcing and government-ready compliance, not just low-cost assembly. The January 2026 US Section 232 duty on specified semiconductor articles and derivative products raises the importance of tariff-aware design choices, documentation, and country-of-origin planning across EMS footprints, while the proposed FAR rule implementing NDAA Section 5949 (full effectiveness by December 23, 2027) pushes contractors toward auditable component declarations and restricted-part screening. On the demand side, large semiconductor manufacturing commitments in 2026, including Intel investment at Leixlip, Ireland and expanded US manufacturing plans tied to TSMC, align with a broader shift toward tighter integration between chip supply, packaging, and electronics assembly, favoring EMS providers that can bundle advanced PCB assembly, system-level test, and compliance workflows under one purchase order.
Recent Industry Developments in Electronics Manufacturing Services Market
- June 2026: Hon Hai Technology Group (Foxconn) announced a USD 91.6 million investment across subsidiaries in Singapore, India, and Mexico, including a USD 37.2 million infusion into its India unit to expand manufacturing capabilities. The investment supports a more diversified manufacturing footprint aligned with near-shoring and regional capacity buildout for electronics assembly programs.
- April 2026: Flex expanded its long-running partnership with Teradyne Robotics to scale intelligent automation across Flex global manufacturing and to produce key robotics components for Teradyne. This extends automation deployment at the factory level and positions Flex for higher-complexity, productivity-driven manufacturing services.
- November 2025: Pegatron opened a USD 300 million campus in Haiphong, Vietnam, consolidating smartphone assembly and launching pilot system-in-package lines. Adding SIP capability alongside high-volume final assembly supports the market shift toward tighter integration between board assembly and advanced packaging workflows.


Electronics Manufacturing Services Market Report Scope and Research Methodology
Market Definition and Coverage
For this study, the electronics manufacturing services (EMS) market is defined as the revenues earned by contract and design-led manufacturers for building electronic products and sub-assemblies. This includes assembly, testing, and related manufacturing services delivered to OEMs across consumer, industrial, automotive, and other end industries.
Scope exclusions: Pure-play component sales, raw material trading, and in-house captive manufacturing done only for a brand's internal use are not counted as EMS market revenue.
Segments Covered in This Report
- By Service
- Electronic Manufacturing Services
- PCB Assembly
- Electromechanical Assembly/Box Build
- Prototyping
- Other Electronic Manufacturing Services
- Engineering Services
- Test and Development Implementation
- Logistics Services
- Other Services
- Electronic Manufacturing Services
- By Business Model
- Contract Manufacturing (CM)
- Original Design Manufacturing (ODM)
- Hybrid / Turnkey / Other Business Models
- By Manufacturing Process
- Surface Mount Technology (SMT)
- Through-Hole Technology (THT)
- Advanced Packaging / Hybrid Processes
- By End-user
- Mobile Devices (Smartphones and Tablets)
- Consumer Electronics
- Computer (PCs/Desktop/Laptops)
- Industrial
- Automotive
- Communication
- Lighting
- Medical
- Other End-users
- By Geography
- North America
- United States
- Canada
- Mexico
- Europe
- Germany
- United Kingdom
- Rest of Europe
- Asia-Pacific
- China
- Japan
- South Korea
- India
- South-east Asia
- Rest of Asia-Pacific
- South America
- Middle East and Africa
- North America
Data Sources, Market Sizing, and Validation
Desk Research
We start with desk research to lock the boundaries of what counts as EMS revenue and to collect measurable signals that move demand. Public sources are used to anchor the model, such as national statistical offices and manufacturing output series, UN Comtrade trade flows for electronics categories, World Bank macro indicators, and central bank exchange-rate histories for consistent currency conversion.
Next, we cross-check the demand side using sources such as industry and standards bodies for electronics production and test requirements, customs and port statistics for shipment movements, peer-reviewed journals for packaging and assembly trends, and reputed press plus company filings and investor presentations for capacity expansions and program wins. In parallel, a paid subscription focused on company financials and business intelligence is used to normalize revenue splits where disclosures are not directly comparable. These desk research inputs are not exhaustive, and additional public documents were also reviewed for data collection, validation, and clarification.
Primary Interviews and Surveys
Primary work is used to pressure-test the desk model and to fill gaps that are hard to see in public data, especially around utilization, pass-through pricing, and outsourcing intensity by end market. We speak with a mix of EMS executives, plant and quality leaders, procurement teams at electronics OEMs, and ecosystem experts across APAC, EMEA, and the Americas, so assumptions can be confirmed with on-the-ground operating reality.
Distribution of primary research fieldwork respondents
| Company type | Respondent position | Region |
|---|---|---|
| Top tier: 31% | CXOs: 16% | APAC: 39% |
| Mid tier: 48% | Functional/Unit leaders: 34% | EMEA: 37% |
| Smaller Players: 21% | Managers: 50% | Americas: 24% |
Market-Sizing & Forecasting
Sizing is built using a top-down approach where electronics output, export-import signals, and outsourcing penetration are used to reconstruct the addressable EMS revenue pool by region, and then split across major end-use electronics categories. Because published revenue labels vary, the model is corroborated with selective bottom-up approximations, such as sampled ASP times volume checks for common assemblies, supplier roll-ups for a limited set of disclosed programs, and channel discussions that help flag undercounting in fast-changing product cycles.
Inputs used in the model include electronics production indices, EMS capacity additions and utilization ranges, outsourcing intensity by end market (for example mobile devices versus industrial electronics), average assembly and test service pricing trends, and currency movement for major billing currencies. Where bottom-up data is missing for smaller or private players, gap-fills are applied using peer operating ranges and regional mix, and then totals are re-checked against trade and production signals to keep the uplift realistic. Forecasting is done using multivariate regression with scenario checks, where drivers like electronics output growth, regional manufacturing shifts, and pricing pass-through are adjusted based on expert consensus gathered in interviews.
Data Validation & Update Cycle
Before finalizing, we run multiple validation passes so the numbers do not rely on one data stream. Our team compares the modeled revenue path with independent indicators like electronics shipment trends, manufacturing PMI direction, and announced capacity changes, and then investigates variances that fall outside expected bands.
A second analyst review is completed to confirm definitions, math consistency, and year-to-year logic, followed by targeted re-contacts when interview feedback conflicts with the desk view. The report is refreshed annually, and interim updates are triggered when material events occur, such as major capacity moves, policy changes affecting electronics trade, or sharp currency swings. Right before delivery, a fresh update pass is done so clients receive the latest adjusted view.
Mordor Intelligence's Electronics Manufacturing Services Market Size Compared Against Other Published Estimates
Different published EMS market numbers often do not line up because the service boundary and the pricing math are handled differently, and the base year chosen can shift with currency timing. Differences can also arise when one estimate relies more on announced capacity and planned ramps, while another stays closer to booked manufacturing revenue and realized utilization.
In this study, the spread is mainly driven by how quickly exchange rates and average service pricing are refreshed during the base year, and how aggressively the model validates implied volumes against electronics output and trade signals. This is why the update cadence and currency cutoffs used by Mordor Intelligence can produce a different 2026 value than some other publications.
Benchmark comparison
| Source | Market Size | Gaps in Research Methodology |
|---|---|---|
| Mordor Intelligence | USD 663.34 B (2026) | |
| Global Consultancy A | USD 612.67 B (2024) | Uses an earlier base year and does not clarify currency conversion timing, which can shift the translated USD value for large APAC-heavy revenue pools. The public summary also provides limited detail on how ASP progression for assembly and test services is updated across the base year. |
| Industry Publisher B | USD 599.97 B (2024) | Runs on a 2024 base and applies a broad segmentation lens, but the public description does not explain how EMS revenue is separated from adjacent design or product categories when companies report blended lines. Differences can also come from how utilization and pass-through pricing are validated against external production and trade indicators. |
The table shows that the biggest variance comes from base-year timing and the way pricing and currency are kept consistent across regions. By keeping the model tied to observable demand signals and then re-checking assumptions through interviews, we produce a market total that is explainable and repeatable when the same inputs are updated forward.


Key Questions Answered in the Report
What is the projected size of the Electronics manufacturing services market by 2031?
The market is forecast to reach USD 909.32 billion by 2031.
Which end-user segment is expanding the fastest?
Automotive applications are advancing at an 8.27% CAGR through 2031, outpacing all other sectors.
Why are brands shifting production to Mexico and Eastern Europe?
USMCA and EU trade benefits, plus proximity to design centers, cut tariffs and shorten engineering feedback loops.
How are advanced packaging trends affecting EMS providers?
Chiplet and system-in-package architectures push contractors to install wafer-level fan-out and flip-chip tools, opening higher-margin service lines.
What share of revenue do the top five EMS vendors control?
Foxconn, Pegatron, Flex, Jabil, and Luxshare together hold roughly 35-40% of global revenue, indicating moderate concentration.
Page last updated on:


 Your data is secure and never sold or shared.


