EV Battery Testing Market Size and Share
Market Overview
| Study Period | 2019 - 2030 |
|---|---|
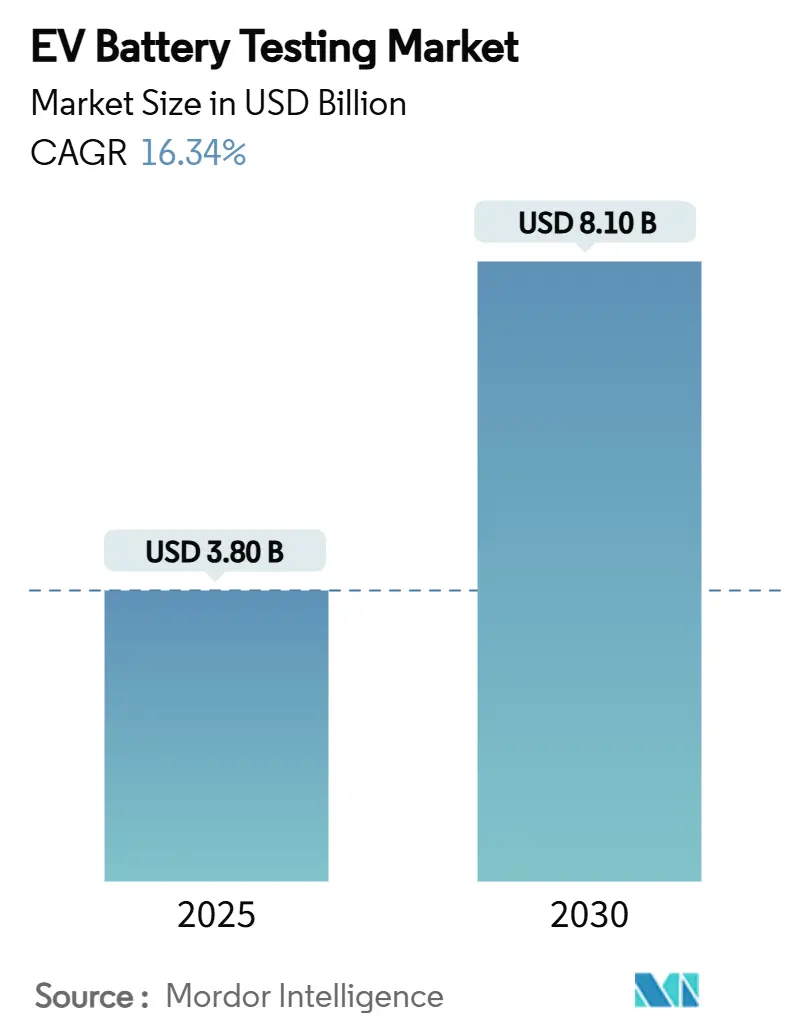
| Market Size (2025) | USD 3.80 Billion |
| Market Size (2030) | USD 8.10 Billion |
| Growth Rate (2025 - 2030) | 16.34% CAGR |
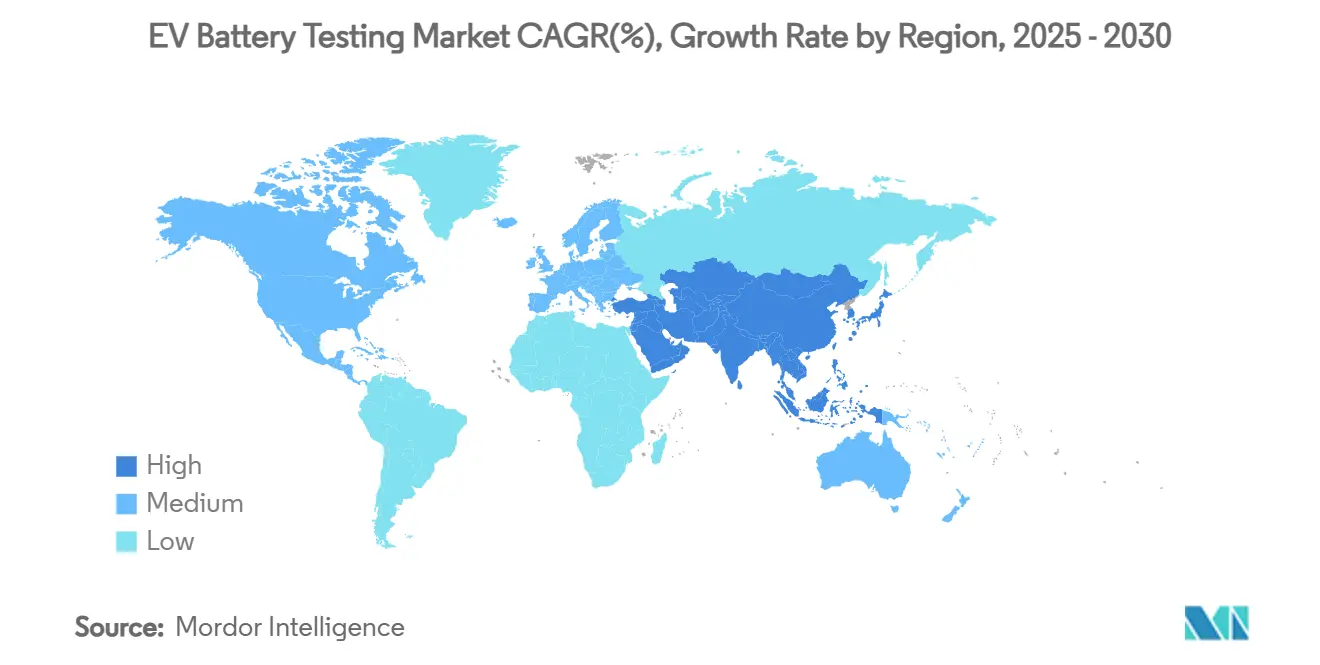
| Fastest Growing Market | Asia Pacific |
| Largest Market | Asia Pacific |
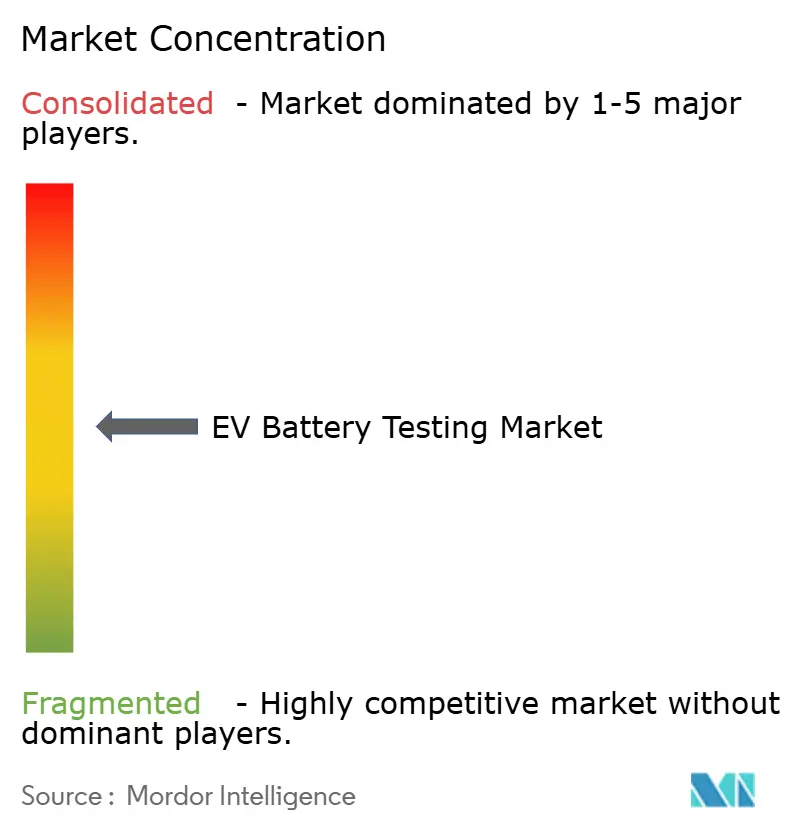
| Market Concentration | Medium |
Major Players *Disclaimer: Major Players sorted in no particular order Image © Mordor Intelligence. Reuse requires attribution under CC BY 4.0. | |
EV Battery Testing Market Analysis by Mordor Intelligence
The EV battery testing market size stands at USD 3.80 billion in 2025. It is forecast to reach USD 8.10 billion by 2030 on a 16.34% CAGR 2025-2030, reflecting demand growth generated by stricter safety rules, chemistry diversification, and megawatt-charging adoption. Increasing regulatory harmonization—exemplified by China’s GB38031-2025 thermal-runaway mandate—forces both automakers and third-party labs to upgrade infrastructure, accelerating capital spending and favoring extensive, multi-chemistry facilities. Parallel advances in predictive analytics, such as the US Army’s AI-enabled life-prediction models, are compressing test cycles while expanding data requirements, thereby widening the EV battery testing market opportunity for software-integrated service providers. Localization policies, government incentives, and OEM in-house lab buildouts multiply regional capacity needs, while high-energy chemistries, solid-state prototypes, and hydrogen fuel-cell stacks introduce fresh stress-test protocols. Consolidation among testing, inspection, and certification (TIC) players—highlighted by SGS and UL Solutions—signals intensifying competition to capture emerging validation revenue streams.
Key Report Takeaways
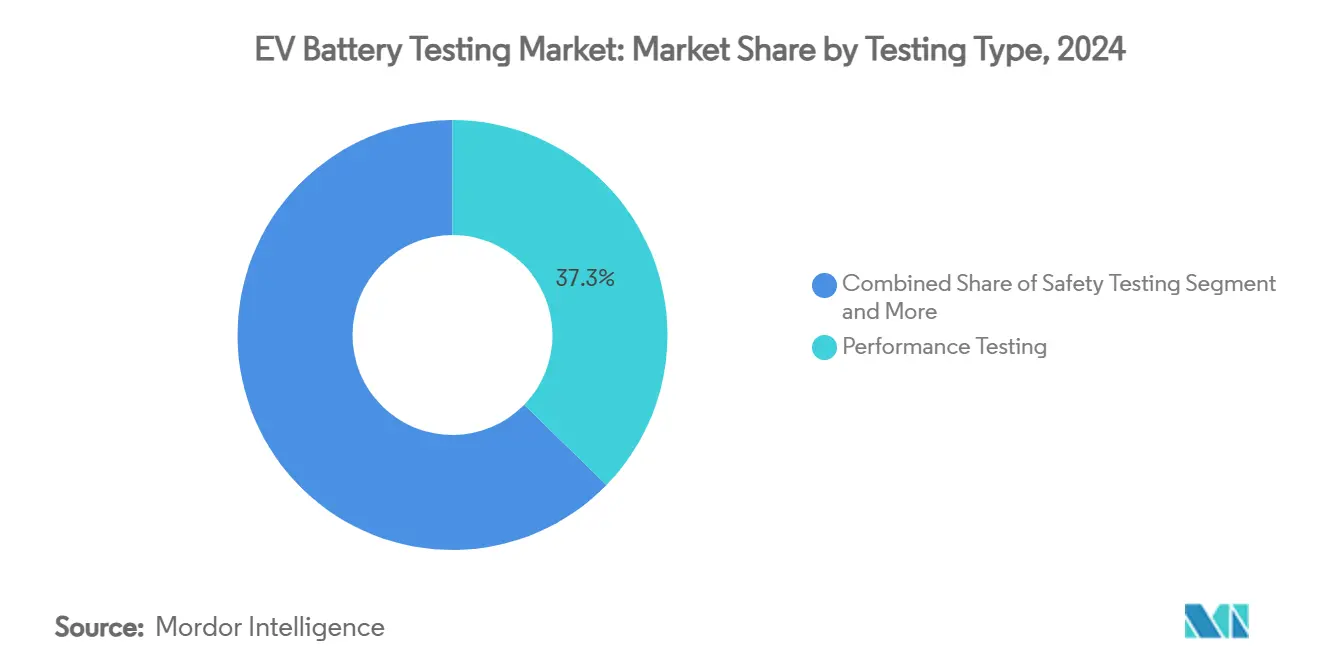
- By testing type, performance testing led with 37.28% of the EV battery testing market share in 2024; electrical and abuse testing is projected to expand at an 18.42% CAGR through 2030.
- By sourcing, in-house validation commanded 55.82% of the EV battery testing market size in 2024, while outsourcing is forecast to grow at 17.76% CAGR to 2030.
- By vehicle type, passenger-vehicle programmes accounted for 63.54% of the EV battery testing market in 2024; commercial-vehicle applications are advancing at a 16.47% CAGR through 2030.
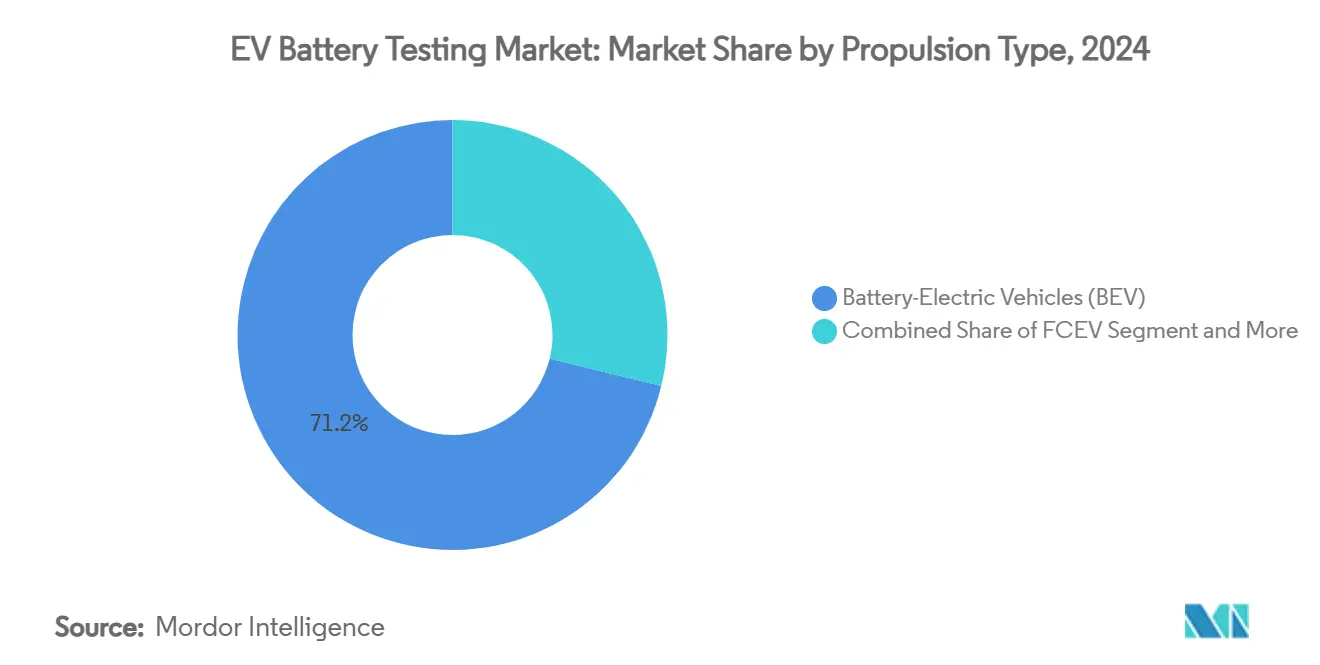
- By propulsion, battery-electric platforms captured a 71.18% share of the EV battery testing market in 2024, and fuel-cell EVs led growth at a 19.78% CAGR to 2030.
- By end user, automotive OEMs held 49.82% share in 2024, whereas third-party test houses exhibit the highest projected CAGR at 16.36% through 2030.
- By battery chemistry, Li-ion commanded 53.26% share of the EV battery testing market in 2024, while solid-state batteries are advancing fastest with 19.28% share and a double-digit CAGR
- By testing location, laboratory-based facilities held 70.85% share in 2024; virtual and digital-twin testing follows with 18.27% share and is the fastest-growing location segment.
- By geography, Asia-Pacific secured 43.28% of the EV battery testing market in 2024 and is moving ahead at a 17.83% CAGR toward 2030.
Global EV Battery Testing Market Trends and Insights
Drivers Impact Analysis*
| Driver | (~) % Impact on CAGR Forecast | Geographic Relevance | Impact Timeline |
|---|---|---|---|
| EV Adoption & Battery Growth | +3.3% | Global, with APAC core leadership | Medium term (2-4 years) |
| Global Battery-Safety Regulations | +2.9% | Global, EU and China leading | Short term (≤ 2 years) |
| OEM In-House Validation Shift | +2.5% | North America & EU, spill-over to APAC | Medium term (2-4 years) |
| Govt. Test Capacity Incentives | +2.0% | North America & EU primarily | Long term (≥ 4 years) |
| Megawatt-Charging Stress Tests | +1.6% | Global, early adoption in premium segments | Medium term (2-4 years) |
| Insurance Resale Certification | +1.3% | North America & EU mature markets | Long term (≥ 4 years) |
| Source: Mordor Intelligence | |||
Rapid EV Adoption and Battery-Production Growth
Scaling cell factories is outpacing legacy validation capacity, generating structural demand for the EV battery testing market. GM and LG Energy Solution’s USD 2.6 billion LFP investment in Tennessee requires adjacent test centers to manage multiple chemistry lines. Taiwan’s HCM-Saft partnership around LMFP compounds adds fresh protocols that legacy equipment cannot cover. Government-backed sites such as Forge Battery’s gigafactory contract in North Carolina further amplify regional infrastructure needs[1]“Forge Battery Grant Announcement,”, US Department of Energy, energy.gov. Each new gigawatt hour of output obliges proportional expansion of cycle-life, abuse, and environmental test lanes. As a result, equipment vendors and service providers face multi-year order backlogs stretching well beyond 2027.
Stringent Global Battery-Safety Regulations
China’s GB38031-2025 framework mandates enhanced thermal-runaway scenarios that few existing chambers can safely contain, triggering retrofit programs worldwide[2]“Enhanced Thermal Runaway Testing under GB38031-2025,”, Nature Communications, nature.com. The EU Battery Regulation 2023/1542 extends compliance to lifecycle and carbon-footprint verification, broadening the EV battery testing market beyond electrochemical metrics. UNECE R100 updates compel minimum safety thresholds that force midsize labs to reinvest in fire-suppression and gas-capture systems. Harmonization across major regions removes the option of region-specific setups, giving scale advantages to TIC majors. Automated rigs with AI-driven pass/fail logic gain traction as they can replicate standard protocols across plants on three continents with minimal operator intervention.
OEM Shift Toward In-House Validation Labs
Automakers are internalizing core validation to safeguard proprietary battery-management algorithms and compress development cycles, reshaping revenue pools within the EV battery testing market. Tesla’s integrated line from cell design to end-of-life assessment illustrates the competitive value of control. Ford’s USD 185 million Ion Park mirrors this playbook, spanning prototype pouch cells to solid-state modules. While large OEMs ring-fence advanced chemistry work, they increasingly outsource commodity regulatory tests to TIC specialists, creating a dual-source model. Supply-chain security concerns, especially around sensitive performance data, underpin this bifurcation. Consequently, TIC firms pivot toward high-throughput abuse and environmental services where IP sensitivity is lower yet capacity needs remain acute
Insurance-Led Resale-Grade Certification
Growing secondary-market trade of used EVs prompts insurers to demand third-party health certificates. These programs drive incremental demand for rapid impedance and residual-capacity assessments. North American insurers pilot resale-grade labels as a prerequisite for premium coverage on fleet disposal units. This driver creates a repeat-testing layer distinct from developmental or regulatory validation, opening a consumer-facing revenue stream for TIC providers that can standardize methods and turnaround times.
Restraints Impact Analysis*
| Restraint | (~) % Impact on CAGR Forecast | Geographic Relevance | Impact Timeline |
|---|---|---|---|
| High CAPEX for Test Chambers | -2.0% | Global, particularly affecting smaller players | Short term (≤ 2 years) |
| Lengthy Multi-Chemistry Protocols | -1.3% | Global, with regulatory complexity in EU/China | Medium term (2-4 years) |
| Shortage of Electro-Chemical Engineers | -1.0% | North America & EU primarily | Long term (≥ 4 years) |
| Digital-Twin Models Curbing Tests | -0.8% | Global, early adoption in premium segments | Medium term (2-4 years) |
| Source: Mordor Intelligence | |||
High CAPEX for Advanced Test Chambers
Modern thermal-runaway rigs can exceed USD 500,000 per unit and carry 18-month lead times, raising entry hurdles for regional players[3]“Cost Trends in High-Energy Test Chambers,”, AMETEK, ametek.com. Multi-chemistry support multiplies cost as facilities must house separate fixtures for LFP, NMC and solid-state modules. Environmental simulations—altitude, humidity, salt-spray—add further layers of expense. Capital intensity encourages mergers, shared hubs and equipment-leasing models, yet financing remains a top bottleneck that moderates network expansion against escalating demand.
Lengthy Multi-Chemistry Test Protocols
Regulators now require full validation cycles for each chemistry variant rather than family approvals, stretching project timelines. When lab space is constrained, stacked programs run in series instead of parallel, extending launch schedules for new platforms. Smaller OEMs face higher per-vehicle development costs, curbing their ability to refresh models quickly and limiting addressable demand growth for the EV battery testing market.
*Our forecasts treat driver/restraint impacts as directional, not additive. The impact forecasts reflect baseline growth, mix effects, and variable interactions.
Segment Analysis
By Testing Type: Safety Validation Surges amid Performance Dominance
Performance testing retained the largest 2024 share, yet electrical and abuse protocols are registering the fastest uptake as energy densities climb and regulators tighten thermal-runaway thresholds. The EV battery testing market size allocated to safety scenarios is forecast to expand at an 18.42% CAGR, driven by China’s GB38031-2025 requirements that compel chamber upgrades. OEMs still rely on capacity and power fade data across multiple drive cycles, explaining the enduring weight of performance suites. However, insurance, resale, and warranty considerations are enlarging abuse-test budgets, shifting procurement toward chambers capable of nail penetration, overcharge, and crush tests in a single session.
Lifecycle and environmental assessments are transitioning from niche to baseline under the EU Battery Regulation 2023/1542, which mandates carbon-footprint verification through end-of-life. AI-assisted aging models cutting time-to-result below 3% error further raise adoption. Emerging chemistries, notably solid-state stacks and lithium-sulfur prototypes, already require bespoke protocols outside conventional IEC-62660 frameworks. Providers that quickly codify these new methods stand to win disproportionate share within the EV battery testing market.


By Sourcing: Outsourcing Builds Momentum against In-House Stronghold
In-house labs preserved 55.82% of the EV battery testing market in 2024 as established automakers protect intellectual property behind factory gates. Yet outsourcing is projected to outpace at 17.76% CAGR, reflecting scale barriers facing startups and tier-two suppliers. The EV battery testing industry increasingly bifurcates: OEMs reserve developmental work, while third-party houses capture regulatory and endurance suites where confidentiality risk is low.
Consolidation is sharpening the value proposition of TIC majors able to amortize USD-intensive chambers across mixed customer rosters. SGS's USD 1.325 billion acquisition of ATS underscores this strategy. Smaller players increasingly pivot to regional specialization or chemistry-specific niches where agile service offsets lack of scale.
By Vehicle Type: Commercial Platforms Accelerate under Fleet Electrification
Passenger vehicles accounted for 63.54% of the EV battery testing market size in 2024, a function of volume dominance, yet commercial segments are on a steeper 16.47% CAGR trajectory through 2030. Fleet operators demand certified range, fast-charging resilience and total-cost-of-ownership clarity before placing large orders, prompting dedicated duty-cycle simulations.
Heavy-duty trucks and buses introduce extreme cycling, ambient and shock profiles, pressing labs to invest in higher-capacity dynos and thermal systems. Light commercial vehicles, propelled by urban logistics growth, require fine-tuned cold-crank and quick-turn charge validations. Passenger-vehicle test demand remains steady, though design convergence around skateboard architectures allows OEMs to reuse datasets across multiple models, slightly tempering incremental test volume growth.
By Propulsion: Fuel-Cell EVs Lead Growth on Heavy-Duty Routes
Battery-electric vehicles captured 71.18% of 2024 test volumes as they dominate model pipelines. However, fuel-cell platforms are slated for a 19.78% CAGR, reflecting hydrogen’s suitability for long-haul trucking and high-duty cycles. FCEV validation blends hydrogen-storage abuse tests, stack durability, and hybrid battery pack endurance, creating multi-discipline complexity.
Plug-in hybrids are tapering as regulatory targets tighten, and simple hybrids track as bridging technologies with muted upgrades. As fuel-cell deployment widens beyond pilots, specialized labs will face high entry thresholds around hydrogen safety and certification, offering premium margins versus commodity BEV protocols in the EV battery testing market.
By End User: TIC Providers Capture Outsourcing Wave
Automotive OEMs held 49.82% spending share in 2024, yet third-party labs enjoy a 16.36% CAGR outlook, propelled by chemistry diversification and regulatory sprawl. Battery manufacturers follow, needing multi-OEM, multi-jurisdiction validation. Certification bodies and R&D institutes collectively enlarge the EV battery testing market as post-sale recycling and second-life programs demand independent verification.
Strategic partnerships, like Element Materials Technology and TWAICE, merge physical infrastructure with predictive analytics, positioning providers to deliver holistic, compliance-ready datasets.
By Battery Chemistry: Mainstream Li-ion Dominance, Solid-State Momentum Builds
Li-ion cells accounted for 53.26% of the EV battery testing market share in 2024, underscoring their entrenched position as the reference chemistry for passenger and light-commercial models. High adoption volumes lock laboratories into IEC-62660 performance, abuse, and lifecycle suites, ensuring stable utilisation rates and predictable equipment-replacement cycles. The EV battery testing market size is tied to Li-ion; therefore, it benefits from economies of scale in chamber throughput, software templates, and test-fixture interchangeability. Cost-down pressure on NMC and LFP packs continues to widen addressable validation demand as new gigafactories come online across North America and Southeast Asia. Environmental-footprint verification mandated under EU Regulation 2023/1542 strengthens Li-ion test workloads by adding carbon-tracking, end-of-life, and recycling metrics to conventional performance assessments.
Solid-state batteries registered a 19.28% share and delivered the fastest incremental growth as OEMs such as Samsung SDI accelerate pilot production toward 2027. Dry-room particulate control, dendrite-suppression monitoring, and solid-electrolyte interface mapping create specialised protocols that command premium pricing inside the EV battery testing market. Early-stage variability in cell architecture drives longer validation cycles, lifting laboratory occupancy and revenue per programme. Government grant schemes that de-risk prototype lines in the United States, Japan, and Germany further expand solid-state demand for third-party compliance testing. Providers capable of co-developing standards with consortia and regulators are positioned to capture a disproportionate share of this emerging chemistry segment.
By Testing Location: Laboratory Anchors, Digital Twins Scale Up
Laboratory-based facilities represented 70.85% of the EV battery testing market size in 2024, reflecting regulator preference for tightly controlled temperature, humidity, and vibration environments that guarantee repeatability. Safety-critical abuse, nail-penetration, and thermal-runaway scenarios mandated by China’s GB38031-2025 can only be executed within purpose-built chambers equipped with gas-scrubbing and fire-suppression systems. High capital barriers limit new entrants, reinforcing the share for established TIC majors and OEM in-house labs. Laboratories also remain indispensable for certifying design changes, software updates, and material substitutions before production release, ensuring continued capacity utilisation even as virtual models gain traction.
Virtual and digital-twin testing captured 18.27% share, posting the fastest growth as AI-enabled life-prediction models cut physical cycling time by up to 80%. Cloud-based platforms ingest field telemetry, environmental conditions, and historical degradation patterns to simulate thousands of duty cycles overnight, allowing engineers to screen design options before scheduling chamber time. This approach trims prototype iterations, reduces sample-cell consumption, and lowers energy costs, especially for long-duration aging studies. Hybrid workflows that blend digital screening with targeted physical verification are becoming the default for multi-chemistry programmes, expanding demand for test-data-management software and model-validation audits. Laboratories that integrate real-time co-simulation links with digital-twin providers can maximise asset utilisation while capturing analytics-driven service revenue.
Geography Analysis
Asia-Pacific dominated the EV battery testing market with 43.28% share in 2024 and is tracking a 17.83% CAGR to 2030, fueled by China’s cell-manufacturing supremacy and synchronized safety standards. GB38031-2025 alone compels hundreds of new thermal-runaway chambers across mainland facilities. Japan’s initiative to train 30,000 battery technicians bundles funding for lab expansion, while South Korea’s K-Battery scheme provides matching grants for test-equipment imports. Indonesia’s raw-materials base—especially nickel—adds downstream demand for regional validation hubs co-located with refining complexes.
North America ranks second owing to an ecosystem of incentives and reshoring moves. The CHIPS and Science Act earmarks funds for co-located test infrastructure around new gigafactories, recognizing validation as critical infrastructure. Forge Battery’s USD 100 million DOE-backed project in North Carolina highlights state-federal alignment. GM-LG’s 2.6 billion-dollar LFP commitment adds pressure for high-throughput testing capacity in the US Southeast, widening the regional EV battery testing market footprint.
Europe preserves strong share on the back of stringent sustainability regulations and entrenched automotive R&D networks. The EU Battery Regulation’s lifecycle mandates elevate environmental and recycling tests to mainstream status. Germany anchors continental capacity through clusters around Munich and Stuttgart, while Hungary hosts Samsung SDI’s line aimed at serving EU-based OEMs. Nordic labs leverage abundant renewable energy to run energy-intensive aging protocols at lower operating costs, further diversifying European service offerings.

Competitive Landscape
The EV battery testing market remains moderately fragmented, yet consolidation momentum is building. SGS’s USD 1.325 billion ATS acquisition and UL Solutions’ purchase of BatterieIngenieure reinforce a pattern where TIC majors scale via M&A to secure multi-chemistry capability and cross-regional reach. These moves offset CAPEX burdens and talent shortages by pooling resources, while smaller independents pivot toward niche chemistries or regional fleet-testing specialisms.
Technology is the emerging differentiator. Providers integrating digital twins, AI-driven degradation analytics and automated fixture loading reduce cycle times by double-digit percentages, boosting asset utilization. TWAICE’s software partnership with Element Materials Technology exemplifies the convergence of data science and hardware testing, offering clients single-dashboard oversight from prototype to field performance.
White-space opportunities lie in solid-state test methodologies, megawatt-charging endurance and second-life certification. Early movers with proven protocols can command premium price points before commoditization sets in. Conversely, labs that remain single-chemistry or manual-process centric risk margin squeeze as clients gravitate toward automated, full-cycle providers.
EV Battery Testing Industry Leaders
SGS
Intertek Group
TÜV SÜD
DEKRA
UL Solutions
- *Disclaimer: Major Players sorted in no particular order

Recent Industry Developments
- July 2025: Samsung SDI accelerated solid-state battery production to 2027, opening pilot lines in Suwon and announcing a USD 3.5 billion joint venture with General Motors for a 30 GWh Indiana plant, expanding solid-state testing demand.
- July 2025: Taiwan’s HCM partnered with Saft to commercialize lithium manganese iron phosphate batteries, supported by Taiwan’s ITRI, creating new LMFP validation protocols.
- July 2025: GM and LG Energy Solution confirmed LFP cell production at Spring Hill, Tennessee, investing USD 2.6 billion and necessitating local validation infrastructure.


Global EV Battery Testing Market Report Scope
| Performance Testing |
| Safety Testing |
| Lifecycle / Environmental Testing |
| Electrical & Abuse Testing |
| Others |
| In-house |
| Outsourcing |
| Passenger Vehicles | Hatchback |
| Sedan | |
| Sport Utility Vehicle and Multi-purpose Vehicle | |
| Commercial Vehicles | Light Commercial Vehicles (LCV) |
| Medium and Heavy Commercial Vehicle |
| Battery-Electric Vehicles (BEV) |
| Plug-in Hybrid EV (PHEV) |
| Hybrid EV (HEV) |
| Fuel-Cell EV (FCEV) |
| Automotive OEMs |
| Battery Manufacturers |
| R&D Institutes |
| Third-party Test Service Providers |
| Regulatory & Certification Bodies |
| Li-ion (NMC/NCA) |
| Lithium-Iron-Phosphate (LFP) |
| Solid-state Batteries |
| Nickel-Metal Hydride |
| Others |
| Laboratory-based |
| In-field / On-site |
| Virtual / Digital-Twin |
| North America | United States |
| Canada | |
| Rest of North America | |
| South America | Brazil |
| Argentina | |
| Rest of South America | |
| Europe | Germany |
| United Kingdom | |
| France | |
| Italy | |
| Spain | |
| Russia | |
| Nordics | |
| Rest of Europe | |
| Asia-Pacific | China |
| Japan | |
| India | |
| South Korea | |
| Australia | |
| Southeast Asia | |
| Rest of Asia-Pacific | |
| Middle East and Africa | UAE |
| Saudi Arabia | |
| Turkey | |
| South Africa | |
| Rest of Middle East and Africa |
| By Testing Type | Performance Testing | |
| Safety Testing | ||
| Lifecycle / Environmental Testing | ||
| Electrical & Abuse Testing | ||
| Others | ||
| By Sourcing | In-house | |
| Outsourcing | ||
| By Vehicle Type | Passenger Vehicles | Hatchback |
| Sedan | ||
| Sport Utility Vehicle and Multi-purpose Vehicle | ||
| Commercial Vehicles | Light Commercial Vehicles (LCV) | |
| Medium and Heavy Commercial Vehicle | ||
| By Propulsion | Battery-Electric Vehicles (BEV) | |
| Plug-in Hybrid EV (PHEV) | ||
| Hybrid EV (HEV) | ||
| Fuel-Cell EV (FCEV) | ||
| By End User | Automotive OEMs | |
| Battery Manufacturers | ||
| R&D Institutes | ||
| Third-party Test Service Providers | ||
| Regulatory & Certification Bodies | ||
| By Battery Chemistry | Li-ion (NMC/NCA) | |
| Lithium-Iron-Phosphate (LFP) | ||
| Solid-state Batteries | ||
| Nickel-Metal Hydride | ||
| Others | ||
| By Testing Location | Laboratory-based | |
| In-field / On-site | ||
| Virtual / Digital-Twin | ||
| By Geography | North America | United States |
| Canada | ||
| Rest of North America | ||
| South America | Brazil | |
| Argentina | ||
| Rest of South America | ||
| Europe | Germany | |
| United Kingdom | ||
| France | ||
| Italy | ||
| Spain | ||
| Russia | ||
| Nordics | ||
| Rest of Europe | ||
| Asia-Pacific | China | |
| Japan | ||
| India | ||
| South Korea | ||
| Australia | ||
| Southeast Asia | ||
| Rest of Asia-Pacific | ||
| Middle East and Africa | UAE | |
| Saudi Arabia | ||
| Turkey | ||
| South Africa | ||
| Rest of Middle East and Africa | ||


Key Questions Answered in the Report
What is the current EV battery testing market size?
The EV battery testing market size is USD 3.80 billion in 2025 and is projected to reach USD 8.10 billion by 2030 on a 16.34% CAGR.
Which region leads the EV battery testing market?
Asia-Pacific holds 43.28% share in 2024 and is expanding at 17.83% CAGR through 2030, propelled by China’s regulatory standards and manufacturing dominance.
Which testing type grows the fastest?
Electrical and abuse testing is the fastest-growing category, forecast at an 18.42% CAGR to 2030 due to stringent safety regulations.
What role do digital twins play in battery validation?
Digital-twin and AI models can cut physical cycling by 80% while improving accuracy, pushing labs to integrate virtual workflows alongside chamber testing.
Which propulsion technology shows the highest test-demand growth?
Fuel-cell EVs lead with a 19.78% CAGR through 2030, reflecting hydrogen adoption in heavy-duty transport and the need for specialized validation.
Page last updated on:


