Electric Vehicle Supply Equipment Market Size and Share
Market Overview
| Study Period | 2019 - 2030 |
|---|---|
| Market Size (2025) | USD 19.86 Billion |
| Market Size (2030) | USD 66.21 Billion |
| Growth Rate (2025 - 2030) | 27.23% CAGR |
| Fastest Growing Market | Middle East and Africa |
| Largest Market | Asia Pacific |
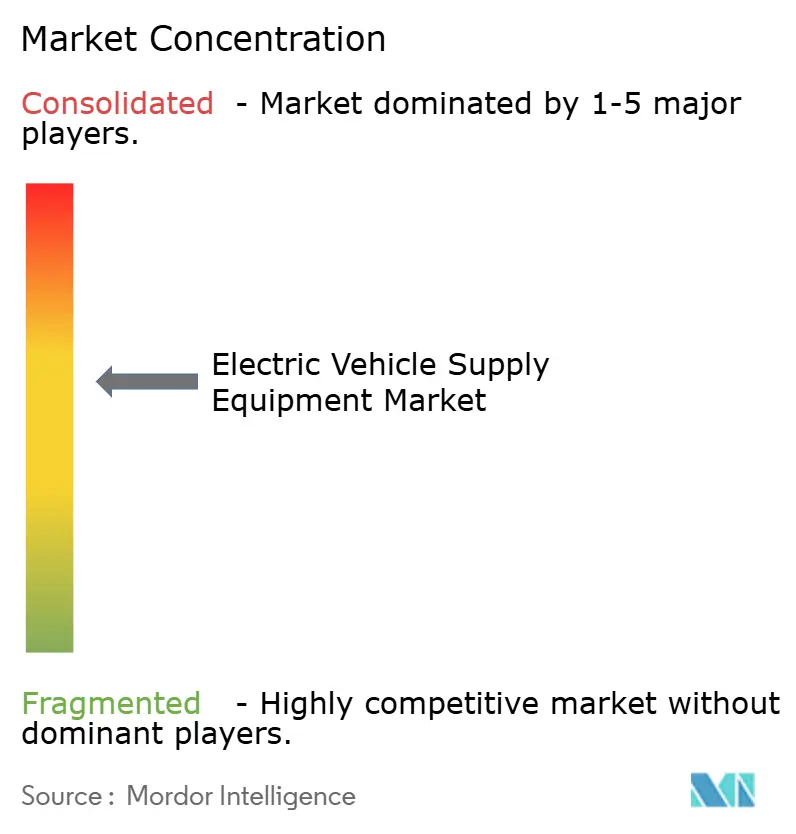
| Market Concentration | Medium |
Major Players *Disclaimer: Major Players sorted in no particular order Image © Mordor Intelligence. Reuse requires attribution under CC BY 4.0. | |

Electric Vehicle Supply Equipment Market Analysis by Mordor Intelligence
The electric vehicle supply equipment market size is valued at USD 19.86 billion in 2025 and is projected to reach USD 66.21 billion by 2030 after expanding at a 27.23% CAGR during the forecast period (2025-2030), pointing to one of the fastest structural shifts in global transport infrastructure. Federal incentives, corporate fleet electrification, and falling DC fast-charging hardware costs converge to shorten payback periods, elevate private capital appetite, and spur new charging-as-a-service business models. Mature network planning now replaces opportunistic single-site projects, enabling corridor buildouts that support long-distance EV travel. Supply–demand dynamics increasingly favor integrators that bundle hardware, software, and grid-interactive capabilities rather than companies focused solely on equipment sales. Investment opportunities, therefore, arise for innovators who can solve grid constraints through load management, storage, and bidirectional power flows.[1]“Biden-Harris Administration Announces $521 Million in Grants to Expand Electric Vehicle Charging Infrastructure,” U.S. Department of Energy, ENERGY.GOV
Key Report Takeaways
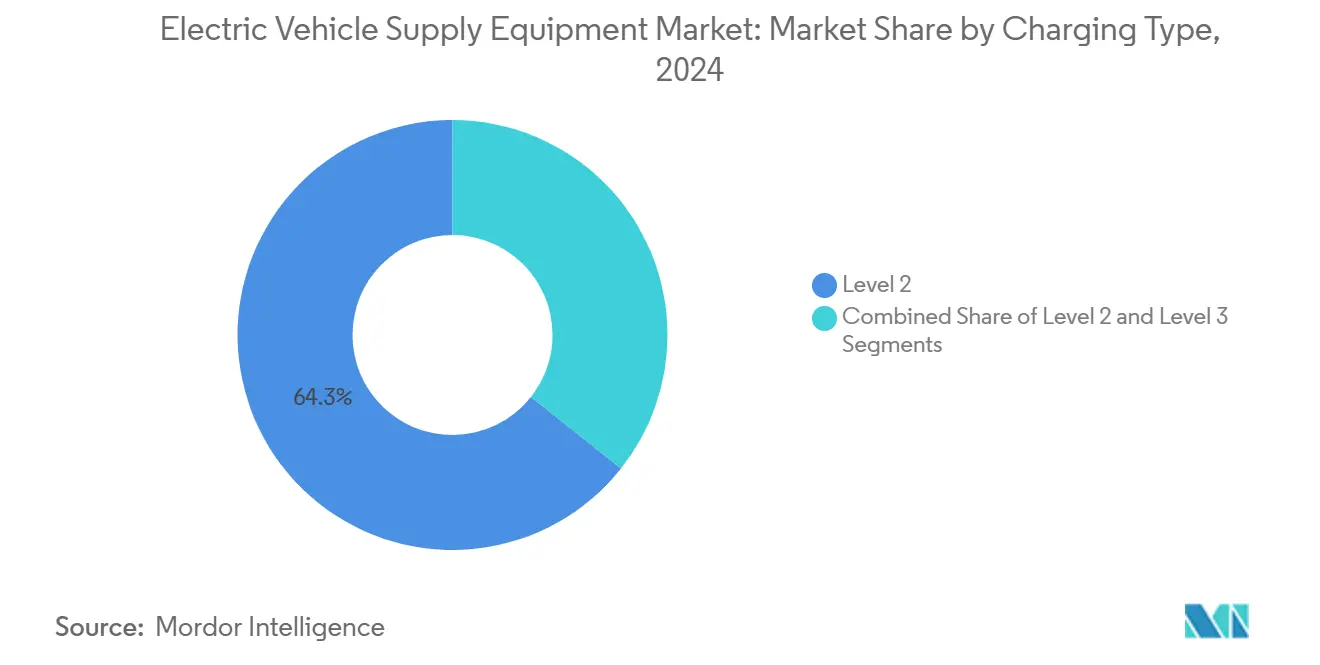
- By charging type, Level 2 AC systems led with 64.34% of the electric vehicle supply equipment market share in 2024, while Level 3 DC fast charging is projected to advance at a 30.45% CAGR during the forecast period (2025-2030).
- By installation type, fixed chargers accounted for 82.72% of the electric vehicle supply equipment market size in 2024; portable solutions are forecasted to expand at a 33.15% CAGR during the forecast period (2025-2030).
- By power type, AC charging captured 73.53% revenue share of the electric vehicle supply equipment market share in 2024, whereas DC systems are projected to grow at 29.73% CAGR during the forecast period (2025-2030).
- By application, commercial public stations held 46.98% share of the electric vehicle supply equipment market size in 2024, and fleet garages are projected to progress at a 28.07% CAGR during the forecast period (2025-2030).
- By end user, EV owners represented 40.85% of the electric vehicle supply equipment market share in 2024, while charge-point operators are poised for the fastest 29.71% CAGR during the forecast period (2025-2030).
- By geography, Asia-Pacific captured 39.83% share of the electric vehicle supply equipment market size in 2024, whereas the Middle East and Africa is projected to register the fastest CAGR of 29.19% during the forecast period (2025-2030).
Global Electric Vehicle Supply Equipment Market Trends and Insights
Drivers Impact Analysis*
| Driver | (~) % Impact on CAGR Forecast | Geographic Relevance | Impact Timeline |
|---|---|---|---|
| EV Infrastructure Incentives | +0.8% | Global, with concentration in North America and Europe | Medium term (2-4 years) |
| Corporate ESG Commitments | +0.6% | North America and Europe core, expanding to APAC | Medium term (2-4 years) |
| Declining DC Fast-Charger Hardware Costs | +0.6% | Global | Short term (≤ 2 years) |
| Increasing Battery Capacities | +0.4% | Global, led by premium vehicle segments | Long term (≥ 4 years) |
| Grid-Interactive Bi-Directional Charging | +0.3% | North America and Europe pilots, APAC commercial deployment | Long term (≥ 4 years) |
| Charging-As-A-Service Subscription Models | +0.2% | Global, with early adoption in North America | Medium term (2-4 years) |
| Source: Mordor Intelligence | |||
Government EV Infrastructure Incentives
Federal and regional programs now underwrite a dependable revenue floor that triggers private buildouts.In the United States, federal funding programs reimburse developers consistently for each charging port they install. This approach not only guarantees a steady cash flow for developers but also minimizes their financial risks, fostering greater involvement in EV charging initiatives. Europe’s Alternative Fuels Infrastructure Regulation requires 400 kW coverage every 60 km, prompting unified technical standards and a co-financing facility[2]“Alternative Fuels Infrastructure Regulation Implementation,” European Commission, EUROPA.EU. Together, these policies trim payback periods from historical 7–10 years to 3–5 years while concurrently simplifying permits through pre-approved design templates and streamlined interconnection rules. National-level credits cascade into state and provincial matchmaking portals that align site hosts, utilities, and financiers, removing earlier bottlenecks around land acquisition and queue assignment.
Corporate ESG Commitments Accelerating Workplace Charging Demand
Companies, spurred by corporate sustainability commitments, are converting parking areas into energy hubs. They're positioning EV charging not just as a workplace perk but also as a strategy to cut down on indirect emissions. There's been a notable uptick in participation in global fleet alliances, with ambitions now set on millions of charging points. Employers are tapping into generous federal incentives to mitigate installation costs, reaping the added benefit of enhanced employee retention. Developers, with an eye on the future, are weaving charging infrastructure into building designs, making it a hallmark of premium office spaces. Consequently, the demand for EV charging is transitioning from the traditional evening residential peaks to a more balanced midday usage. This shift aligns seamlessly with utility objectives, aiming to stabilize energy demand and enhance solar power integration.
Rapid Decline in DC Fast-Charger Hardware Costs
Global hardware costs for fast-charging systems have dropped significantly in recent years, driven by the adoption of more efficient power modules. This cost reduction allows network operators to achieve profitability with lower usage rates, expanding the number of viable installation sites. Standardization around widely adopted charging protocols has streamlined component inventories, shortened delivery timelines, and enabled bulk purchasing advantages. Additionally, increased manufacturing capacity in Asia and new domestic production in North America have diversified the supply chain, helping to stabilize prices and reduce vulnerability to fluctuations in semiconductor availability.
Increasing Battery Capacities Necessitating Higher-kW Chargers
Premium electric vehicles are now equipped with larger battery packs, leading to heightened expectations for charging speeds that rival traditional refueling. Meanwhile, commercial platforms are experimenting with ultra-fast charging technologies, aiming to achieve long-range replenishment in mere minutes. Yet, transitioning to these elevated power levels poses intricate challenges for grid infrastructure. Charging sites demand specialized electrical connections, individual high-capacity transformers for each stall, and enhanced switchgear—all contributing to a significant uptick in initial development costs. Yet higher throughput shortens driver dwell time, increasing stall cycles per day and ultimately bolstering gross margin if electricity procurement costs are hedged through energy-storage buffering.[3]“ORNL Demonstrates Wireless Charging for Electric Vehicles at 270 Kilowatts,” Oak Ridge National Laboratory, ORNL.GOV
Restraints Impact Analysis*
| Restraint | (~) % Impact on CAGR Forecast | Geographic Relevance | Impact Timeline |
|---|---|---|---|
| Installation and Grid-Upgrade Costs | -2.4% | Global, particularly acute in rural and developing regions | Short term (≤ 2 years) |
| Uneven Utilization Rates | -1.6% | North America and Europe suburban/rural areas | Medium term (2-4 years) |
| Semiconductor Supply Shortages | -1.1% | Global, with regional variations | Short term (≤ 2 years) |
| Multi-Jurisdiction Permitting Delays | -1.0% | North America and Europe fragmented regulatory environments | Medium term (2-4 years) |
| Source: Mordor Intelligence | |||
High Upfront Installation and Grid-Upgrade Costs
Building high-powered public EV charging sites continues to require substantial upfront investment, especially in areas with limited grid infrastructure. Extending power lines in rural regions adds considerable cost, and ongoing transformer shortages are causing long delays and inflated equipment prices compared to previous years. These capital expenditures often occur well before any revenue is generated, putting pressure on cash flow and increasing financing costs—particularly in high-interest environments. While emerging utility partnerships help ease some of the financial burden, smaller site hosts still face challenges due to limited financial flexibility. Policy tools like accelerated depreciation and shared financing models are designed to broaden access to ownership, but they have yet to scale sufficiently to meet growing demand.
Uneven Utilisation Rates Depressing ROI for Public Stations
In suburban areas, EV charging stations often see low usage, falling short of levels needed for strong financial returns. While holiday traffic surges can create temporary demand spikes, these moments mask the long stretches of underutilization that dominate most of the year. Seasonal factors, such as a reduced driving range in cold weather and fewer trips during winter, further depress usage. In response, operators are trying out flexible pricing, reservation features, and strategic placement near retail locations to boost revenue. Yet, unpredictable usage patterns pose a significant challenge when planning new sites. Even though data-driven site selection tools are enhancing forecast accuracy, financial institutions have been slow to adopt these metrics, limiting access to flexible financing options.
*Our forecasts treat driver/restraint impacts as directional, not additive. The impact forecasts reflect baseline growth, mix effects, and variable interactions.
Segment Analysis
By Charging Type: DC Fast Charging Drives Premium Growth
Level 2 systems still anchor 64.34% of the electric vehicle supply equipment market size in 2024 demand as cost-effective solutions for multifamily housing, workplaces, and municipal parking. Level 3 DC fast chargers recorded the fastest 30.45% CAGR trajectory and redefine user expectations for convenience on intercity corridors. The segment’s climb builds on battery chemistries that tolerate sustained 250–350 kW input, lowering perceived range anxiety and catalyzing road-trip electrification. Meanwhile, Level 1 trickle outlets continue a shrinking niche, acting chiefly as backup options during grid outages.
Hardware convergence around standardized connectors slashes per-unit cost, aiding mass rollout. Early-mover networks leverage transparent kWh pricing to win loyalty, whereas new entrants differentiate via loyalty apps, amenities, and uptime guarantees. Over the forecast window, the electric vehicle supply equipment market will see corridor charging hubs evolve into multi-megawatt complexes with café, retail, and micro-storage add-ons, generating ancillary revenue in addition to electrons sold.


By Installation Type: Fixed Infrastructure Dominates Despite Portable Innovation
Fixed installations accounted for 82.72% of the revenue of the electric vehicle supply equipment market size in 2024, underscoring the centrality of permanent grid ties and site amenities to user confidence. Portable chargers, though only 17.28% of the 2024 stock, scale at a 33.15% CAGR as fleet operators exploit temporary depots and event organizers deploy pop-up charging. Underground conduits, camera security, and weatherproof housings elevate capex but ensure asset longevity and favorable insurance terms. Commercial landlords increasingly opt for turnkey service contracts that bundle equipment, software, and preventive maintenance.
Battery-backed trailer units bypass transformer queues and provide resilience during disasters, enhancing perceived brand reliability. As utilization data matures, expect redeployable assets to migrate between hotspots, optimizing fleet duty cycles while avoiding stranded investment risk. The electric vehicle supply equipment market will thus balance permanence with agility, tailoring asset classes to location tenure and power-availability constraints.
By Power Type: AC Charging Maintains Dominance Amid DC Expansion
AC charging captured 73.53% revenue of the electric vehicle supply equipment market size in 2024, leveraging the widespread availability of AC electrical infrastructure and lower installation costs that make it accessible for residential, workplace, and low-power commercial applications. Modern AC equipment reaches 96% efficiency, narrowing operating-cost gaps with DC counterparts. Residential overnight sessions stabilize grid load and unlock time-of-use arbitrage for owners who enroll in utility demand-response programs.
DC power charging grows at 29.73% CAGR, driven by corridor charging requirements and commercial fleet applications where rapid turnaround times justify higher infrastructure investments. Expansion hinges on modular power-electronics cabinets that scale from 150 to 600 kW without new pads, protecting host ROI against technology leapfrogging. Within the electric vehicle supply equipment market, hybrid AC/DC sites emerge, combining overnight fleet parking with daytime public fast charging to level load curves and boost stall turnover.
By Application: Commercial Public Stations Anchor Infrastructure
Commercial public stations owned a 46.98% share of the electric vehicle supply equipment market size in 2024, reflecting their role as the primary infrastructure backbone for EV adoption among consumers without access to home charging. Retail co-location encourages customer dwell-time spending that offsets energy margins, creating a symbiotic landlord-operator relationship. Integration of point-of-sale and loyalty platforms fortifies revenue against commodity electricity price swings.
Fleet garages, advancing at 28.07% CAGR, demand megawatt-scale power connections bundled with telematics-enabled scheduling. Depot operators pursue energy arbitrage using on-site storage to shave peak tariffs and optimize charge windows around route tables. Residential and workplace classes remain foundational but exhibit slower growth as saturation rises. Collectively, these patterns position the electric vehicle supply equipment market as a portfolio of differentiated real-estate formats, each pairing utilization profile with tailored financing.

By End User: Professional Operators Scale Networks
EV owners commanded 40.85% revenue share of the electric vehicle supply equipment market size in 2024, reflecting the consumer-driven nature of charging infrastructure demand. Yet charge-point operators (CPOs) posting 29.71% CAGR signal the transition toward professionalized asset management. Aggregators exploit economies in procurement, call-center support, and grid-services monetization, lifting return profiles beyond those available to fragmented owner-operators.
Fleet operators ink multi-year power-as-a-service deals that outsource installation, grid liaison, and preventive upkeep. Utilities test ownership models that fold charging into the regulated rate base, unlocking lower capital costs but posing competitive neutrality debates. Government agencies remain pivotal early-stage buyers in rural or low-income districts, guaranteeing coverage where private payback remains thin. The electric vehicle supply equipment market thus mirrors telecommunications, where infrastructure specialists coexist with service-layer brands atop shared physical networks.
Geography Analysis
Asia-Pacific maintained a 39.83% share of the electric vehicle supply equipment market size in 2024 as China installed 4.2 million new points, proof of centrally orchestrated scale and cost leadership. The region’s dense supply chain compresses project capex, while integrated planning aligns charger rollout with expressway upgrades. India’s policy stack accelerates domestic manufacturing and subsidizes depot builds for e-bus fleets, whereas Japan and South Korea prioritize ultra-high-power testbeds that pioneer 1 MW protocols. Emerging ASEAN markets leverage cross-border payments and roaming agreements to nurture tourism corridors, expanding the addressable base for network operators. Fast-growing urban centers and two-wheeler electrification further diversify the demand palette.
North America advances at a 24.56% CAGR underpinned by the NEVI framework that funnels money through states based on highway mileage, ensuring balanced rural and urban coverage. Canada’s complementary grant pool and Mexico’s nascent corridor program create a contiguous ecosystem stretching from British Columbia to the Yucatán. Harmonized connector adoption following major automaker alignment around NACS simplifies driver experience and fosters supplier scale economies. Europe progresses at 23.78% CAGR as the AFIR mandates transform aspirational climate targets into binding infrastructure quotas. Countries race to install 400 kW hubs every 60 km, embedding redundancy within Trans-European Transport Network corridors. Germany funds public chargers in lower-income districts, while the Netherlands experiments with lamppost-based curbside ports that repurpose existing power drops.
The Middle East and Africa log the highest 29.19% CAGR, propelled by Gulf energy diversification agendas. The UAE targets 1,000 public chargers by 2025 and co-locates solar canopies to showcase green credentials. Saudi Arabia’s plan for 5,000 chargers across 1,000 sites by 2030 meshes with giga-factory investments, anchoring a regional supply hub. Jordan’s surprise 66.5% EV sales share in Q1 2024 signals potential leapfrog adoption when policy alignment and consumer incentives coincide. South Africa pioneers municipal public-private partnerships to fund depot chargers for minibus taxis, illustrating varied pathways suited to local grid realities.


Competitive Landscape
The EV supply equipment market exhibits moderate fragmentation, indicating substantial opportunities for market share gains through strategic positioning and technological differentiation. Such distribution places the electric vehicle supply equipment market in a moderately concentrated posture, leaving meaningful headroom for regional specialists and technology-rich newcomers. Hardware-plus-software propositions dominate, exemplified by platforms that overlay demand-response, energy arbitrage, and predictive maintenance onto standardized power cabinets. Strategic alliances between equipment OEMs and automotive giants expedite consumer trust while accelerating connector standard consolidation.
M&A momentum remains steady as capital-intensive requirements drive scale-seeking behavior. Infrastructure-investment funds acquire back-office operators for recurring cash-flow streams, while utilities purchase depot assets to secure long-term electricity sales. White-space opportunities surface in rural corridor hubs, heavy-duty fleet depots, and high-latitude cold-weather zones needing temperature-resilient designs. Entrants featuring mobile charging or modular battery-buffered skids capture event-based revenue where permanent connections lag.
Regional policy asymmetry creates localized moats. European operators adept at navigating multi-language payment regulations hold edge over global peers, while U.S. players specializing in NEVI compliance forms seize first-mover advantage in federal-funded tranches. Competitive pressure increasingly shifts to total cost-of-ownership propositions as price per kW converges; differentiation thus gravitates to uptime performance, API openness, and energy-trading features that unlock ancillary income for site hosts.
Electric Vehicle Supply Equipment Industry Leaders
ChargePoint Holdings Inc.
Tesla Inc.
ABB Ltd.
Siemens AG
Schneider Electric SE
- *Disclaimer: Major Players sorted in no particular order

Recent Industry Developments
- September 2025: Tata Power inaugurated Mumbai’s first premium MegaCharger hub with eight DC fast chargers and 16 bays to reduce queuing times.
- September 2025: AGL Energy launched a residential vehicle-to-grid technology trial aiming for network-wide rollout in 2026.
- July 2025: Martindale Electric debuted an EV socket tester for Type 2 connectors, enhancing installation safety checks across Europe.


Global Electric Vehicle Supply Equipment Market Report Scope
| Level 1 |
| Level 2 |
| Level 3 (DC Fast Charging) |
| Portable Charger |
| Fixed Charger |
| AC Power |
| DC Power |
| Residential | |
| Commercial | Public Stations |
| Fleet Garages | |
| Workplace |
| EV Owners |
| Fleet Operators |
| Charge Point Operators (CPOs) |
| Utilities |
| Government Agencies |
| North America | United States |
| Canada | |
| Rest of North America | |
| South America | Brazil |
| Argentina | |
| Rest of South America | |
| Europe | United Kingdom |
| Germany | |
| Spain | |
| Italy | |
| France | |
| Russia | |
| Rest of Europe | |
| Asia-Pacific | India |
| China | |
| Japan | |
| South Korea | |
| Rest of Asia-Pacific | |
| Middle-East and Africa | United Arab Emirates |
| Saudi Arabia | |
| Turkey | |
| Egypt | |
| South Africa | |
| Rest of Middle-East and Africa |
| By Charging Type | Level 1 | |
| Level 2 | ||
| Level 3 (DC Fast Charging) | ||
| By Installation Type | Portable Charger | |
| Fixed Charger | ||
| By Power Type | AC Power | |
| DC Power | ||
| By Application | Residential | |
| Commercial | Public Stations | |
| Fleet Garages | ||
| Workplace | ||
| By End User | EV Owners | |
| Fleet Operators | ||
| Charge Point Operators (CPOs) | ||
| Utilities | ||
| Government Agencies | ||
| By Geography | North America | United States |
| Canada | ||
| Rest of North America | ||
| South America | Brazil | |
| Argentina | ||
| Rest of South America | ||
| Europe | United Kingdom | |
| Germany | ||
| Spain | ||
| Italy | ||
| France | ||
| Russia | ||
| Rest of Europe | ||
| Asia-Pacific | India | |
| China | ||
| Japan | ||
| South Korea | ||
| Rest of Asia-Pacific | ||
| Middle-East and Africa | United Arab Emirates | |
| Saudi Arabia | ||
| Turkey | ||
| Egypt | ||
| South Africa | ||
| Rest of Middle-East and Africa | ||


Key Questions Answered in the Report
How large is the global electric vehicle supply equipment market in 2025?
The electric vehicle supply equipment market size stands at USD 19.86 billion in 2025.
What is the projected CAGR for charging infrastructure through 2030?
The electric vehicle supply equipment market is forecast to expand at a 27.23% CAGR between 2025 and 2030.
Which charging type is growing fastest?
Level 3 DC fast charging is posting a 30.45% CAGR, outpacing all other segments.
Which region currently leads deployment?
Asia-Pacific leads with 39.83% 2024 market share, driven primarily by China’s buildout.
What key policy accelerates U.S. deployments?
The USD 7.5 billion National Electric Vehicle Infrastructure (NEVI) program funds nationwide corridor buildouts.
Page last updated on:


