
Egypt Fruits And Vegetables Market Analysis by Mordor Intelligence
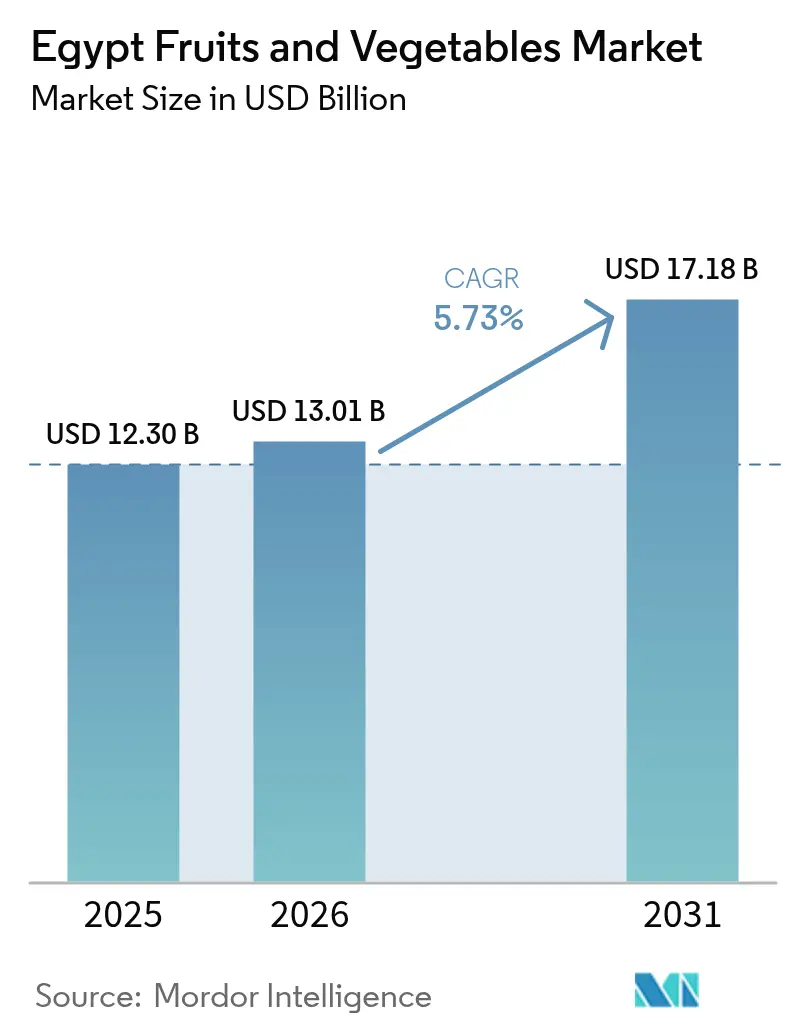
The Egypt fruits and vegetables market size is expected to grow from USD 12.3 billion in 2025 to USD 13.01 billion in 2026 and is forecast to reach USD 17.18 billion by 2031 at 5.73% CAGR over 2026-2031. The market benefits from government-backed export incentives, rising precision-irrigation adoption, and expanding cold-chain capacity. Infrastructure projects such as the grain storage hub in the Suez Canal Economic Zone and the world’s largest desalination station strengthen supply-side resilience. Export volumes continue to climb on the back of competitive pricing created by a floating exchange-rate regime, while domestic e-grocery platforms deepen urban penetration. Persistent post-harvest loss rates and water scarcity still cap potential output gains, urging rapid technology uptake and improved logistics.
Key Report Takeaways
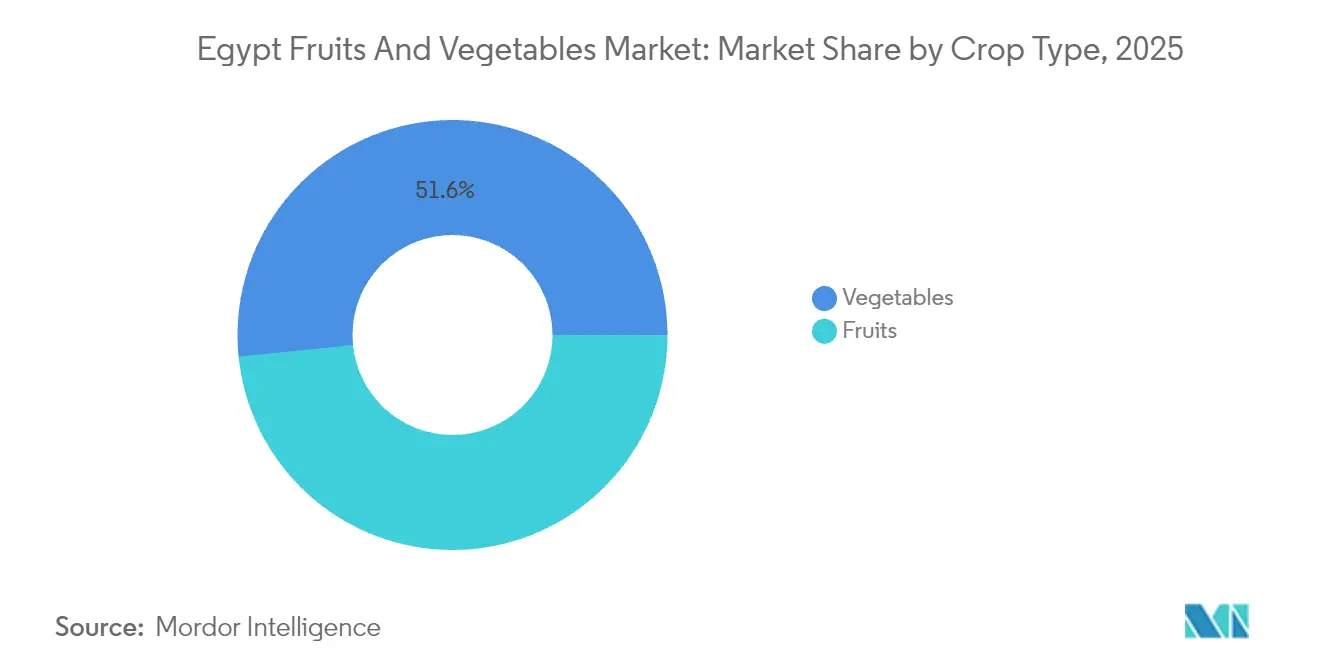
- By crop type, vegetables led with 51.60% Egypt fruits and vegetables market share in 2025, and fruits posted the fastest 6.7% CAGR through 2031.
Note: Market size and forecast figures in this report are generated using Mordor Intelligence’s proprietary estimation framework, updated with the latest available data and insights as of 2026.
Egypt Fruits And Vegetables Market Trends and Insights
Drivers Impact Analysis*
| Driver | (~) % Impact on CAGR Forecast | Geographic Relevance | Impact Timeline |
|---|---|---|---|
| Climate-resilient seed adoption | +1.2% | National, with early gains in Delta, Upper Egypt | Medium term (2-4 years) |
| Government export-rebate program revival | +0.8% | National, concentrated in export-oriented regions | Short term (≤ 2 years) |
| Expansion of cold-chain logistics capacity | +0.9% | National, priority in Alexandria, Cairo corridors | Medium term (2-4 years) |
| Rising United States demand for off-season specialty produce | +0.6% | Export regions, particularly Nile Delta | Long term (≥ 4 years) |
| Surge in precision-irrigation investments | +1.1% | National, focus on reclaimed desert areas | Medium term (2-4 years) |
| Rapid growth of domestic e-grocery platforms | +0.4% | Urban centers, expanding to secondary cities | Short term (≤ 2 years) |
| Source: Mordor Intelligence | |||
Climate-resilient seed adoption
Climate-resilient seed varieties deliver 45% higher yields in drought and heat-exposed zones of the Nile Delta and Upper Egypt. Government-led breeding programs release cold-tolerant rice genotypes such as Giza 176 and Sakha 104 that enable earlier planting windows and buffer temperature shocks. Application of biocontrol strains Trichoderma harzianum and Bacillus subtilis cuts Fusarium incidence in Vicia faba fields and elevates nitrogen fixation[1]“Crop Water Productivity as Influenced by Irrigation Improvement in the Nile Delta,” American Society of Agricultural and Biological Engineers, asabe.org. The Sustainable Agricultural Development Strategy 2030 underwrites technology transfer agreements that funnel hybrid seeds fivefold more productive than traditional cultivars into commercial channels.
Government export-rebate program revival
The reinstated export-rebate program trims logistics costs and streamlines customs protocols, lifting agricultural exports. Export diversification strategies target emerging markets, with frozen potato exports demonstrating exceptional growth year-over-year, primarily serving Sudan, Yemen, Palestine, and Somalia. The government's commitment to reducing trade barriers aligns with the broader economic strategy to increase non-oil export revenues and enhance agricultural sector competitiveness in regional markets. Currency liberalization widened foreign-exchange availability for inputs while enhancing price competitiveness abroad.
Expansion of cold-chain logistics capacity
United States Agency for International Development (USAID) sponsored CoolBot conversions allow smallholders to repurpose air-conditioning units as low-cost chillers, cutting temperature-driven losses by 25–40% and adding up to 40% income. Private investment follows: Sharp Corporation and Elaraby Group’s Horizon venture is slated to assemble 400,000 refrigerators annually by 2026, positioning Egypt as a regional cold-equipment hub. Government-backed logistics zones in El Wadi El Gedid attract USD 80.6 million for date and crop storage. The Suez Canal Economic Zone grain terminal incorporates advanced refrigeration for 4–6 million metric tons throughput, anchoring regional supply chains.
Rising United States demand for off-season specialty produce
Complementary harvest calendars open premium windows for Egyptian exporters. Strawberry exports climbed to 45,000 metric tons in 2024, and monthly U.S. import data reveal growing slots for grapes, oranges, and strawberries during North American off-season months. Streamlined SPS protocols, particularly Mediterranean fruit-fly treatments on citrus, unlock access and reduce rejection risk. Competitive freight rates from Egypt’s Mediterranean ports shorten transit to the U.S. East Coast during high-price periods.
Restraints Impact Analysis*
| Restraint | (~) % Impact on CAGR Forecast | Geographic Relevance | Impact Timeline |
|---|---|---|---|
| Water-scarcity–driven production caps | -1.8% | National, acute in Upper Egypt, reclaimed areas | Long term (≥ 4 years) |
| Volatile foreign-exchange environment | -1.2% | National, export-dependent regions most affected | Medium term (2-4 years) |
| Persistent post-harvest loss rates above 30% | -1.5% | National, concentrated in rural areas | Medium term (2-4 years) |
| United States SPS (Sanitary and Phytosanitary) rejections | -0.7% | Export regions, citrus and vegetable producers | Short term (≤ 2 years) |
| Source: Mordor Intelligence | |||
Water-scarcity–driven production caps
Agriculture draws 80–85% of Egypt’s freshwater, yet national demand already overshoots supply by 54 billion m³ annually. Soil salinization affects 64% of northeastern Delta plots, shrinking yield potential. The Grand Ethiopian Renaissance Dam injects further flow-rate uncertainty, especially for rice. Government responses include the National Water Resources Plan, targeting quadrupled desalination capacity, though economic and environmental concerns regarding energy consumption and brine-disposal hurdles cloud scalability.[2]“Engaging Egypt's Landscape Architects to Combat Climate Change,” Carnegie Endowment for International Peace, carnegieendowment.org
Volatile foreign-exchange environment
The pound’s free-float policy widened import financing options for grain, pushing purchases in 2024-25, yet it lifted costs for fertilizer and machinery. Real exchange-rate swings make export earnings unpredictable, undercutting reinvestment planning for growers. International financial support through International Monetary Fund (IMF) programs and bilateral agreements provides temporary stability, though long-term agricultural competitiveness requires sustained currency management and structural economic reforms to reduce dependency on volatile exchange rate movements.
*Our forecasts treat driver/restraint impacts as directional, not additive. The impact forecasts reflect baseline growth, mix effects, and variable interactions.
Segment Analysis
By Crop Type: Premium Segments Drive Export Growth
Vegetables contributed 51.60% of 2025 turnover in the Egypt fruits and vegetables market, lifted by sturdy domestic demand and steady Gulf shipments. Citrus remained the export engine, with 2.2 million tons shipped in the first nine months of 2024. Fruits posted the swiftest 6.7% CAGR, propelled by European buyers seeking sustainably sourced cumin and coriander. Processing potatoes positioned Egypt as the main European factory source from February through May, underscoring the reliability of counter-seasonal supply. Robust cold-chain networks and SPS compliance reforms underpin fruit gains, whereas vegetable producers benefit from precision irrigation upgrades in reclaimed desert plots. Fruits enjoy favorable unit economics due to higher value density, making airfreight viable for niche European orders. Collectively, diversified crop portfolios cushion revenue volatility and elevate foreign-exchange inflows.



Geography Analysis
The Nile Delta contributes more than 70.00% of Egypt's fruits and vegetables market size through nutrient-rich alluvial soils and mature irrigation canals, although salinity encroachment now affects two-thirds of northeastern plots. Desert-reclamation corridors in Upper Egypt and the western Delta form the next growth frontier, anchored by the Future of Egypt project targeting 1.5 million feddans and USD 5 billion in wells, roads, and silos. These reclaimed areas host modern pivot irrigation and mechanized harvesting fleets, positioning them for export-grade production.
Middle Eastern and African partners absorb 54.00% of Egyptian produce exports thanks to proximity and favorable bilateral tariffs. European Union destinations account for 1.168 billion USD in processed food receipts, with Italy spearheading mechanization grants. Counter-seasonal citrus shipments to Brazil and the United States showcase the competitive freight advantage arising from Mediterranean port access. North American channels for strawberries and table grapes deepen as Egyptian suppliers prove consistent SPS compliance. Asian demand accelerates through UAE-backed farming concessions spanning 260,000 hectares, illustrating Gulf investors’ pivot toward upstream food security assets in Egypt.
Regional diversification minimizes single-market exposure and spreads logistics risk. Cold-chain capacity expansion in Alexandria and Damietta enhances reach to high-margin European supermarkets, while new reefer corridors to Mombasa open East African consumer bases.
Regulatory Landscape
Egypt's fruits and vegetables trade and handling operate under a dual-layer control system. The National Food Safety Authority (NFSA) regulates the import of edible food products and enforces food safety requirements, which increasingly include documented management systems. The Central Administration of Plant Quarantine (CAPQ) manages phytosanitary inspection for imported agricultural consignments at ports and entry points. Standards and conformity requirements reference the Egyptian Organization for Standardization and Quality (EOS), so compliance works as a combined food-safety and plant-health exercise across fresh and processed produce flows.
Tariffs and market access are shaped by Egypt's WTO bindings and preferential frameworks such as GAFTA, COMESA, and agreements with the European Union, which can change landed costs versus non-preferential origins. In January 2026, NFSA Decision No. 1/2025 regulated the handling, import, and export of genetically modified foods (or their components) and requires a specific NFSA trade license for these products, with a time-bound transition window that affects importers and processors managing ingredient and labeling risk.
Value Chain Analysis
The Egypt fruits and vegetables value chain begins with input supply (seeds, crop protection, fertilizers, and irrigation equipment) feeding a production base dominated by fragmented smallholders. Farms of 1 to 3 feddans account for around 90% of horticulture output. Production oversight and statistics are tracked through the Ministry of Agriculture and Land Reclamation (MALR), which monitors activity across rural centers, while access to finance is supported by institutions such as the Agricultural Bank of Egypt (ABE). Extension capacity remains constrained by staffing and mobility limits, which slows adoption of modern agronomy and compliance practices required for higher-grade channels.
Aggregation and primary handling typically run through collectors, cooperatives, and wholesale markets before produce moves into packhouses, cold stores, and processors for export-ready grading, packing, and value addition. Trade facilitation and export promotion involve bodies such as the Agriculture Export Council (AEC), and private exporters and herb and produce specialists (for example, Royal Herbs) participate across sourcing and export logistics. Key bottlenecks include inadequate cold-chain coverage, inefficient logistics planning, and post-harvest loss, so investments in temperature control, packhouse capability, and more structured contract-farming linkages are central to improving throughput and export compliance.
Market Opportunities and Future Outlook
Large public programs and financing mechanisms are opening investable gaps across irrigation, post-harvest, and export-compliance infrastructure. In the 2025/2026 development plan, Egypt allocated EGP 17.5 billion in public investments toward agriculture and irrigation activities, alongside targets that include reclaiming 750,000 new feddans and expanding contractual agriculture to 1.8 million feddans. This is translating into demand for modern irrigation systems, protected cultivation, input optimization, and packhouse and cold-storage assets in reclaimed and export-oriented corridors.
Export enablement and market-access initiatives also support opportunities in higher-value categories and in processing. NFSA Decision No. 270 of 2024 streamlined a rapid release system for food imports used as production inputs, easing supply friction for processors relying on imported ingredients and technical materials. At the same time, Egypt is scaling its Area-Wide Pest Management (AWPM) program to strengthen phytosanitary performance for citrus, mango, and grapes. On the capital side, March 2026 approval by the Financial Regulatory Authority (FRA) for the Al Ahly Green Agricultural Investment Fund introduced a dedicated private equity route for agri-innovation and supply-chain investment, complementing government export ambitions, including the stated goal to exceed USD 5 billion in agricultural crop exports in FY 2025/2026.
Recent Industry Developments
- July 2026: Prime Minister Mostafa Madbouly inspected Belcos Sadat City operations, which include about 4,000 feddans, three packaging stations, and more than 20,000 tons of annual fruit and vegetable exports. The visit highlighted how export-grade packing capacity and large-scale integrated farms support consistent volumes and help meet destination specifications.
- March 2026: The Financial Regulatory Authority (FRA) approved the formation of the Al Ahly Green Agricultural Investment Fund as Egypt's first private equity fund dedicated to agriculture. The structure provides an institutional channel for funding cold-chain, post-harvest, and agri-tech upgrades that affect quality retention and export readiness for fruits and vegetables.
- November 2024: Egypt's climate-change strategy set a 42% renewable-power share by 2030, reinforcing water-energy-food nexus planning. For horticulture, this policy direction supports investment logic around energy-intensive desalination, irrigation modernization, and cold-chain assets that depend on more stable and cleaner power supply.


Research Methodology Framework and Report Scope
Market Definition and Coverage
This market covers the value of fruits and vegetables in Egypt that are produced, traded, and consumed as fresh produce within the country in a given year. It connects supply, production and trade flows, to domestic demand, and it reflects how pricing shifts through the season.
Scope exclusions: Excludes fruits and vegetables that are primarily purchased as inputs by industrial processing (for example, juice, canned, or other manufacturing use).
Segmentation Overview
- By Crop Type
- Fruits
- Citrus
- Grapes
- Mango
- Pomegranate
- Vegetables
- Tomato
- Onion
- Potato
- Cucumber
- Fruits
Data Sources, Market Sizing, and Validation
Desk Research
For the desk phase, we start by mapping the crop and trade picture for Egypt, since that anchors what can realistically be supplied and exported in a season. Public sources such as FAOSTAT, UN Comtrade or ITC Trade Map, World Bank indicators, and official releases from Egypt's Ministry of Agriculture and Land Reclamation are used to understand planted area, yields, and trade direction.
After that, price and market behavior are cross-checked using items such as CAPMAS publications, customs and port disclosures where available, peer-reviewed agronomy and post harvest studies, and company disclosures like annual reports and investor presentations from produce exporters and distributors. In a few places, we also refer to paid subscriptions for company financials and intelligence, and shipment-level import export datasets to sanity check trade volumes and average values. These examples are not exhaustive, and many other public sources were also used for collection, validation, and clarification during the work.
Primary Interviews and Surveys
Primary work focused on growers, aggregators, exporters, wholesalers, and modern retail and foodservice buyers, since each group sees a different part of the volume flow and price formation. We use these conversations to confirm which crops drive value, how much goes to export versus local channels, and what seasonal price spreads typically look like across the year.
Distribution of primary research fieldwork respondents
| Company type | Respondent position |
|---|---|
| Top tier: 38% | CXOs: 15% |
| Mid tier: 44% | Functional/Unit leaders: 32% |
| Smaller Players: 18% | Managers: 53% |
Market-Sizing & Forecasting
Sizing was built using top-down market reconstruction, where production volumes and trade statistics are used to build the available supply pool, which is then translated into value using observable price bands. Once that structure was in place, the totals were checked using selective bottom-up approximations, such as sampled wholesale to retail price ladders and a limited roll-up of major exporter and distributor volumes where disclosures and interviews gave enough detail.
Inputs that matter in this market were treated explicitly, so the model responds to real farming and trading conditions. Illustrative inputs include harvested area and yield trends for key crops, post harvest loss rates, export shipments by commodity group, seasonal price swings linked to harvest windows, and currency movement effects on import costs and export realizations. Where bottom-up checks had gaps, proxy ratios from similar crop groups and channel shares from interviews were applied, and then stress tested against the supply side totals.
For forecasting, we used scenario analysis supported by simple regression checks that relate market value to variables like production growth, export intensity, and inflation driven food price movement. Assumptions were not kept static, and expected shifts in crop mix and export focus were updated based on repeated expert feedback before finalizing the forward curve.
Data Validation & Update Cycle
Outputs are validated by comparing implied per capita availability, export shares, and price implied revenues against independent signals from public statistics and what interviewees report as typical ranges. When a variance is found, the driver is isolated, volume, price, or trade timing, and recalculated before numbers move forward to internal review.
A second analyst review is applied to the core assumptions, followed by a final sense check on year-to-year movements to avoid artificial jumps that do not match crop seasonality. The report is refreshed annually, and interim updates are triggered when material events occur, such as major currency moves, trade rule changes, or abnormal harvest outcomes. Before delivery, a fresh pass is done so clients receive the latest updated view.
Mordor Intelligence's Egypt Fruits and Vegetables Market Size Compared With Other Published Estimates
Published market sizes for Egypt fruits and vegetables can look far apart because sources do not always count the same product forms, channels, and price points. Differences also come from whether the value is built from supply statistics, retail spending, or a mix of the two, and how exports are treated in the calculation.
In practice, the main gap drivers here tend to be fresh-only versus fresh plus frozen or dried inclusion, farm-gate pricing versus retail pricing, and whether the study uses a single annual average price or season-weighted prices by crop. Some estimates also apply aggressive growth assumptions from short term demand narratives without fully reconciling them to yield and trade constraints, which can inflate the forward values.
Benchmark comparison
| Source | Market Size | Gaps in Research Methodology |
|---|---|---|
| Mordor Intelligence | USD 12.30 B (2025) | |
| Global Consultancy A | USD 11.70 B (2024) | Uses a different base year and appears to mix channel pricing assumptions, where retail distribution language is present but farm output drivers are also used, which can shift the value level. |
| Industry Publisher B | USD 0.88 B (2025) | Covers fresh, frozen, and dried product forms, but the reported total is much smaller, which suggests a narrower value definition, often closer to a packaged retail subset rather than the full fresh produce value pool. |
The table shows a wide spread that mainly traces back to what part of the value chain is being counted and whether the scope reflects the full fresh produce flow or only selected retail forms. In Mordor Intelligence's model, the number is tied to fresh produce supply, net trade, and season-weighted pricing, which avoids counting processed demand and reduces scope drift. Once these boundaries are held consistently, the market value becomes easier to replicate year to year and to connect with real production and trade signals.


Key Questions Answered in the Report
How large is Egypt’s fruits and vegetables market in 2026?
It is valued at USD 13.01 billion and projected to reach USD 17.18 billion by 2031.
Which crop category holds the biggest share of output?
Vegetables lead with 51.60% of 2025 revenue.
Which crop type is expanding most rapidly?
Fruits surge 6.7% CAGR amid rising health awareness and recognized nutritional benefits.
What is the CAGR rate of growth for Egypt's fruits and vegetables market?
Egypt's fruits and vegetables market is projected to grow at a 5.73% CAGR during the forecast period.
Page last updated on:





