Edge Analytics Market Size and Share
Market Overview
| Study Period | 2020 - 2031 |
|---|---|
| Market Size (2026) | USD 21.47 Billion |
| Market Size (2031) | USD 63.18 Billion |
| Growth Rate (2026 - 2031) | 24.11% CAGR |
| Fastest Growing Market | Asia Pacific |
| Largest Market | North America |
| Market Concentration | Medium |
Major Players*Disclaimer: Major Players sorted in no particular order Image © Mordor Intelligence. Reuse requires attribution under CC BY 4.0. | |
Edge Analytics Market Analysis by Mordor Intelligence
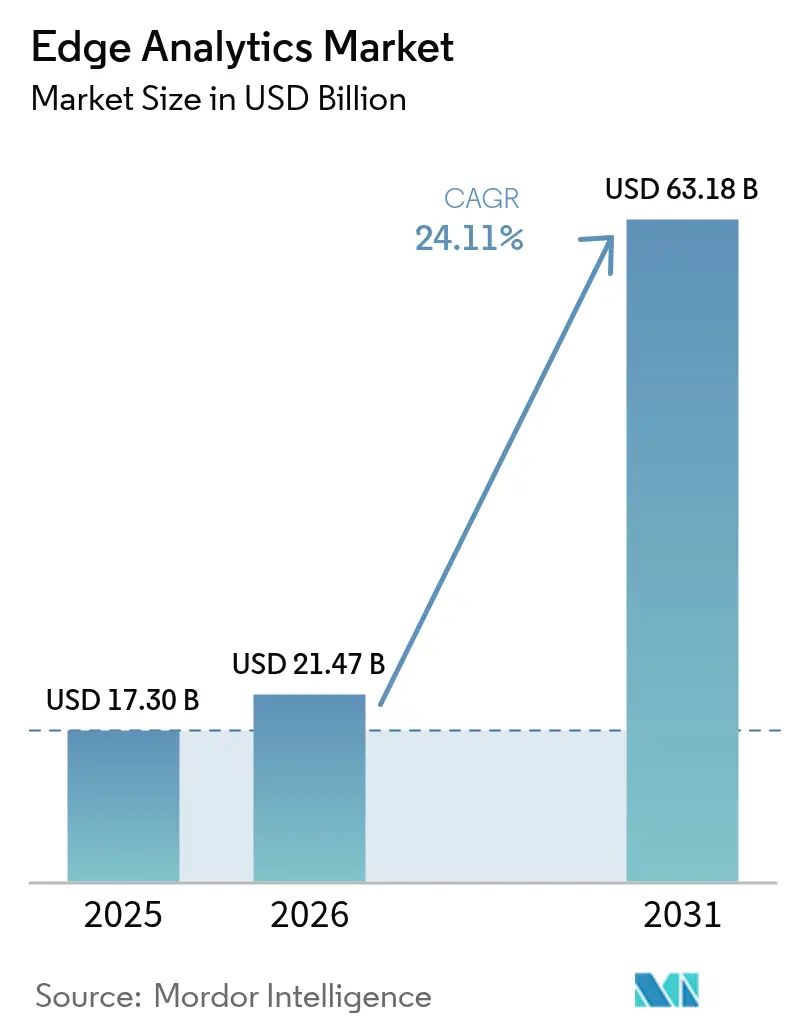
The edge analytics market size is expected to grow from USD 17.30 billion in 2025 to USD 21.47 billion in 2026 and is forecast to reach USD 63.18 billion by 2031 at 24.11% CAGR over 2026-2031. Growth is propelled by the rapid expansion of IoT end-points, wider 5G coverage that supports low-latency data paths, and ongoing advances in AI-enabled silicon that places inference engines at the network edge. Vendors are prioritizing ruggedized micro-data centers, liquid-cooling designs, and federated learning frameworks that keep sensitive data local while still training global models. Enterprises are also integrating cloud-native orchestration tools to standardize application delivery across thousands of edge nodes, thereby compressing deployment cycles and raising ROI expectations. The edge analytics market is further influenced by regulatory drives toward data-sovereign architectures, especially in healthcare and finance where real-time decision support must coexist with strict privacy mandates.
Key Report Takeaways
- By deployment, on-premises solutions held 55.23% of the edge analytics market size in 2025, whereas cloud-based deployments are advancing at a 26.79% CAGR.
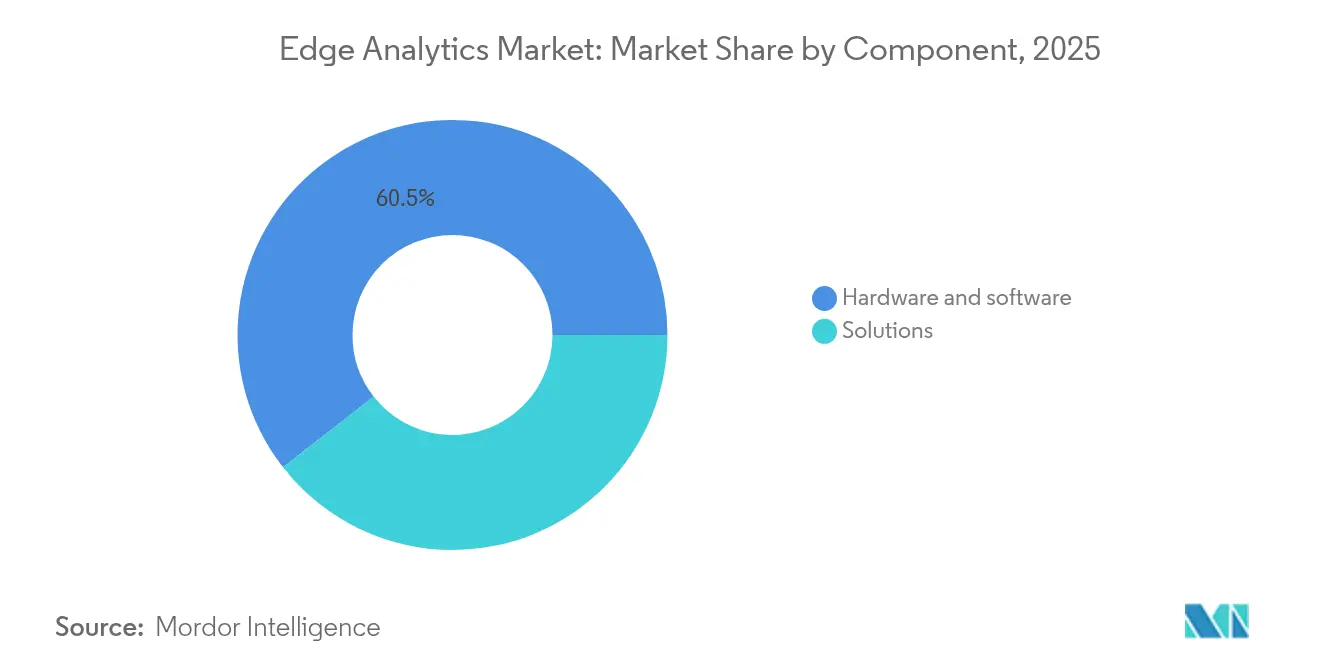
- By component, solutions commanded a 60.55% share of the edge analytics market size in 2025; services exhibit the highest projected CAGR at 28.58% to 2031.
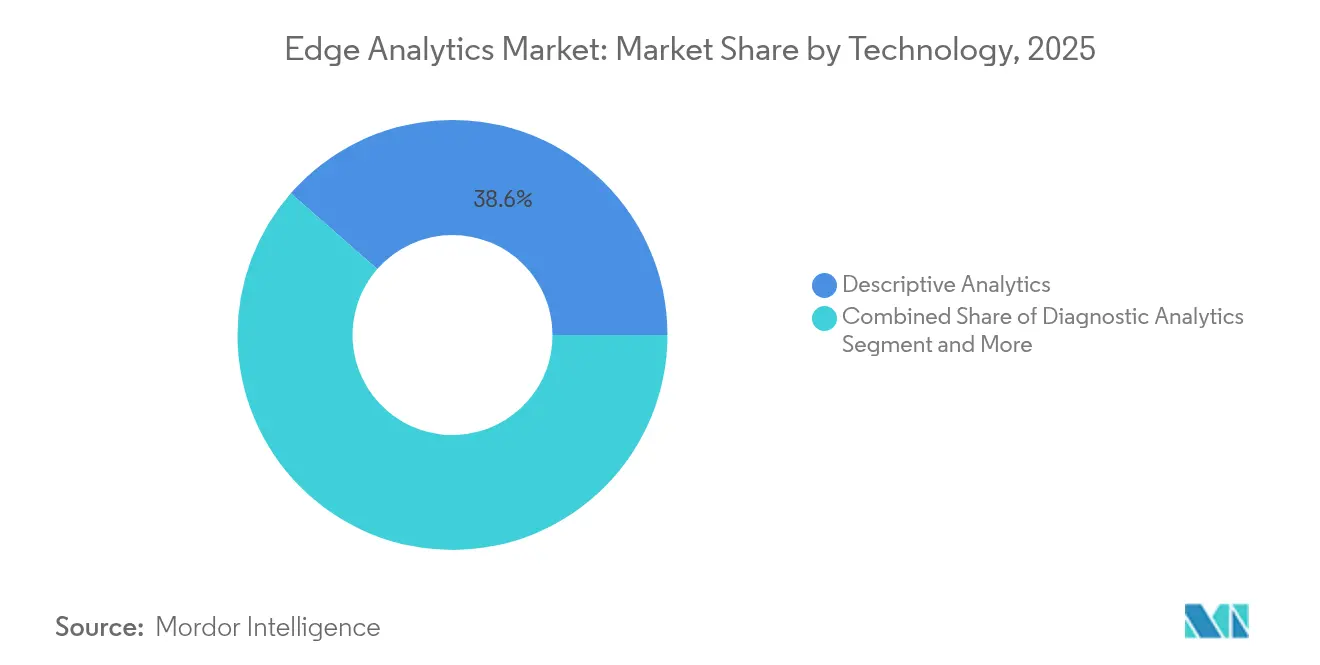
- By technology, descriptive analytics captured 38.55% revenue share in 2025; prescriptive analytics is forecast to expand at a 24.63% CAGR to 2031.
- By end-user industry, manufacturing led with 27.85% revenue share in 2025; healthcare is growing fastest at a 30.74% CAGR through 2031.
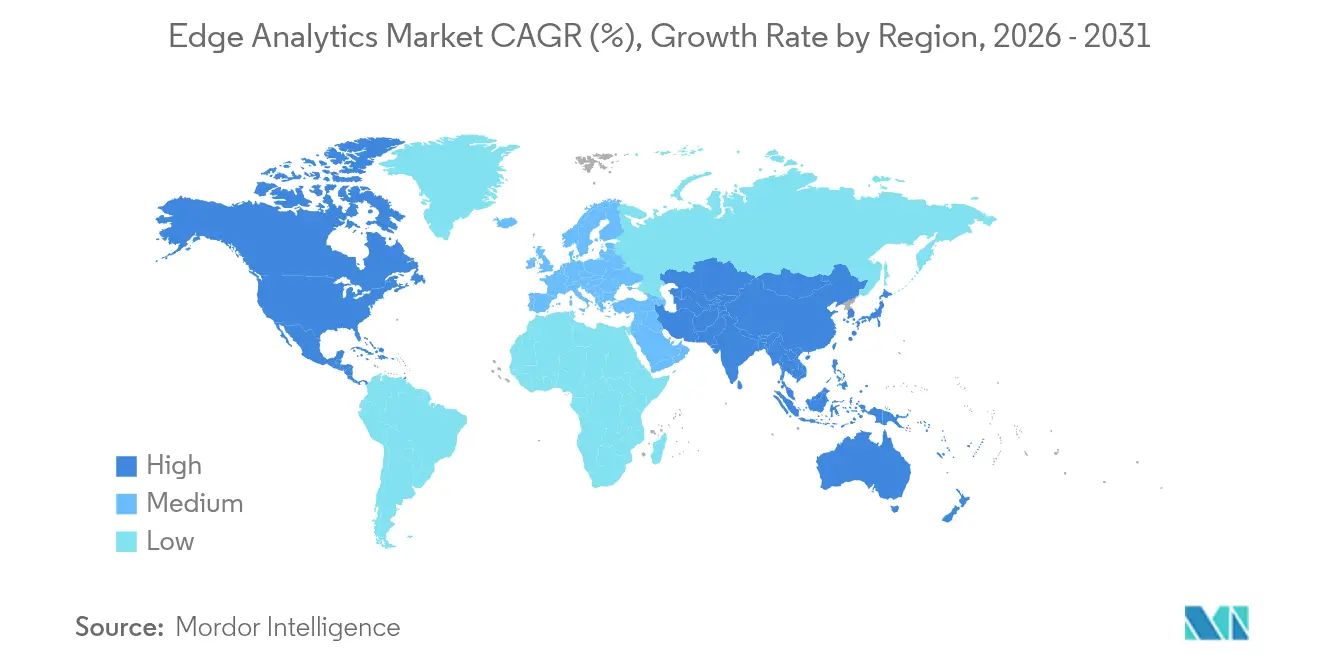
- By geography, North America led with 42.55% of edge analytics market share in 2025, while Asia Pacific is set to post the fastest 26.07% CAGR through 2031.
Note: Market size and forecast figures in this report are generated using Mordor Intelligence’s proprietary estimation framework, updated with the latest available data and insights as of 2026.
Global Edge Analytics Market Trends and Insights
Drivers Impact Analysis*
| Driver | (~) % Impact on CAGR Forecast | Geographic Relevance | Impact Timeline |
|---|---|---|---|
| Proliferation of IoT end-points | +4.8% | Global, higher in North America, and the Asia-Pacific | Medium term (2-4 years) |
| Demand for ultra-low-latency analytics | +4.0% | Global, manufacturing, and healthcare | Short term (≤ 2 years) |
| Rapid 5G roll-out, unlocking edge use-cases | +3.5% | North America, Europe, developed Asia-Pacific | Medium term (2-4 years) |
| Cloud-native toolchains are simplifying edge deployments | +2.7% | Global, early North America | Short term (≤ 2 years) |
| On-device federated learning enhancing data privacy | +3.0% | Europe, North America, and regulated markets | Medium term (2-4 years) |
| Liquid-cooling micro-data-centres enabling thermal-dense AI | +4.5% | North America, Europe, and advanced Asia-Pacific | Long term (≥ 4 years) |
| Source: Mordor Intelligence | |||
Proliferation of IoT end-points
The global device base is generating 328.77 million TB of data every day, forcing analytics to migrate toward local processing so that bandwidth is conserved and insights arrive in real time. Industrial plants now stream vibration and temperature metrics from millions of sensors, and edge accelerators running optimized models handle this influx with sub-10 ms latency. As predictive maintenance checks extend from heavy machinery to medical wearables, the edge analytics market gains a larger operational footprint and becomes an indispensable layer in enterprise data strategy.
Demand for ultra-low-latency analytics
Autonomous robots, tele-surgery rigs, and collision-avoidance systems need decisions within 5 ms, a target unattainable when packets traverse distant clouds. Edge analytics eliminates the 50-150 ms round-trip and lowers the risk of mission-critical failures. Manufacturers that moved defect-detection algorithms from regional data centers to on-site nodes report double-digit yield improvements, reinforcing the business case for distributed intelligence.
Rapid 5G roll-out unlocking edge use-cases
Network slicing delivers guaranteed throughput for AR maintenance or live video security feeds. As tier-1 carriers push 5G to dense urban zones, enterprises deploy cameras and sensors that stream high-resolution data to adjacent edge servers. Smart-city pilots in Europe are demonstrating traffic-signal timing optimizations that cut congestion by 30%, a showcase of how synchronized 5G and edge platforms multiply value[1]AIOTI, “AI, IoT and Edge Continuum impact and relation on 5G/6G,” aioti.eu.
Cloud-native toolchains simplifying edge deployments
Kubernetes extensions now provision and heal containers across micro-data centres, letting developers apply the same CI/CD pipelines used in public clouds. This standardization shrinks time-to-pilot from months to weeks, encouraging mid-market firms to experiment with localized AI. Early adopters cite faster feature roll-outs and easier over-the-air updates for vision models that grade assembly-line output.
Restraint Impact Analysis*
| Restraint | (~) % Impact on CAGR Forecast | Geographic Relevance | Impact Timeline |
|---|---|---|---|
| Persistent data-security & sovereignty risks | −4.7% | Global, highest in Europe, and regulated verticals | Short term (≤ 2 years) |
| Integration complexity with brownfield OT systems | −3.8% | Manufacturing, energy, utilities | Medium term (2-4 years) |
| Scarcity of tiny-ML / edge-AI engineering talent | −3.2% | Global, acute in emerging markets | Medium term (2-4 years) |
| ESG-driven power-cap caps on distributed compute nodes | −2.5% | Europe, North America, green-policy regions | Long term (≥ 4 years) |
| Source: Mordor Intelligence | |||
Persistent data-security & sovereignty risks
Each edge gateway introduces an attack surface that adversaries can exploit through physical access or unpatched firmware. Finance and healthcare operators must also align with location-based data residency mandates, prompting adoption of trusted execution environments and zero-trust overlays that encrypt traffic end-to-end.
Integration complexity with brownfield OT systems
Factories built on legacy PLCs lack modern APIs, so middleware bridges consume project budgets and extend deployment timelines. Custom protocol translators help, yet the limited pool of engineers versed in both Modbus registers and Kubernetes manifests slows rollout velocity.
*Our forecasts treat driver/restraint impacts as directional, not additive. The impact forecasts reflect baseline growth, mix effects, and variable interactions.
Segment Analysis
By Technology: Prescriptive Analytics Driving Strategic Value
Prescriptive engines are the fastest-advancing layer in the edge analytics market, growing at a 24.63% CAGR. They add decision automation to basic descriptive visibility, recommending the next best action once anomalies are detected. In 2025, descriptive modules still held 38.55% of revenue, but user demand has clearly pivoted toward higher-order insights that lift output and minimize risk. Edge devices now host compact reinforcement-learning agents that optimize robotics pathing on the fly, illustrating the commercial pull behind the transition.
Predictive algorithms remain a bridge between current dashboards and full automation. They enable forecast maintenance windows and inventory needs by correlating temperature spikes or traffic surges. Diagnostic analytics, though smaller, supplies root-cause clarity that prevents recurrence. Together these stacks help vendors package tiered offerings, embedding descriptive dashboards as entry points and layering prescriptive add-ons for premium subscribers. In turn, the edge analytics industry continues to mature toward outcome-based contracting.


By Deployment Type: Hybrid Architectures Gaining Momentum
On-premises nodes accounted for 55.23% of the edge analytics market size in 2025. They remain the first choice for data-sensitive sectors that cannot export personally identifiable or national-security information. Hospital networks, for instance, maintain imaging servers in-house so radiologists access scans without traversing external links. However, cloud-managed edges are scaling quicker, charting a 26.79% CAGR to 2031 as providers launch regional zones that meet residency rules.
Hybrid topology is emerging as the long-term norm. Sensitive workloads infer locally while batch trend analytics run in centralized clouds overnight. Central consoles push container updates, harmonize policy, and collect aggregated insights for executive dashboards, thereby delivering control without sacrificing agility. The arrangement reduces infrastructure duplication and keeps compute near data origin, aligning with both budget and compliance targets.
By Component: Services Growth Outpacing Solutions
Hardware and software solutions formed 60.55% of 2025 revenue, underpinned by AI-capable gateways, fan-less edge servers, and lightweight inference runtimes. Vendors differentiate through ruggedization levels, GPU density, and compatibility with open-source orchestration. Nonetheless, services revenue is rising faster at 28.58% CAGR because enterprises struggle with blueprinting, roll-out, and life-cycle governance.
Consultancies design reference architectures that integrate MES, SCADA, and public cloud APIs within 90-day sprints. Managed-service providers then operate the edge fleet, perform model drift checks, and execute patching windows across thousands of locations. This recurring service layer deepens customer lock-in and shifts value capture from one-time hardware margins to multi-year contracts, a trend reshaping vendor portfolios across the edge analytics market.
By End User Industry: Healthcare Innovations Accelerating Adoption
Manufacturers commanded 27.85% of edge analytics market share in 2025 by embedding real-time SPC charts and predictive maintenance loops on assembly lines. Output quality improved and unplanned downtime fell, generating quick paybacks that spurred further rollouts. Firms now attach power-optimized cameras that run vision models locally, classifying defects on conveyor belts without shipping frames to remote clouds.
Healthcare is the breakout growth story with a projected 30.74% CAGR through 2031. Bedside monitors pipe vitals to edge nodes that flag deterioration signs seconds before conventional alerts, enabling timely intervention. Edge-resident image classifiers review CT scans, highlighting possible anomalies so radiologists focus on high-risk sections first. Beyond the clinic, telehealth wearables sync via 5G to neighbourhood micro-clusters, upholding privacy while allowing continuous chronic-care analytics. These use cases demonstrate how clinical outcomes and operational efficiencies converge to accelerate investment.
Geography Analysis
North America retained leadership with 42.55% revenue in 2025 thanks to a mature hyperscale data-center footprint and early 5G monetization strategies. Telcos widened coverage to secondary metros, letting retailers place micro-data centers closer to suburban stores. Government incentives encouraged manufacturers to adopt smart-factory programs, embedding AI-driven process control at the line edge. Privacy rulings remain receptive to innovation provided encryption and audit trails meet industry norms. Policy clarity shortens procurement cycles and underpins steady demand across healthcare, retail, and energy domains.
Asia Pacific is the fastest-growing territory, forecast to log a 26.07% CAGR during 2026-2031. China scales provincial edge facilities that ingest sensor feeds from smart traffic lights and industrial robotics. Japan’s automotive majors deploy predictive quality loops that slice rework costs, while India's mobile operators leverage new spectrum to launch private 5G campuses for logistics parks. Diverse regulatory positions on cross-border data flows push multinationals toward localized deployments, often using open-source stacks to avoid vendor lock-in. Investments in domestic semiconductor fabs further support a self-sustaining regional supply chain and embed resilience into edge projects.
Europe shows robust but measured uptake, guided by GDPR and proposed AI liability laws. Germany pioneers Industrie 4.0 projects that retrofit heritage plants with OPC UA gateways and containerized inference, balancing innovation with risk governance. France leads smart-transport pilots where real-time video analytics on roadside units improve public-safety response times. Nordic operators prioritize green hydrogen-powered edge sites to respect ESG mandates. Standard-setting bodies collaborate on secure boot, remote attestation, and data-exchange frameworks, fostering an interoperability ethos that benefits the wider edge analytics market.

Competitive Landscape
Global competition remains fragmented, with no supplier topping a 10% revenue slice in 2024. Mega-vendors such as Cisco, IBM, and Microsoft combine networking stacks, AI tools, and cloud extensions, appealing to enterprises that prefer single-throat accountability. Hyperscalers extend serverless functions and ML pipelines to colocation cages near population centers, lowering barriers for developers already fluent in cloud APIs. Meanwhile, industrial heavyweights like Siemens and GE Digital tailor verticalized offerings that integrate with SCADA and historian databases, providing deep domain value.
Start-ups concentrate on niche gaps such as tiny-ML model optimization or remote fleet orchestration at scale. Their agility spurs partnerships with incumbents seeking to complement portfolios without lengthy R&D cycles. Cross-industry consortiums emerge so devices authenticate once and receive signed workloads regardless of hardware brand, simplifying multi-vendor estates. The rise of open telemetry standards also reduces switching costs, encouraging healthy competition on service quality rather than proprietary lock-in.
Strategic alliances define differentiation more than feature checklists. IBM’s edge ecosystem rallies over thirty hardware and software partners who pre-integrate networking, security, and analytics components to shrink proof-of-concept timelines. Cloud providers team with telcos to embed container environments in base-band units, giving customers a one-click edge deployment option. Hardware makers embed cryptographic roots-of-trust so cloud consoles verify device integrity before offloading workloads. This orchestration-driven model accelerates adoption, deepens vendor stickiness, and steers the battlefield toward outcome-centric value propositions.
Edge Analytics Industry Leaders
Cisco Systems Inc.
Oracle Corporation
SAS Institute Inc.
IBM Corporation
Apigee Corporation
- *Disclaimer: Major Players sorted in no particular order

Recent Industry Developments
- May 2025: IOTech Systems rolled out Edge Central 4.0, an open platform engineered for AI-rich industrial deployments.
- April 2025: Consumer Edge completed its acquisition of Earnest Analytics to expand transaction and healthcare data coverage.
- March 2025: Consumer Edge introduced Click, combining web-traffic and transaction streams for granular spend analysis.
- January 2025: Prescient Edge Corp. acquired Edge Analytic Solutions to strengthen its defense intelligence analytics offering.


Global Edge Analytics Market Report Scope
Edge analytics is a way to data collection and interpretation in which a programmed analytical computation is performed on data at a sensor, network switch or another device instead of waiting for the data to be sent back to a centralized data store.
The edge analytics market is segmented by deployment (on-premise, cloud), by component (solutions, services ( professional and managed services )), by end-user industry (BFSI manufacturing, it & telecommunication, healthcare, retail), by geography (North America(united states, Canada), Europe (United Kingdom, Germany, France, rest of Europe), Asia Pacific (Japan, China, India, rest of Asia Pacific), Latin America, middle east and Africa). The market sizes and forecasts are provided in terms of value in USD for all the above segments.
| On-Premises |
| Cloud |
| Solutions |
| Services |
| BFSI |
| IT & Telecommunication |
| Manufacturing |
| Healthcare |
| Retail |
| Others |
| Descriptive Analytics |
| Diagnostic Analytics |
| Predictive Analytics |
| Prescriptive Analytics |
| North America | United States | |
| Canada | ||
| Mexico | ||
| South America | Brazil | |
| Argentina | ||
| Rest of South America | ||
| Europe | United Kingdom | |
| Germany | ||
| France | ||
| Italy | ||
| Spain | ||
| Nordics | ||
| Rest of Europe | ||
| Middle East and Africa | Middle East | Saudi Arabia |
| United Arab Emirates | ||
| Turkey | ||
| Rest of Middle East | ||
| Africa | South Africa | |
| Egypt | ||
| Nigeria | ||
| Rest of Africa | ||
| Asia-Pacific | China | |
| India | ||
| Japan | ||
| South Korea | ||
| ASEAN | ||
| Australia | ||
| New Zealand | ||
| Rest of Asia-Pacific | ||
| By Deployment Type | On-Premises | ||
| Cloud | |||
| By Component | Solutions | ||
| Services | |||
| By End-User Industry | BFSI | ||
| IT & Telecommunication | |||
| Manufacturing | |||
| Healthcare | |||
| Retail | |||
| Others | |||
| By Technology | Descriptive Analytics | ||
| Diagnostic Analytics | |||
| Predictive Analytics | |||
| Prescriptive Analytics | |||
| By Geography | North America | United States | |
| Canada | |||
| Mexico | |||
| South America | Brazil | ||
| Argentina | |||
| Rest of South America | |||
| Europe | United Kingdom | ||
| Germany | |||
| France | |||
| Italy | |||
| Spain | |||
| Nordics | |||
| Rest of Europe | |||
| Middle East and Africa | Middle East | Saudi Arabia | |
| United Arab Emirates | |||
| Turkey | |||
| Rest of Middle East | |||
| Africa | South Africa | ||
| Egypt | |||
| Nigeria | |||
| Rest of Africa | |||
| Asia-Pacific | China | ||
| India | |||
| Japan | |||
| South Korea | |||
| ASEAN | |||
| Australia | |||
| New Zealand | |||
| Rest of Asia-Pacific | |||


Key Questions Answered in the Report
What is the current value of the edge analytics market?
The edge analytics market size is USD 21.47 billion in 2026 and is projected to reach USD 63.18 billion by 2031.
Which region leads edge analytics adoption today?
North America accounts for 42.55% of 2025 revenue due to early 5G roll-outs and strong investments in edge infrastructure.
Which end-user sector is expanding fastest?
Healthcare shows the highest momentum, advancing at a 30.74% CAGR as hospitals deploy real-time patient monitoring and imaging analytics.
Why are hybrid edge architectures gaining traction?
Hybrid deployments balance on-premises data control with cloud scalability, offering secure local inference while centralizing batch analytics for cost efficiency.
Page last updated on:


