East Africa Lubricants Market Size and Share
Market Overview
| Study Period | 2021 - 2031 |
|---|---|
| Forecast Data Period | 2026 - 2031 |
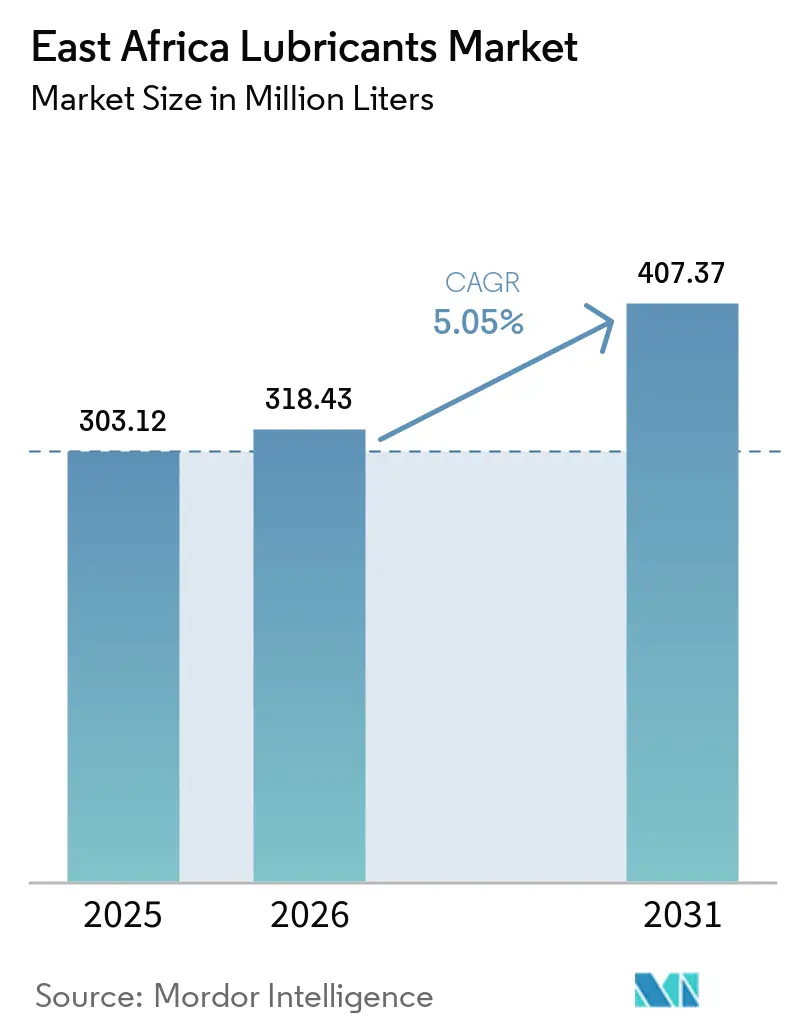
| Base Year Market Size (2025) | 303.12 Million liters |
| Market Volume (2026) | 318.43 Million liters |
| Market Volume (2031) | 407.37 Million liters |
| Growth Rate (2026 - 2031) | 5.05% CAGR |
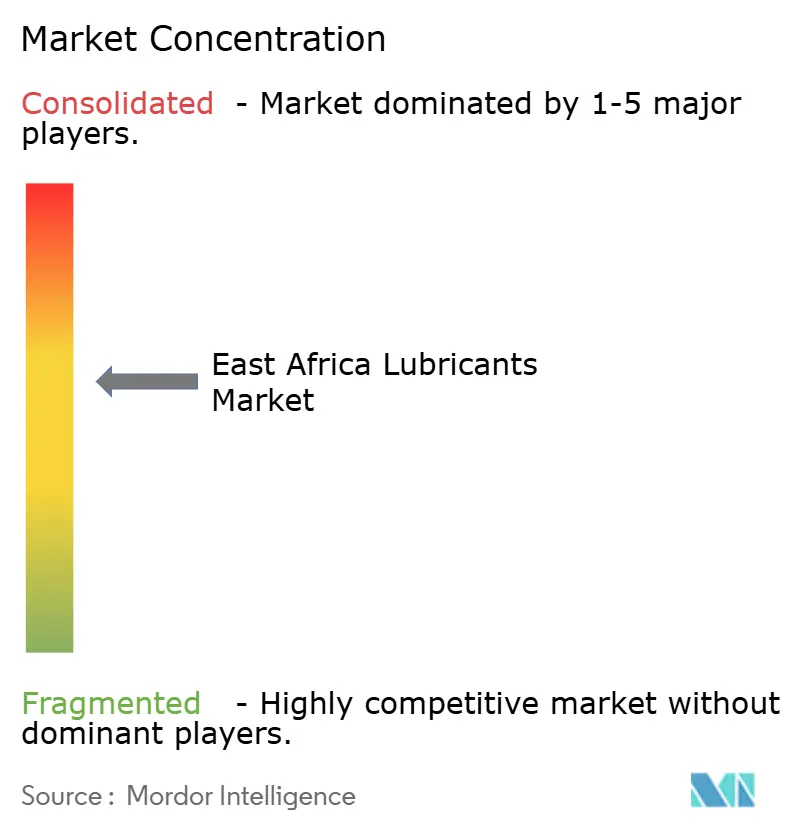
| Market Concentration | Medium |
Major Players *Disclaimer: Major Players sorted in no particular order Image © Mordor Intelligence. Reuse requires attribution under CC BY 4.0. | |
East Africa Lubricants Market Analysis by Mordor Intelligence
The East Africa Lubricants Market size is expected to grow from 303.12 Million liters in 2025 to 318.43 Million liters in 2026 and is forecast to reach 407.37 Million liters by 2031 at 5.05% CAGR over 2026-2031. The forecast highlights the rapid expansion of automotive fleets, the integration of cross-border trade driven by the AfCFTA, and industrial activities linked to new infrastructure projects. Challenges such as increasing counterfeit penetration, periodic foreign-exchange shortages in Ethiopia and Kenya, and the planned introduction of a USD 0.46 per-liter EAC-wide specific duty in July 2025 have pressured margins and accelerated the shift toward local blending capacity. Regional supply chains are increasingly centered around Oryx Energies’ 100,000-ton Dar es Salaam plant and TotalEnergies’ 15.2-kiloton Mombasa facility, which play key roles in bulk procurement and toll blending for smaller distributors. Logistics reforms under the AfCFTA, along with the MV Mpungu roll-on/roll-off service on Lake Victoria, are reducing Kenya-Uganda freight costs by approximately 30%, bolstering re-export corridors into Rwanda and the eastern Democratic Republic of Congo. Additionally, Ethiopia’s evolving electrification policy continues to drive industrial-oil demand, as hydro-turbines, agricultural diesels, and freight fleets remain reliant on lubricants despite the growing adoption of electric vehicles.
Key Report Takeaways
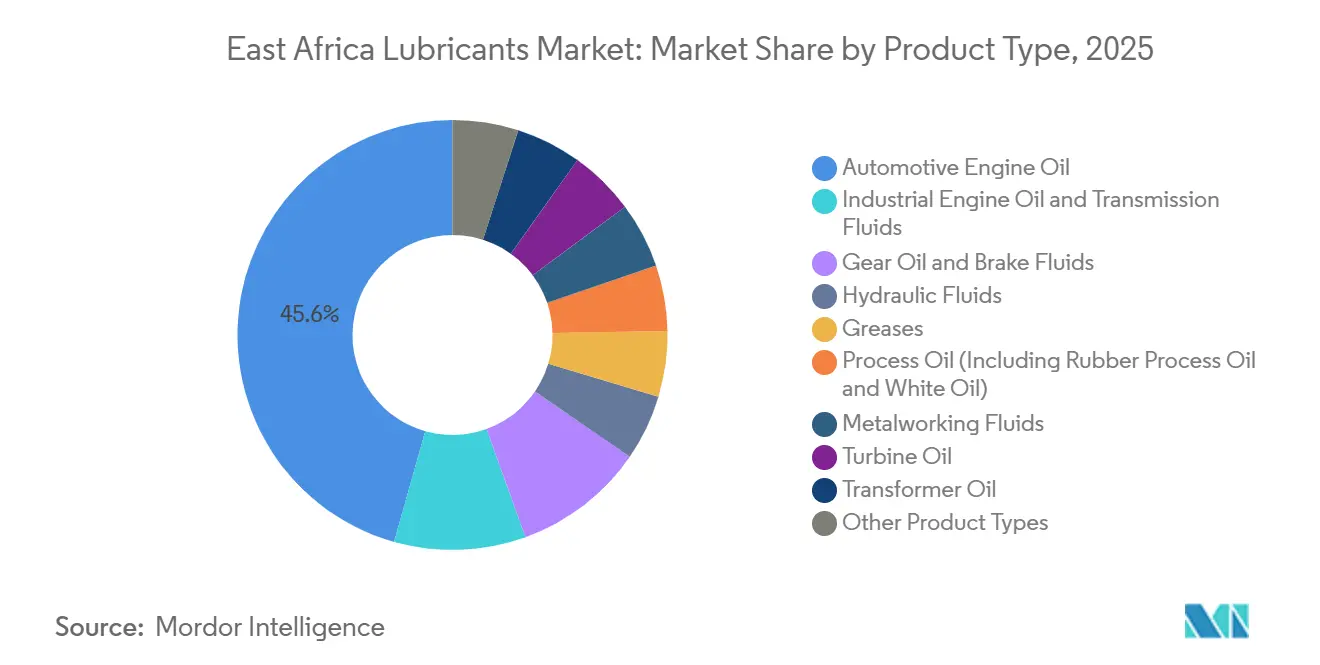
- By product type, automotive engine oil led with 45.62% of the East Africa lubricants market in 2025, while transmission fluids are forecast to expand at a 5.12% CAGR through 2031.
- By base stock type, mineral oil-based lubricants accounted for 58.89% of the East Africa lubricants market share in 2025, while bio-based lubricants are set to grow at a 5.43% CAGR through 2031.
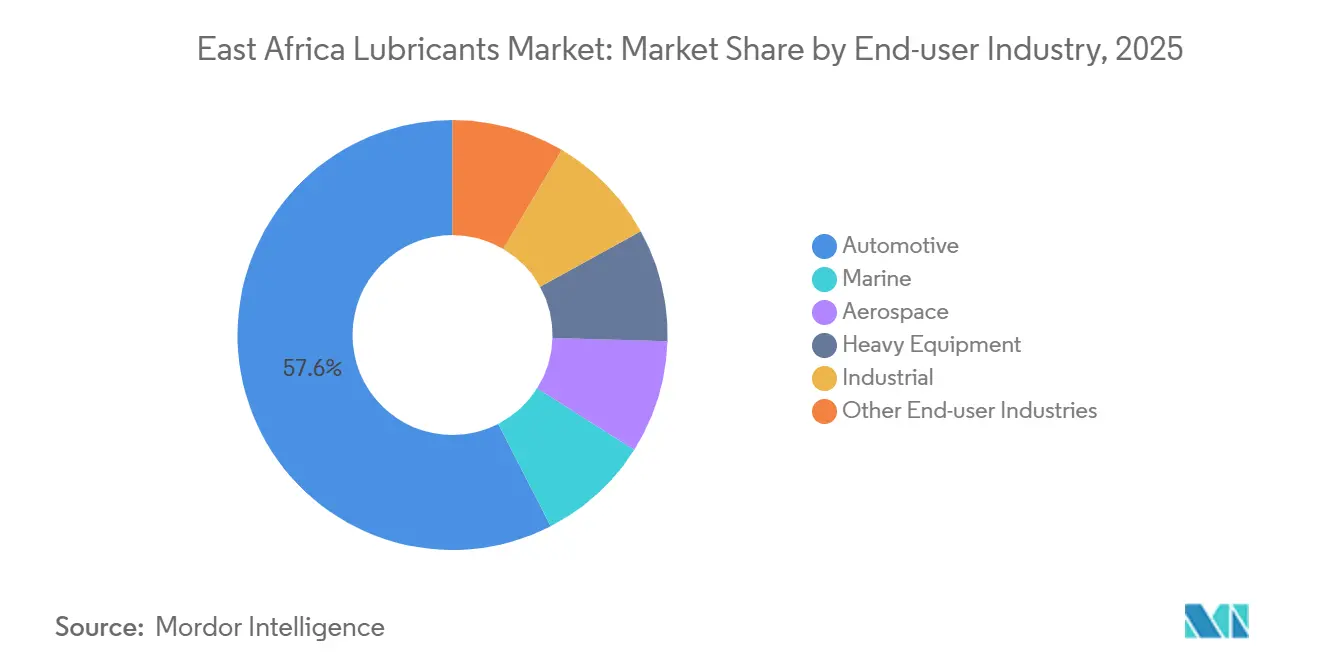
- By end-user industry, automotive captured 57.55% of the East Africa lubricants market share in 2025 and is set to grow at a 5.22% CAGR through 2031.
- By geography, Kenya held 41.66% of the East Africa lubricants market share in 2025; Tanzania is set to grow at a 5.28% CAGR through 2031.
Note: Market size and forecast figures in this report are generated using Mordor Intelligence’s proprietary estimation framework, updated with the latest available data and insights as of 2026.
East Africa Lubricants Market Trends and Insights
Drivers Impact Analysis*
| Driver | (~) % Impact on CAGR Forecast | Geographic Relevance | Impact Timeline |
|---|---|---|---|
| Rapid Growth of Used-Vehicle Fleet | +1.2% | Kenya, Tanzania, Uganda | Medium term (2-4 years) |
| OEM Push toward Higher-Grade Synthetics | +0.8% | Kenya, Ethiopia, Tanzania | Long term (≥ 4 years) |
| Cross-Border Trade Liberalization (AfCFTA) | +1.0% | Regional (EAC, AfCFTA zone) | Short term (≤ 2 years) |
| Electrification of Off-Grid Agriculture | +0.6% | Tanzania, Kenya, Ethiopia | Medium term (2-4 years) |
| Expansion of Regional Oil Storage Terminals | +0.7% | Tanzania (Dar es Salaam), Kenya (Mombasa) | Short term (≤ 2 years) |
| Source: Mordor Intelligence | |||
Rapid Growth of Used-Vehicle Fleet
In 2024, Tanzania imported 47,000 used vehicles, while Kenya added 39,000 units. These older vehicles, with engines consuming up to 20% more oil compared to newer models, significantly drive lubricant demand. Approximately 180,000 liters of additional annual lubricant demand is generated for every 10,000 imported vehicles. The average vehicle age of 8-12 years in Kenya and 10-14 years in Tanzania continues to favor mineral oil formulations[1]Tanzania Revenue Authority, “Motor Vehicle Import Statistics 2024,” tanzaniantra.go.tz.
In Ethiopia, the ban on internal combustion engine imports has not eliminated existing diesel assets in construction and freight, ensuring a stable demand for industrial engine oils. Furthermore, commercial fleet upgrades, such as Foton Tanzania’s plan to introduce 2,000 AMT heavy trucks annually by 2026, are expected to boost demand for transmission and gear fluids. The July 2025 KEBS-Kenya Pipeline agreement has streamlined testing, reducing port turnaround times to seven hours and enabling distributors to maintain leaner, just-in-time inventories.
OEM Push Toward Higher-Grade Synthetics
In November 2024, TotalEnergies Uganda relaunched its Rubia line to meet updated US 249 standards, achieving API CK-4 and ACEA E9 compliance and extending oil drain intervals by up to 50%. While higher-grade synthetics command a 40-60% premium over mineral oils, adoption remains limited among cost-sensitive boda-boda and taxi operators. However, predictive maintenance platforms like Vivo Energy’s VE-CEM demonstrate downtime savings that justify the higher upfront costs.
Regional accreditation of petroleum laboratories under ISO/IEC 17025 and ISO 9001-certified blending at Oryx Energies enhances traceability, addressing counterfeit penetration, which remains close to 20%.
Cross-Border Trade Liberalization under AfCFTA
In July 2025, the East African Community (EAC) shifted from ad-valorem tariffs to a harmonized USD 0.46 specific duty, equalizing landed costs but reducing distributor margins by approximately 10%. Despite this, price differences persist. For example, Kenyan motorists near the Tanzania border frequently cross to purchase fuel at a 47% discount, which also influences lubricant retail pricing.
Rwanda’s re-export of USD 29.72 million in lubricants during Q3 2025, with 95% destined for the Democratic Republic of Congo (DRC), highlights how landlocked states leverage AfCFTA certificates to optimize hub-and-spoke logistics. Infrastructure developments, such as the MV Mpungu service and the expansion of the Dar es Salaam terminal, are strengthening the Southern Corridor as a bulk-oil supply route for Malawi, Zambia, and the DRC.
Electrification of Off-Grid Agriculture
Kenya’s mechanization efforts and Ethiopia’s pay-as-you-go (PAYG) electric-tractor pilots are reducing diesel engine oil consumption by approximately 15 liters per tractor annually. However, these initiatives are increasing demand for synthetic gear and hydraulic oils required for electric drivetrains. Additionally, large-scale projects such as the Grand Ethiopian Renaissance Dam’s 5,150 MW turbines and Tanzania’s Kabanga Nickel mine are driving demand for high-performance industrial fluids, balancing the decline in road transport-related lubricant consumption.
Tender activities, such as TANESCO’s March 2025 request for turbine oils, highlight the growing opportunity for bio-based and synthetic formulations in industrial applications.
Restraints Impact Analysis*
| Restraint | (~) % Impact on CAGR Forecast | Geographic Relevance | Impact Timeline |
|---|---|---|---|
| Counterfeit and Sub-standard Products | -1.3% | Kenya, Tanzania, Uganda | Short term (≤ 2 years) |
| Foreign-Exchange Shortages | -0.9% | Ethiopia, Kenya | Medium term (2-4 years) |
| Sulfur Caps on Lake-Victoria Bunker Fuel | -0.2% | Lake Victoria basin (Kenya, Tanzania, Uganda) | Long term (≥ 4 years) |
| Source: Mordor Intelligence | |||
Counterfeit and Sub-standard Products
Kenya’s Anti-Counterfeit Authority seized counterfeit lubricant stock worth KSh 65 million over five years, yet substandard products still constitute nearly 20% of the market. These products reduce engine life by up to 30% and invalidate OEM warranty coverage. Pre-export verification charges, equivalent to 0.60% of the FOB value, increase costs for compliant importers. Additionally, the Duty Remission Scheme enables some entities to divert tax-free base oils into local markets. Many smaller East African blenders lack ISO certification, making traceability challenging. On the other hand, Oryx Energies’ fully certified plant in Dar es Salaam demonstrates industry best practices.
Foreign-Exchange Shortages
Ethiopia’s ongoing foreign exchange shortages prioritize gasoline and diesel imports, limiting the availability of specialty lubricants. Kenya’s 2023-24 government-to-government import model temporarily eased foreign exchange pressures but later faced contract disputes, leading to supply disruptions across the East African lubricants market[2]Energy and Petroleum Regulatory Authority, “FX-Linked Oil Import Scheme Brief 2024,” epra.go.ke. When Ethiopia removed subsidies in June 2025, pump prices increased by 20%, briefly redirecting foreign exchange toward industrial lubricants for hydroelectric projects, highlighting the impact of policy changes on market dynamics.
*Our forecasts treat driver/restraint impacts as directional, not additive. The impact forecasts reflect baseline growth, mix effects, and variable interactions.
Segment Analysis
By Product Type: Engine Oils Anchor, Transmission Fluids Accelerate
Automotive engine oil accounted for 45.62% of the East Africa lubricants market size in 2025, as the blended fleet of Kenya and Tanzania depends on routine drain intervals. Transmission fluids, however, are projected to grow at a 5.12% CAGR to 2031, driven by the adoption of automated-manual transmissions in Foton AMT heavy trucks and regional fleet modernization programs. The East Africa lubricants market also includes industrial engine, gear, and hydraulic oils, which support large infrastructure projects such as Kabanga Nickel and the Grand Ethiopian Renaissance Dam.
TotalEnergies’ 2024 Rubia relaunch highlights the shift to API CK-4 oils, which can extend drain intervals by 50% for turbocharged diesel engines. However, affordability remains a key concern for owner-drivers in the boda-boda segment. Process and turbine oils are utilized in geothermal projects in Kenya’s Rift Valley and hydropower plants in Tanzania. Vivo Energy’s VE-CEM platform provides real-time engine analytics, emphasizing the cost benefits of transitioning to higher-viscosity synthetic oils, reinforcing the synthetic shift.


By Base Stock Type: Mineral Dominates, Bio-Based Gains Traction
Mineral oil-based lubricants accounted for 58.89% of East Africa lubricants market volume in 2025. Semi-synthetics form a middle tier, though widespread counterfeiting undermines their credibility. Bio-based lubricants are expected to grow at a 5.43% CAGR through 2031, but they currently hold a small market share due to their 60-80% higher costs and the lack of local feedstock supply chains. Oryx Energies and TotalEnergies import 500SN, 150SN, and BSS base oils for ISO-certified blends, while smaller operators exploit the Duty Remission Scheme to avoid duties and dilute formulations. Bio-based blends are anticipated to grow as stricter environmental standards are implemented for Lake Victoria ferries, national parks, and organic farming.
By End-user Industry: Automotive Leads, Heavy Equipment Gains
The automotive industry accounted for 57.55% of 2025 demand and is projected to grow at a 5.22% CAGR through 2031. Passenger cars represent the majority of this volume, while commercial trucks, supported by Alistair Group’s 650-unit HOWO fleet and new AMT acquisitions, are also expanding. Two-wheelers contribute frequent but smaller top-offs, maintaining steady workshop activity.
Heavy equipment markets, including construction, mining, and agriculture, are growing alongside projects such as Kabanga Nickel and geothermal drilling. Industrial consumers, including hydropower, metals, and textiles, are driven by Julius Nyerere hydropower tenders for turbine oils. Marine demand is bolstered by increased logistics activity at Kisumu Port and the MV Mpungu service, positioning Lake Victoria as a key hub for bulk re-exports.
Geography Analysis
Kenya accounted for 41.66% of the 2025 market volume, supported by a 336-station Shell network and Mombasa’s Northern Corridor throughput. Tanzania is projected to grow at a 5.28% CAGR through 2031, driven by its 378,000-m³ Dar es Salaam terminal and rising heavy-vehicle registrations. Uganda is leveraging VE-owned 195 Shell sites and Rubis Energy’s station revamps to support Albertine Graben developments. Ethiopia’s market benefits from hydropower turbines and legacy diesel fleets, despite the ICE ban. Rwanda, Burundi, and eastern DRC collectively represent a smaller share of direct sales but offer potential for re-export growth as road and lake freight networks improve.
Competitive Landscape
The top three marketers, Vivo Energy Kenya, Rubis Energy Kenya, and TotalEnergies Marketing Kenya, controlled the majority of downstream fuel sales in 2025, and their lubricant lines reflect a similar distribution. Kenya’s 0.105 Herfindahl-Hirschman Index indicates limited-but-concentrated rivalry, allowing the majors to influence pricing while smaller distributors struggle to absorb the EAC’s fixed duty. Rubis’ KSh 6 billion investment in National Oil demonstrates how vertical integration secures stock financing and depot infrastructure. Vivo Energy’s VE-CEM digital service shifts the focus from commodity supply to uptime optimization, securing fleet accounts in mining, haulage, and agriculture. Oryx Energies, with ISO 9001/14001/45001 certifications, emphasizes blend traceability to counteract the impact of counterfeit products on premium segments.
East Africa Lubricants Industry Leaders
TotalEnergies
Shell plc
Chevron Corporation
Oryx Energies
Hass Group
- *Disclaimer: Major Players sorted in no particular order

Recent Industry Developments
- January 2026: Ethiopian Airlines formalized a five-year supply agreement with UK-based Aeroservices to procure ExxonMobil Aviation Lubricants. This partnership will ensure a steady and dependable supply of essential materials for the airline's aircraft maintenance operations.
- November 2025: Gulf Energy Ltd., a Nairobi-based trading company, announced plans to commence crude oil production from the South Lokichar Basin by the end of 2026. This development is expected to influence the lubricant market by potentially increasing the availability of raw materials for production.


East Africa Lubricants Market Report Scope
Lubricants are substances made from a combination of base oils and additives. These lubricants are used in various automotive applications such as engines, brakes, gears, and other parts. The base oil composition in the formulation of lubricants is primarily between 75-90%. Lubricants are used to reduce friction between surfaces in contact to minimize energy loss generated from friction.
The East Africa lubricants market is segmented by product type, base stock type, end-user industry, and geography. By product type, the market is segmented into automotive engine oil, industrial engine oil, transmission fluids, gear oil, brake fluids, hydraulic fluids, greases, process oil (including rubber process oil and white oil), metalworking fluids, turbine oil, transformer oil, and other product types. By base stock type, the market is segmented into mineral oil-based lubricants, synthetic lubricants, semi-synthetic lubricants, and bio-based lubricants. By end-user industry, the market is segmented into automotive, marine, aerospace, heavy equipment, industrial, and other end-user industries. The automotive segment is further segmented into passenger vehicles, commercial vehicles, and two-wheelers. The heavy equipment segment is further segmented into construction, mining, and agriculture. The industrial segment is further segmented into power generation, metallurgy and metalworking, textiles, and oil and gas. The report also covers the market size and forecasts for lubricants in 7 countries across the region. For each segment, the market sizing and forecasts have been done on the basis of volume (liters).
| Automotive Engine Oil |
| Industrial Engine Oil |
| Transmission Fluids |
| Gear Oil |
| Brake Fluids |
| Hydraulic Fluids |
| Greases |
| Process Oil (Including Rubber Process Oil and White Oil) |
| Metalworking Fluids |
| Turbine Oil |
| Transformer Oil |
| Other Product Types |
| Mineral Oil-Based Lubricants |
| Synthetic Lubricants |
| Semi-Synthetic Lubricants |
| Bio-Based Lubricants |
| Automotive | Passenger Vehicles |
| Commercial Vehicles | |
| Two-Wheelers | |
| Marine | |
| Aerospace | |
| Heavy Equipment | Construction |
| Mining | |
| Agriculture | |
| Industrial | Power Generation |
| Metallurgy and Metalworking | |
| Textiles | |
| Oil and Gas | |
| Other End-user Industries |
| Kenya |
| Tanzania |
| Uganda |
| Ethiopia |
| Rwanda |
| Burundi |
| Democratic Republic of Congo |
| By Product Type | Automotive Engine Oil | |
| Industrial Engine Oil | ||
| Transmission Fluids | ||
| Gear Oil | ||
| Brake Fluids | ||
| Hydraulic Fluids | ||
| Greases | ||
| Process Oil (Including Rubber Process Oil and White Oil) | ||
| Metalworking Fluids | ||
| Turbine Oil | ||
| Transformer Oil | ||
| Other Product Types | ||
| By Base Stock Type | Mineral Oil-Based Lubricants | |
| Synthetic Lubricants | ||
| Semi-Synthetic Lubricants | ||
| Bio-Based Lubricants | ||
| By End-user Industry | Automotive | Passenger Vehicles |
| Commercial Vehicles | ||
| Two-Wheelers | ||
| Marine | ||
| Aerospace | ||
| Heavy Equipment | Construction | |
| Mining | ||
| Agriculture | ||
| Industrial | Power Generation | |
| Metallurgy and Metalworking | ||
| Textiles | ||
| Oil and Gas | ||
| Other End-user Industries | ||
| By Geography | Kenya | |
| Tanzania | ||
| Uganda | ||
| Ethiopia | ||
| Rwanda | ||
| Burundi | ||
| Democratic Republic of Congo | ||


Key Questions Answered in the Report
How large is the East Africa lubricant market?
The East Africa lubricant market stands at 318.43 million liters in 2026 and is projected to reach 407.37 million liters by 2031.
Which country used the most lubricant in East Africa in 2025?
Kenya accounted for 41.66% of regional volume in 2025, supported by the largest retail network.
What product type dominated consumption in 2025?
Automotive engine oil led with 45.62% of the 2025 demand, reflecting the large used-vehicle fleet.
How big is counterfeit penetration?
Substandard and counterfeit lubricants represent roughly 20% of East African volume, costing legitimate brands significant revenue.
Page last updated on:


