
Market Overview
| Study Period | 2020 - 2031 |
|---|---|
| Forecast Data Period | 2026 - 2031 |
| Base Year Market Size (2025) | 1.54 Billion Liters |
| Market Volume (2026) | 1.58 Billion Liters |
| Market Volume (2031) | 1.81 Billion Liters |
| Growth Rate (2026 - 2031) | 2.74 % |
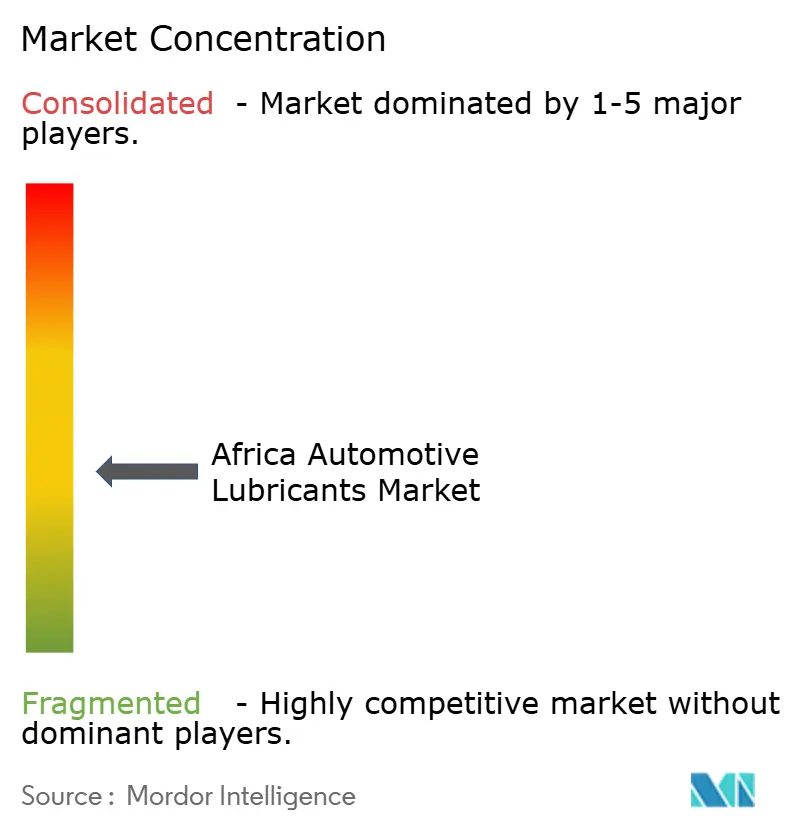
| Market Concentration | Medium |
Major Players *Disclaimer: Major Players sorted in no particular order Image © Mordor Intelligence. Reuse requires attribution under CC BY 4.0. | |
Africa Automotive Lubricants Market Analysis by Mordor Intelligence
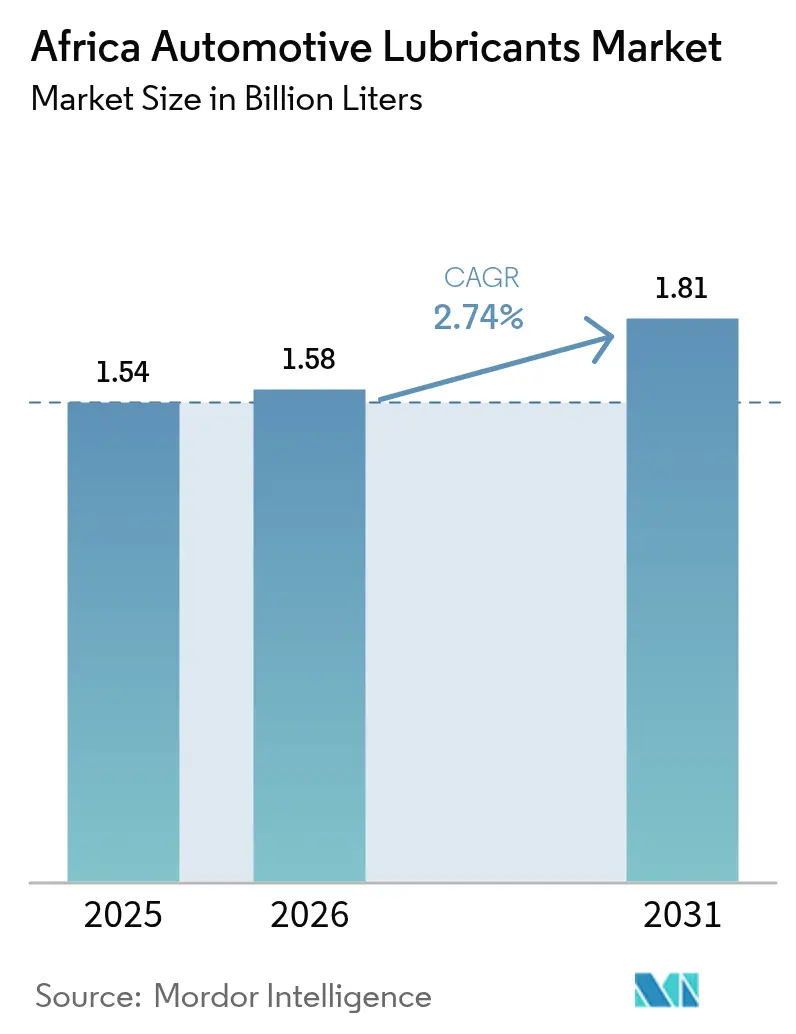
Africa Automotive Lubricants Market size in 2026 is estimated at 1.58 Billion Liters, growing from 2025 value of 1.54 Billion Liters with 2031 projections showing 1.81 Billion Liters, growing at 2.74% CAGR over 2026-2031. Sustained expansion of the continent’s vehicle parc, particularly in the age-weighted used-vehicle segment, remains the primary demand catalyst. Rising freight volumes under the African Continental Free Trade Area (AfCFTA), accelerated infrastructure investment, and gradual migration toward higher-grade synthetic formulations further reinforce the growth outlook. Despite lingering supply-chain constraints for base oils, local blending capacity additions and multinationals’ network consolidation have insulated end-users from severe product shortages. Counterfeit lubricant infiltration and crude-oil price volatility continue to challenge margins, yet regulatory agencies and brand owners alike are intensifying enforcement and authentication measures. Competitive differentiation increasingly hinges on technology partnerships, distribution reach, and the ability to supply products aligned with impending Euro IV and Euro VI emission-control norms.
Key Report Takeaways
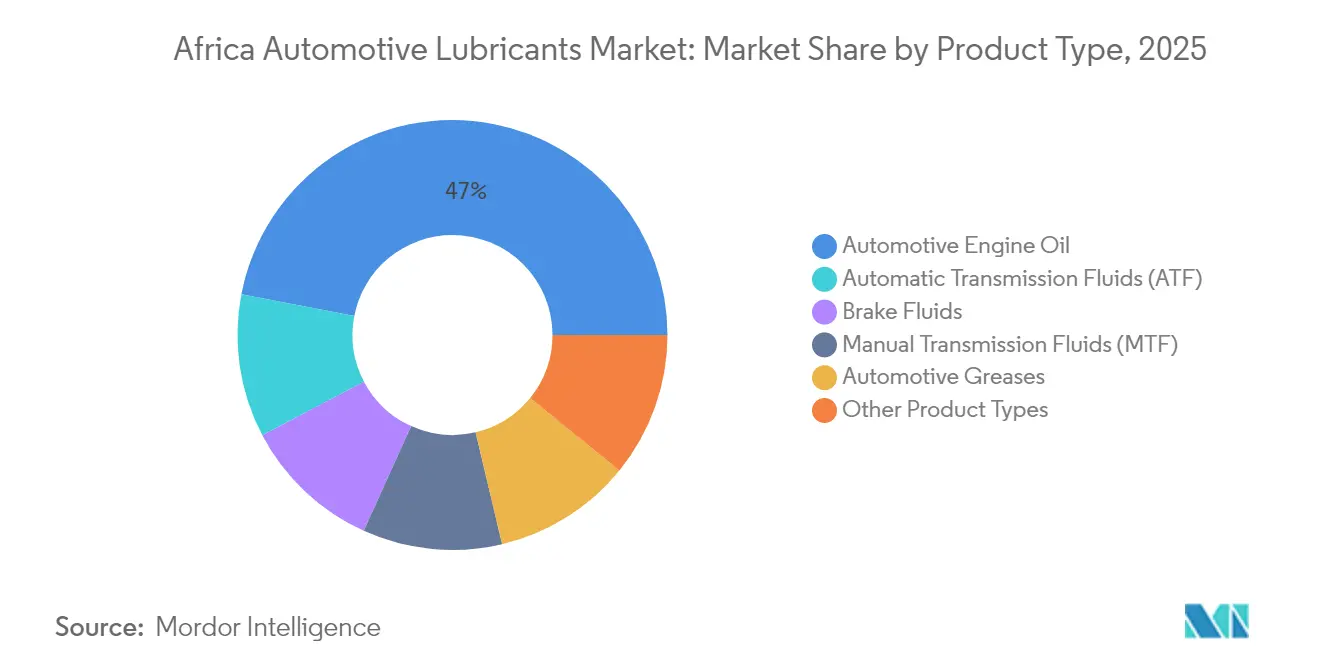
- By product type, automotive engine oil led with 46.96% of the Africa Automotive Lubricants market share in 2025, while automatic transmission fluid posted the fastest CAGR at 3.44% through 2031.
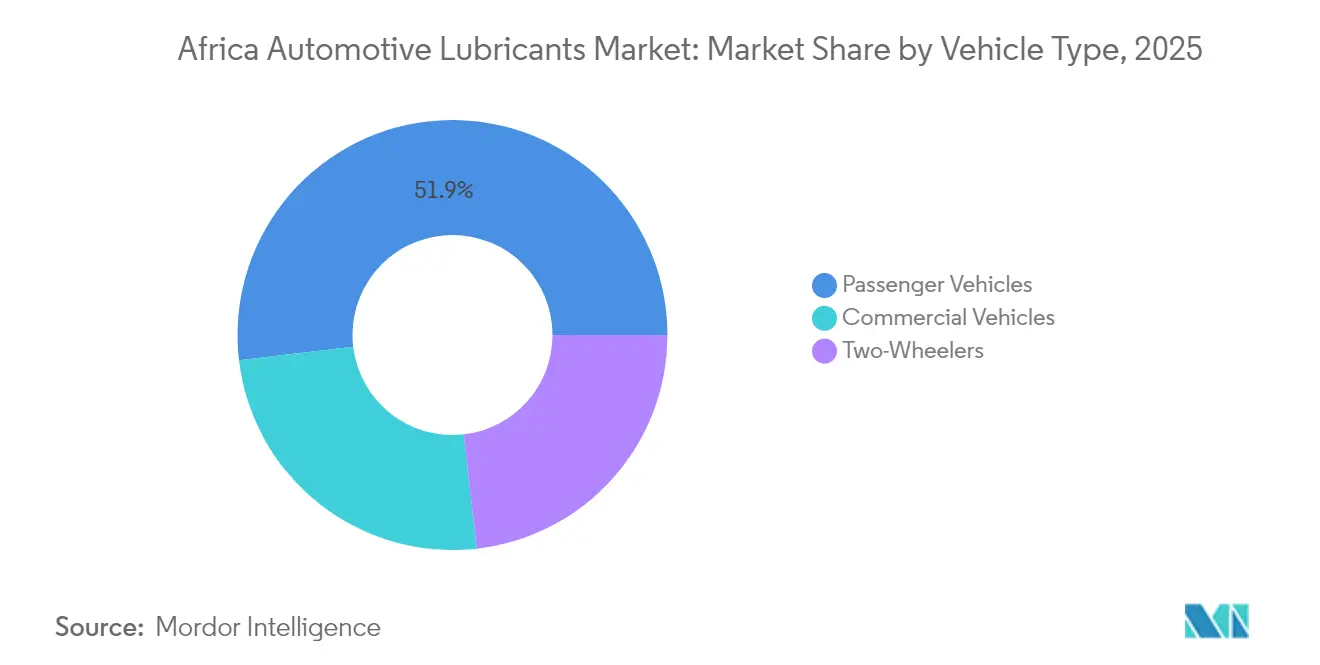
- By vehicle type, passenger vehicles accounted for 51.88% of the Africa Automotive Lubricants market size in 2025, whereas commercial vehicles recorded the highest growth momentum at 3.05% CAGR.
- By geography, South Africa captured 35.22% revenue share in 2025 and is advancing at a continent-leading 3.08% CAGR to 2031.
Note: Market size and forecast figures in this report are generated using Mordor Intelligence’s proprietary estimation framework, updated with the latest available data and insights as of 2026.
Africa Automotive Lubricants Market Trends and Insights
Drivers Impact Analysis*
| Driver | (~) % Impact on CAGR Forecast | Geographic Relevance | Impact Timeline |
|---|---|---|---|
| Rising vehicle parc and used-vehicle imports | +0.8% | Global, strongest in Nigeria, Kenya, Ghana | Medium term (2-4 years) |
| Growth in commercial transport and logistics activity | +0.7% | Global, concentrated in South Africa, Nigeria, Egypt | Long term (≥ 4 years) |
| Shift toward higher-grade and synthetic oils under tightening emission norms | +0.5% | South Africa, Morocco, Egypt leading adoption | Long term (≥ 4 years) |
| AfCFTA accelerating intra-Africa lubricant trade and supply-chain optimisation | +0.4% | Pan-African, early gains in SADC and ECOWAS regions | Medium term (2-4 years) |
| Expansion of local blending capacity and distributor networks | +0.3% | South Africa, Morocco, Kenya, Nigeria | Short term (≤ 2 years) |
| Source: Mordor Intelligence | |||
Rising Vehicle Parc and Used-Vehicle Imports Drive Sustained Demand
Ongoing fleet expansion underpins stable lubricant off-take across the Africa Automotive Lubricants market. Most African countries continue to rely on second-hand imports, keeping the median vehicle age above 12 years and cementing regular oil-change cycles. Kenya’s eight-year import age ceiling, coupled with differentiated excise tiers, is encouraging a gradual shift toward newer models that specify low-viscosity synthetics, thereby broadening the demand for premium-grade products. Tanzania and Ghana are following similar policy paths, balancing incremental electric-vehicle incentives with the recognition that internal-combustion engines will continue to dominate through 2030. Rwanda’s registered vehicle stock surpassed 270,000 units in 2024, 40% of which are motorcycles, demonstrating that two-wheelers remain a material volume contributor. Morocco’s automotive manufacturing ecosystem, which accounts for 22% of GDP, generates incremental factory-fill requirements and heightens lubricant quality expectations.
Commercial Transport & Logistics Activity Expansion
Trade liberalization under AfCFTA has lifted intra-African merchandise trade volumes by 7.7% year-on-year in 2024, driving heavier utilization of trucks, buses, and construction machinery[1]African Export-Import Bank, “African Trade and Economic Outlook Report 2025,” afreximbank.com. South Africa’s cross-border corridors now support average daily heavy-truck flows exceeding 6,000 units, intensifying the need for high-detergency engine oils and long-drain transmission fluids. Nigeria’s Lagos–Kano rail modernization and the USD 25 billion Nigeria–Morocco Gas Pipeline are driving demand for industrial greases and hydraulic fluids during the construction phases. Ghana’s USD 12 billion Petroleum Hub, under development since 2024, is set to anchor future storage and blending facilities, bridging supply gaps in West Africa.
Shift Toward Higher-Grade & Synthetic Oils Under Emission Standards Evolution
The progressive introduction of Euro IV and impending Euro VI regulations is propelling a shift from Group I to Group II/III base-oil platforms within the African automotive lubricants market. Kenya’s DKS 1515:2025 inspection framework requires Euro IV conformity for newly registered vehicles, mandating low-SAPS (Sulfated Ash, Phosphorus, and Sulfur), low-viscosity formulations. South Africa’s draft national exhaust-emissions strategy aims to adopt Euro VI standards in commercial fleets by 2028, incentivizing transport operators to adopt synthetic fuels that reduce particulate emissions and extend engine life. OEM (original equipment manufacturer) assemblers in Morocco and Egypt already require factory-fill approvals that meet ACEA (European Automobile Manufacturers' Association) C3 and API SP specifications, thereby raising the average quality bar across the supply chain.
AfCFTA Trade Facilitation & Supply-Chain Optimization
Tariff elimination and the phased alignment of technical regulations are streamlining lubricant flows among 54 signatories of AfCFTA[2]United Nations Conference on Trade and Development, “Non-Tariff Measures on AfCFTA Trade,” unctad.org. Harmonized customs codes and digital single-window systems are reducing dwell times at high-volume borders such as Beitbridge and Kasumbalesa by up to 30%. Vivo Energy’s post-merger retail network now spans 3,900 stations in 28 countries, creating a continent-wide platform for uniform product launches and faster stock rotation. Multinationals are rationalizing their blending footprints into strategic hubs—such as Johannesburg, Tunis, Casablanca, and Mombasa—to maximize plant utilization and mitigate duplicative compliance costs.
Restraints Impact Analysis*
| Restraint | (~) % Impact on CAGR Forecast | Geographic Relevance | Impact Timeline |
|---|---|---|---|
| Counterfeit and low-quality lubricant penetration | -0.60% | Nigeria, Kenya, Ghana most affected, spreading to rural markets across sub-Saharan Africa | Short term (≤ 2 years) |
| Crude-oil price volatility impacting feedstock costs | -0.40% | Global, import-dependent markets most vulnerable, particularly Nigeria, Morocco, Egypt | Short term (≤ 2 years) |
| Under-developed used-oil collection and rerefining ecosystem | -0.30% | Pan-African, most acute in Nigeria, Kenya, Ghana with limited infrastructure | Medium term (2-4 years) |
| Source: Mordor Intelligence | |||
Counterfeit Lubricant Penetration Undermines Market Growth
Counterfeit volumes are estimated to be more than 20% of the total supply in several West and East African countries, eroding legitimate brand revenues and tarnishing end-user trust. Kenya’s Anti-Counterfeit Authority pegs direct annual tax losses at KES 2.1 billion. Sophisticated falsification of labels, QR codes, and tamper-evident seals blurs authenticity checks at the retail level, particularly in informal markets. Brand owners are responding with blockchain-enabled track-and-trace programs, serialized closures, and nationwide “clean trade” campaigns. Regulatory bodies are stepping up field raids, but judicial backlogs and low conviction rates continue to dilute deterrence.
Crude-Oil Price Volatility Disrupts Supply-Chain Economics
With only about 700,000 tons per year of legacy Group I capacity spread across six small-scale refineries, Africa relies heavily on imported Group I, II, and III base stocks. Freight premiums from Europe and the Middle East increase delivered costs by 15–18% compared to FOB benchmarks. In Nigeria, the landed SN 500 price recently averaged USD 975 per ton, compared with USD 880 in Rotterdam, squeezing blender margins and encouraging opportunistic spot buying. The absence of incontinent Group II capacity leaves the Africa Automotive Lubricants market vulnerable to global crude oil gyrations; a USD 10-per-barrel swing can shift base-oil offers by up to USD 40 per ton, thereby feeding retail price volatility.
*Our forecasts treat driver/restraint impacts as directional, not additive. The impact forecasts reflect baseline growth, mix effects, and variable interactions.
Segment Analysis
By Product Type: Engine Oil Prevails While Transmission Fluids Accelerate
Automotive engine oil retained dominance at 46.96% of the Africa Automotive Lubricants market in 2025, underscoring its indispensable role in routine maintenance for an aging fleet. Automatic transmission fluid is projected to expand at a 3.44% CAGR, the fastest among all product groups, reflecting the rising share of automatic gearboxes in light-duty imports and premium commercial trucks. Manual transmission and axle oil demand will remain stable but cede an incremental share to ATF. Brake fluids and greases posted low-single-digit growth, driven by increased safety inspections and the refurbishment of heavy equipment. The transition to 5W-30 and 0W-20 multigrades, alongside OEM-specific approvals such as Ford WSS-M2C952-A1, exemplifies the shift toward low-viscosity synthetics for improved fuel efficiency.
Monograde SAE 40 remains relevant in stationary engines and older minibuses, particularly outside major urban centers, but its proportional contribution is expected to decline. Factory-fill opportunities in Morocco’s burgeoning EV supply chain are opening specialty niches for thermal-management fluids and e-axle greases, with volumes small today yet growing at double-digit rates as local OEM assembly scales.



By Vehicle Type: Commercial Fleets Propel Volume Upside
Passenger vehicles accounted for 51.88% of total lubricants in 2025, reflecting their numerical superiority across most African markets. However, commercial vehicles—trucks, buses, and off-highway machinery—are forecast to post a stronger 3.05% CAGR through 2031 as cross-border logistics, mining, and construction intensify under AfCFTA. Heavy-duty diesel engine oil formulations meeting API CK-4 and ACEA E8 standards are gaining traction among fleet managers who prioritize extended oil-drain intervals and lower total cost of ownership.
Two-wheelers retain a notable 12–15% share in East African countries, with motorcycle fleets exceeding 1 million units in Kenya and Uganda. Demand for low-smoke, JASO FC-certified two-stroke oils and high-temperature four-stroke grades will persist, albeit at modest growth rates as ride-hailing platforms modernize their fleets. Commercial engines accounted for 24.92% of the Africa automotive lubricants market size in 2025 and are expected to reach 27.15% by 2031, underscoring their rising influence on aggregate volumes.
Geography Analysis
South Africa’s 35.22% share of the Africa Automotive Lubricants market in 2025 stems from its sizable light- and heavy-duty fleets, sophisticated retail network, and export-oriented blending plants. The February 2025 completion of FUCHS’s EUR 26 million expansion raised national blending capacity by 110 million liters, ensuring product availability for SADC neighbors and reinforcing Johannesburg’s role as a regional hub. Retail consolidation following the Vivo Energy-Engen merger added unrivaled storage and forecourt reach, boosting distribution efficiency and enabling uniform product rollouts across Southern Africa.
Nigeria ranks second in absolute volume. Blenders such as Eraskon and CDN Oil have stepped up local production; however, the market remains vulnerable to counterfeit infiltration and foreign-exchange bottlenecks that complicate base-oil imports. The impending start-up of the 650,000 barrels-per-day Dangote refinery promises to diversify domestic feedstock supply, although Group II streams will remain limited during the initial phase. Infrastructure projects, including the Lagos-Kano rail line, the Lekki deep-sea port, and multiple national highway upgrades, support robust growth in commercial vehicle lubricants.
Morocco and Egypt anchor the demand in North Africa. Morocco benefits from proximity to European technology, a thriving automotive OEM cluster, and government incentives for battery manufacturing. Egypt leverages its Suez Canal logistics advantages and a significant petrochemical base, but still relies on tenders for bright stock imports due to constrained local supply. Collectively, the Maghreb and Nile Valley represent 21.74% of continental volume and are projected to expand at a 2.85% CAGR.
The Rest of Africa grouping—comprising Kenya, Ghana, Tanzania, Côte d’Ivoire, Angola, and others—accounts a significant volume of the African Automotive Lubricants market. Growth is closely linked to road-building, mining, and the mechanization of agricultural projects. Kenya’s goal of electrifying urban motorcycle taxis by 2025 influences the demand trajectories for two-stroke oil, yet the wider uptick in commercial vehicle sales offsets this. Tanzania’s natural gas development and Ghana’s petroleum hub vision foster incremental industrial lubricant requirements.
Regulatory Landscape
Regulation in the Africa automotive lubricants market is shaped by national licensing regimes and regional standards convergence. Kenya introduced the Petroleum (Lubricants Facility Construction and Business Licensing) Regulations, 2025, which link lubricant facility licensing and operations to compliance with Kenya Bureau of Standards quality benchmarks. This raises the bar for formal blenders and importers and tightens oversight on product quality.
On the regional front, technical harmonization is progressing through the East African Community (EAC) and the African Organisation for Standardisation (ARSO). The EAC adopted DEAS 1145:2023 (automotive manual transmission gear oils) on 14 June 2024 and updated EAS 159:2024 for automotive engine oils, creating a more consistent conformity target across member states. ARSO, via its automotive technical committee (TC 59), is aligning standards and vehicle-related requirements (including UN ECE-linked homologation frameworks such as ARS 1595-2021), supporting cross-border trade under AfCFTA while increasing the importance of meeting recognized API/ACEA-aligned performance specifications.
Value Chain Analysis
The value chain begins with base oils and additive packages, and Africa remains structurally dependent on imported Group I/II/III base stocks while staying exposed to freight and currency volatility. Blending and packaging are concentrated in regional hubs (notably South Africa and select North African locations). Toll blending and private-label arrangements support smaller brands, but informal repackaging and counterfeit infiltration persist at the downstream end of the chain.
Route-to-market relies on fuel-station networks, lubricant distributors, workshops, and independent retail. AfCFTA trade facilitation (Annex 6 on Technical Barriers to Trade) supports the movement of finished lubricants and inputs where standards are aligned. Recent investments point to faster, more de-risked supply flows: FUCHS commissioned a new lubricant manufacturing facility in Gqeberha (Eastern Cape) in August 2025 to improve regional distribution responsiveness. In August 2025, Chevron Products Company agreed to use Gapuma Group as a distributor for Group II base oils in Nigeria, strengthening local formulator access to higher-quality base stocks needed for API/ACEA and OEM-aligned blends.
Competitive Landscape
The Africa Automotive Lubricants Market is moderately fragmented as global majors leverage technology leadership and brand equity, while regional independents narrow gaps through localized manufacturing and nimble distribution. Shell maintains the broadest OEM-approved product portfolio and leverages the Shell-Vivo joint blending network, which spans six African nations. TotalEnergies capitalizes on its heritage fuel station footprint and franchise network, especially in Francophone West and Central Africa. Smaller independents are turning to toll-blending alliances and private-label exports to niche markets, carving defensible positions in price-sensitive segments such as agricultural equipment and generator oils.
Africa Automotive Lubricants Industry Leaders
ExxonMobil Corporation
TotalEnergies
BP p.l.c.
Shell plc
Engen Petroleum (PTY) LTD
- *Disclaimer: Major Players sorted in no particular order

Market Opportunities and Future Outlook
A key opportunity lies in upgrading the formulation mix toward higher-performance engine oils and driveline fluids that fit tightening vehicle and emissions compliance regimes and OEM approval requirements. EAC standards updates, including EAS 159:2024 for engine oils and the June 2024 adoption of DEAS 1145:2023 for manual transmission gear oils, set clearer specification targets that favor branded suppliers with documented quality systems. This also gives distributors room to rationalize SKUs across multiple markets.
Supply resilience is another whitespace area, especially where import dependency and logistics constraints raise delivered costs. Capacity and infrastructure commitments include FUCHS inaugurating an expanded production facility in Isando, Johannesburg, in February 2025 after a EUR 26 million investment that lifted capacity by over 40%. Etu Energias also announced a 24,000 metric ton per year lubricants plant in Angola (Icolo e Bengo), with completion slated for Q1 2026. Downstream storage and port logistics upgrades also support steadier product availability for large retail networks and commercial fleet channels that consume higher volumes and increasingly demand certified, consistent lubricant quality, including Vivo Energy's announced investment at Durban (Island View and tank conversions).
Recent Industry Developments
- April 2026: Vivo Energy announced a USD 130 million investment to expand fuel and storage capacity at the Durban port in South Africa, including conversion of refinery tanks and upgrades at the Island View receiving facility. The added storage and handling capability supports larger, more resilient downstream supply chains that also carry packaged lubricants through the same distribution ecosystems, improving network reliability for major forecourt-led channels.
- January 2026: TotalEnergies Marketing Africa inaugurated the manufacturing of Toyota Genuine Motor Oil (TGMO) at the CSL blending plant in Senegal in partnership with ENEOS Middle East and Africa FZE and CFAO Mobility. Localizing a co-branded OEM lubricant strengthens factory-fill and dealer-channel credibility while deepening regional blending footprints that can serve multiple West African markets.
- May 2024: PETRONAS completed the sale of a 74% stake in Engen Limited to Vivo Energy, with The Phembani Group remaining a shareholder. The ownership shift accelerated consolidation across a major downstream network, influencing how lubricants are marketed and distributed through forecourts and affiliated workshop channels.


Research Methodology Framework and Report Scope
Market Definition and Coverage
This market covers lubricants consumed in on-road vehicles across Africa, measured as automotive lubricant demand through workshops, retailers, fleets, and OEM service networks, and counted at the point they are used in vehicles.
Scope exclusions: It excludes industrial lubricants for mining and factories, marine and rail lubricants, and fuel additives that are not lubricants.
Segmentation Overview
- By Product Type
- Automotive Engine Oil
- 0W-XX
- 5W-XX
- 10W-XX
- 15W-XX
- Monogrades
- Other Grades
- Manual Transmission Fluids (MTF)
- Automatic Transmission Fluids (ATF)
- Brake Fluids
- Automotive Greases
- Other Product Types (Power Steering Fluid etc.)
- Automotive Engine Oil
- By Vehicle Type
- Passenger Vehicles
- Commercial Vehicles
- Two-Wheelers
- By Geography
- Egypt
- Morocco
- Nigeria
- South Africa
- Rest of Africa
Data Sources, Market Sizing, and Validation
Desk Research
Desk work was used to build the base demand pool and to anchor assumptions that can be checked repeatedly over time. We referred to public sources such as OICA vehicle production releases, country vehicle registration and fleet publications, national statistics offices, UN Comtrade trade data for base oils and finished lubricants, and IEA road transport indicators.
To avoid relying on a single data stream, the supply side was also reviewed using materials like customs import trends, refinery and blending capacity announcements, and standards and emissions direction from bodies such as UNECE WP.29 references and local regulator updates where available. Company annual reports, investor decks, and reputable press were used to understand channel shifts, pricing pressure, and counterfeit risks, and a paid subscription for shipment-level trade intelligence and company financials was used selectively to cross-check volumes and supplier footprints. These desk sources are illustrative only, and many additional public and paid references were used for data collection, validation, and clarification during the study.
Primary Interviews and Surveys
Primary interviews and surveys were done across the value chain, including lubricant blenders, base oil distributors, workshop networks, fleet operators, and large retail and wholesale channels. We used these conversations to confirm drain intervals, product mix shifts (mineral versus semi-synthetic and synthetic), and the practical split between formal and informal channels across major African sub-regions.
Distribution of primary research fieldwork respondents
| Company type | Respondent position |
|---|---|
| Top tier: 33% | CXOs: 14% |
| Mid tier: 49% | Functional/Unit leaders: 30% |
| Smaller Players: 18% | Managers: 56% |
Market-Sizing & Forecasting
Market sizing was built around a top-down demand pool that reconstructs lubricant consumption from the in-use vehicle parc, average annual kilometers, average sump fill, and drain interval patterns, which are then adjusted by the share of vehicles that are actively operating (especially in commercial fleets). Results were corroborated using selective bottom-up checks, such as sampled channel volumes from distributors and workshop chains, plus ASP x volume sanity checks for key product groups when pricing signals were consistent.
To keep the model practical, a few market fingerprints were tracked closely, including the parc mix by passenger cars, commercial vehicles, and two-wheelers, the shift in viscosity grades and performance categories, the split between engine oils and other automotive fluids and greases, and the effect of import availability for base oils and finished lubricants on supply continuity. Where country-level gaps existed, we used neighboring market analogs and trade flow proxies first, and then narrowed the estimate using primary feedback on local maintenance behavior and channel reach.
Forecasting was done using scenario analysis supported by trend lines for vehicle parc growth, freight movement expectations, and expected changes in average drain intervals as newer vehicles and higher-grade lubricants gain share. The final forecast was only moved when multiple variables pointed in the same direction and when primary respondents broadly agreed on the pace of change.
Data Validation & Update Cycle
Outputs were checked through triangulation across independent signals, including vehicle parc growth, lubricant import patterns, and realistic per-vehicle consumption ranges, before totals were accepted. If an outlier appeared at country or product level, the assumption stack was reviewed, followed by targeted re-contacts to validate whether the change was real or caused by a one-time shock.
A second analyst review was used to test calculations, currency handling, and year-on-year consistency, and only then is the model signed off for publication. Reports are refreshed annually, with interim updates when material events occur, such as sudden trade restrictions, major refinery outages, or sharp base oil price swings. Before delivery, we perform a last pass so clients receive the latest updated view.
Mordor Intelligence's Africa Automotive Lubricants Market Size Compared With Other Published Estimates
Published market sizes for Africa automotive lubricants can look far apart because some sources mix value and volume, and others define the market at different points in the chain (production, imports, or end-use consumption). Differences also come from how informal sales, counterfeit displacement, and country coverage within Africa are treated.
Key gap drivers are usually scope and conversion logic, since one estimate may include industrial or marine lubricants, while another may only count packaged passenger car oils and miss commercial fleet fluids and greases. Another common gap is the price build, where aggressive assumptions on synthetic share and faster ASP increases can lift the USD number even if liters are similar, and slower refresh cycles can miss step-changes in base oil costs and currency moves. In our benchmark, the market is anchored in end-use liters and then converted to USD using country-level product mix and channel price checks, which keeps adjacent non-automotive lubricant volumes out of the total, a modeling choice applied by Mordor Intelligence.
Benchmark comparison
| Source | Market Size | Gaps in Research Methodology |
|---|---|---|
| Mordor Intelligence | USD 0.00 B (2025) | |
| Industry Association A | USD 0.00 B (2025) | Often reported from member-reported sales and formal channel coverage, which can understate informal workshop trade and gray-market volumes in several African countries. |
| Trade Journal B | USD 0.00 B (2026) | Typically extrapolates from import and blending headlines with broad pricing assumptions, which can overstate value when product mix and local pricing dispersion are not validated country by country. |
The spread in published numbers is largely explained by whether the estimate is built from end-use consumption versus supply proxies, and by how the USD conversion is handled in a volatile currency environment. By keeping the inputs tied to the vehicle parc, drain behavior, and a checked product mix, the final figure stays traceable to clear variables and can be replicated when those same signals update.


Key Questions Answered in the Report
What is the size of the African automotive lubricants market in 2026?
It reached 1.58 billion liters in 2026 and is projected to grow at 2.74% CAGR to 2031.
Which product dominates lubricant demand across Africa?
Automotive Engine oil leads with 46.96% share, though automatic transmission fluid is the fastest-growing category.
Why does South Africa hold a leading position in lubricant consumption?
The country combines the continent’s largest finished-lubricant distribution network with a sizeable vehicle parc and export-oriented blending capacity.
What is the main threat to legitimate lubricant suppliers?
Counterfeit and low-quality products, which can represent more than 20% of volumes in some countries, undermine brand equity and tax revenues.
How will AfCFTA affect lubricant trade?
Tariff removal and standards harmonization are shortening cross-border transit times and enabling regional supply-chain optimization for blenders and distributors.
Page last updated on:


 Your data is secure and never sold or shared.


