
Market Overview
| Study Period | 2020 - 2031 |
|---|---|
| Forecast Data Period | 2026 - 2031 |
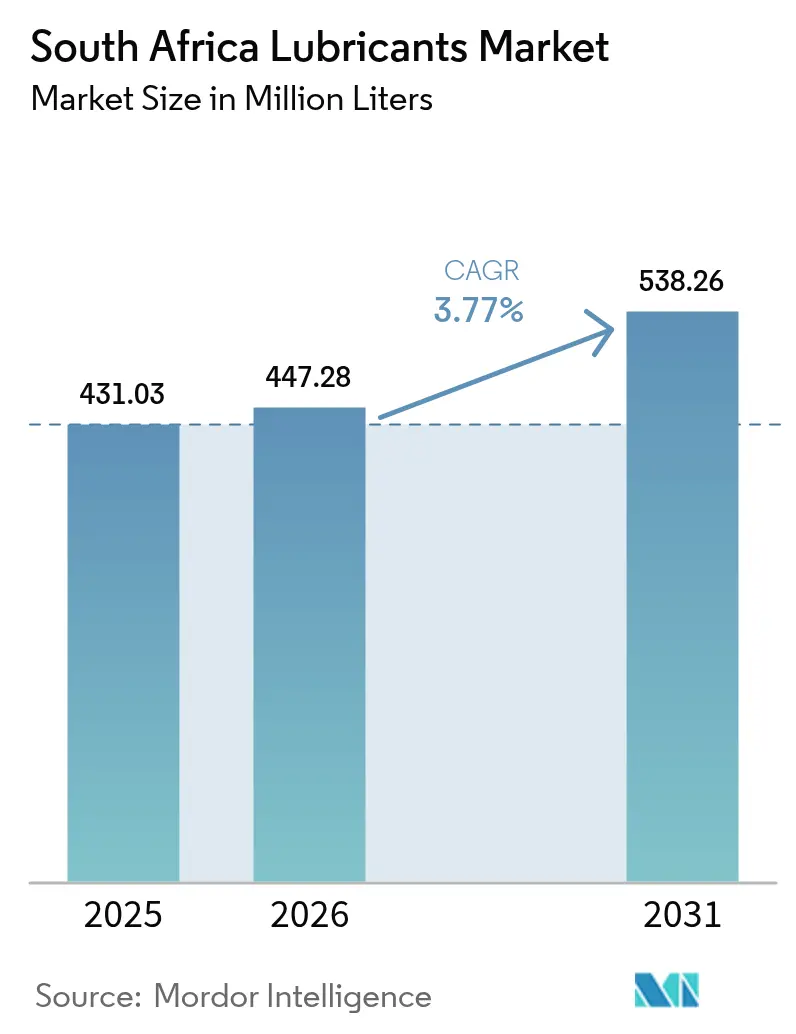
| Base Year Market Size (2025) | 431.03 Million Liters |
| Market Volume (2026) | 447.28 Million Liters |
| Market Volume (2031) | 538.26 Million Liters |
| Growth Rate (2026 - 2031) | 3.77 % |
| Market Concentration | Medium |
Major Players *Disclaimer: Major Players sorted in no particular order Image © Mordor Intelligence. Reuse requires attribution under CC BY 4.0. | |
South Africa Lubricants Market Analysis by Mordor Intelligence
The South Africa Lubricants Market size is expected to grow from 431.03 Million Liters in 2025 to 447.28 Million Liters in 2026 and is forecast to reach 538.26 Million Liters by 2031 at 3.77% CAGR over 2026-2031. This solid trajectory mirrors steady industrial activity, resilient mining output, and a still-expanding vehicle fleet, all of which underpin recurring demand for higher-specification lubricant grades. Frequent load-shedding events continue to drive the use of backup generators, adding incremental volumes of engine oil, while tightening environmental rules are nudging buyers toward premium synthetics that reduce waste volumes and lengthen drain intervals. Supply-side dynamics are evolving as two domestic refineries remain operational at utilization rates below 50% of their 2020 levels, thereby increasing import dependence for base oils and finished blends. Competitive intensity is rising because the recently combined Vivo-Engen retail network now spans more than 1,300 stations, granting the group unrivaled route-to-market reach in the South Africa lubricants market.
Key Report Takeaways
- By product type, automotive engine oil held a 44.26% share of the Colombia lubricants market size in 2025, while greases are advancing at a 4.18% CAGR through 2031.
- By end-user industry, the automotive sector captured 58.09% of the Colombia lubricants market share in 2025; the industrial sector records the fastest expansion at a 3.96% CAGR to 2031.
- By base stock type, mineral oil-based lubricants accounted for 67.65% of the market in 2025, and the demand for synthetic lubricants is expected to grow with a CAGR of 4.04% during the forecast period (2026-2031).
Note: Market size and forecast figures in this report are generated using Mordor Intelligence’s proprietary estimation framework, updated with the latest available data and insights as of 2026.
South Africa Lubricants Market Trends and Insights
Drivers Impact Analysis*
| Driver | (~) % Impact on CAGR Forecast | Geographic Relevance | Impact Timeline |
|---|---|---|---|
| Vehicle-parc expansion and ageing fleet | +0.8% | Gauteng, Western Cape, nationwide aftermarket | Medium term (2-4 years) |
| Mining and industrial rebound | +1.2% | Limpopo, North West, Northern Cape, heavy-industry corridors | Short term (≤ 2 years) |
| Rapid shift toward premium synthetics | +0.6% | Industrial hubs, freight corridors | Long term (≥ 4 years) |
| On-site UCO-to-biodiesel programs | +0.3% | Western Cape, KwaZulu-Natal, select national pilots | Long term (≥ 4 years) |
| Digital “lubricants-plus” fleet services | +0.4% | Metro areas with dense commercial fleets | Medium term (2-4 years) |
| Source: Mordor Intelligence | |||
Vehicle-parc Expansion and Ageing Fleet
South Africa’s registered vehicle population continues to edge upward, supported by record automotive exports valued at ZAR 201.7 billion in 2024[1]NAAMSA Staff, “2024 Automotive Export Performance,” naamsa.co.za. An ageing parc means vehicles require more frequent oil changes and tolerate thicker viscosities to compensate for engine wear. Load-shedding accelerates commercial fleet turnover as operators deploy generators and hybrid vans to safeguard uptime; however, internal-combustion powertrains still dominate sales, accounting for 98.6% of the total in 2025. Consequently, demand for mid-tier mineral engine oils remains sticky, though premium synthetics are increasingly specified by fleet managers seeking longer drain intervals. Parts suppliers report that extended-drain formulations shave one to two service visits per year for high-mileage delivery vans, directly lowering downtime costs.
Mining and Industrial Rebound Boosting Demand
Improved commodity prices and stabilization programs have unlocked new mining capital expenditures, including a ZAR 11 billion renewable power pipeline announced by Sibanye-Stillwater to reduce energy costs and decrease diesel use. Electrified haul trucks and automated processing lines require specialty hydraulic fluids, gear oils, and advanced coolants that can maintain viscosity under high-load cycles. Plant managers are incorporating condition monitoring and lubricant-as-a-service contracts to minimize unplanned downtime, a trend that favors suppliers with technical field teams. As industrial production recovers from recent power supply shocks, orders for metalworking fluids, compressor oils, and food-grade lubricants also bounce back, pushing incremental volume into the South African lubricants market.
Rapid Shift Toward Premium Synthetics
End-users increasingly evaluate total cost of ownership rather than upfront drum price, a mindset that underpins the 4.11% CAGR expected for synthetics. Underground mining equipment operates in ambient temperatures exceeding 45°C and cannot afford viscosity breakdown; therefore, high-VI synthetic hydraulic fluids are the logical solution. Automotive workshops report stronger consumer uptake of fully synthetic SAE 5W-30 grades that meet new OEM warranty specs and deliver measurable fuel-economy gains. Early fleet pilots confirm drain-interval extensions of 15-20%, savings that are magnified when load-shedding reduces workshop availability. Environmental compliance is another catalyst: synthetics generally contain fewer heavy metals and generate lower volumes of waste oil, aligning with Extended Producer Responsibility (EPR) cost-avoidance strategies.
On-site UCO-to-Biodiesel Programs Raising Bio-lubricity Demand
National biofuels price regulations adopted in 2024 encourage factories and large hospitality groups to convert used cooking oil into biodiesel on-site. These micro-refineries require food-grade gear oils, high-temperature heat-transfer fluids, and specialty greases that can withstand acidic feedstocks. Chemical suppliers have introduced ester-based lubricants with enhanced lubricity to enhance biodiesel's cold-flow characteristics. Pilot plants in Cape Town and Durban have shown that integrating closed-loop lubricants and feedstock recovery can push overall waste-reduction rates above 40%. Meanwhile, lubricant vendors are designing reverse-logistics take-back schemes that collect spent bio-lubricants and return them to re-refiners, thereby monetizing compliance and creating cross-selling opportunities.
Restraints Impact Analysis*
| Restraint | (~) % Impact on CAGR Forecast | Geographic Relevance | Impact Timeline |
|---|---|---|---|
| Rand volatility and import-parity pricing | -0.9% | Nationwide, acute in coastal import hubs | Short term (≤ 2 years) |
| Stricter used-oil disposal regulation | -0.5% | Major metros with tight enforcement | Medium term (2-4 years) |
| Load-shedding-driven production volatility | -0.7% | Manufacturing and mining belts | Short term (≤ 2 years) |
| Source: Mordor Intelligence | |||
Rand Volatility and Import-parity Pricing Pressure
The South African Rand swung more than 18% against the US Dollar in 2024, transmitting immediate cost shocks to blenders that rely on imported API Group II and Group III base oils. A 10% depreciation often lifts finished-lubricant list prices 6-8% within three months, squeezing working capital for smaller independents that lack forward-cover facilities. Diesel levy hikes layered on top of currency swings elevate inland freight costs, particularly for servicing remote mines. Customers respond by requesting fixed-price contracts and longer payment terms, both of which increase credit risk exposure for distributors. Higher fuel surcharges also push up canister and carton costs, because packaging suppliers recoup energy and resin increases in real time.
Stricter Used-oil Disposal Regulation
Full enforcement of the EPR framework since May 2021 mandates lubricant producers to finance the collection of used oil and empty containers, submit audited tonnage reports, and meet recycling-rate thresholds. Non-compliance attracts fines and potential jail terms of up to 15 years, risks that push firms to over-invest in compliance infrastructure[2]Department of Forestry, Fisheries and the Environment, “Extended Producer Responsibility Regulations,” dffe.gov.za. Participation fees are charged on a net-cost recovery basis, meaning fee volatility mirrors recycled-commodity prices and collection efficiency, complicating budgeting. Medium-sized local blenders, which have historically relied on third-party collectors, now face capital outlays for tracking software and contracted transportation services. Although EPR drives environmental gains, the short-term effect is a 2-3% increase in shelf prices, which challenges volume retention in the price-sensitive retail channel.
*Our forecasts treat driver/restraint impacts as directional, not additive. The impact forecasts reflect baseline growth, mix effects, and variable interactions.
Segment Analysis
By Product Type: Engine Oils Drive Volume Growth
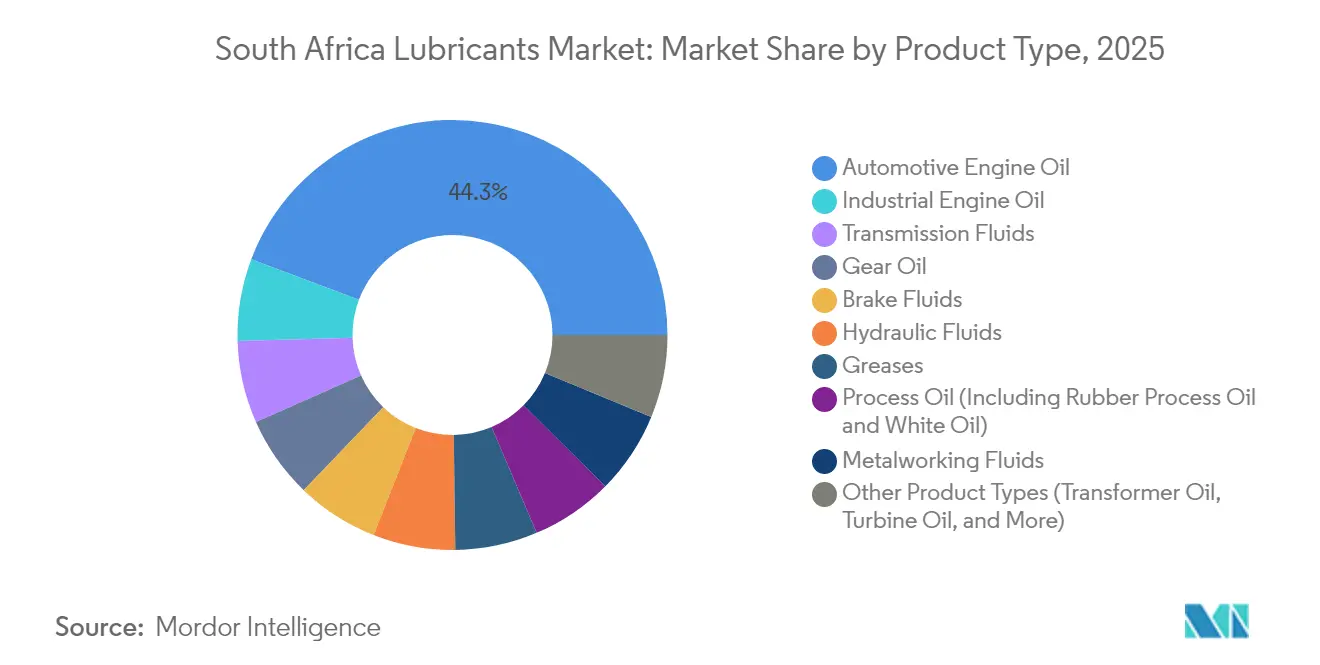
Automotive engine oils accounted for 44.26% of 2025 volume, ensuring that the South Africa lubricants market remains anchored in routine passenger-car and light-commercial maintenance cycles. Wide ownership of ageing vehicles and relatively low adoption of extended-drain practices sustain brisk workshop turnover, even as synthetic uptake climbs. Premium, fully synthetic grades, priced at a 30-40% premium to mineral equivalents, have widened their share in dealer channels that bundle oil changes with service plans. Greases, while only a mid-single-digit slice of total liters, register the quickest ascent at a 4.18% CAGR through 2031 thanks to intensified use in renewable-energy bearings and underground mining haul-truck wheel hubs. Transmission fluids and gear oils follow the growth of the commercial vehicle market, especially as automatic gearboxes proliferate in urban taxis.
The broader product mix is adapting to harsher duty cycles triggered by load-shedding: generator oils require high TBN to neutralize sulfur from low-grade diesel, while industrial compressor oils need improved oxidation stability for longer run times when plants shift to off-peak production windows. Metalworking fluids see renewed orders as manufacturing PMI returned to expansionary territory in mid-2025, though water-miscible chemistries now dominate new tenders because they pose lower VOC emissions. Process oils, notably white oils for cosmetics and rubber process oils for tire plants, maintain a niche foothold but deliver steady margins. Suppliers able to guarantee batch consistency and food-grade certification secure repeat contracts despite the commoditized nature of these grades.



By End-user Industry: Automotive Dominance Faces Industrial Challenge
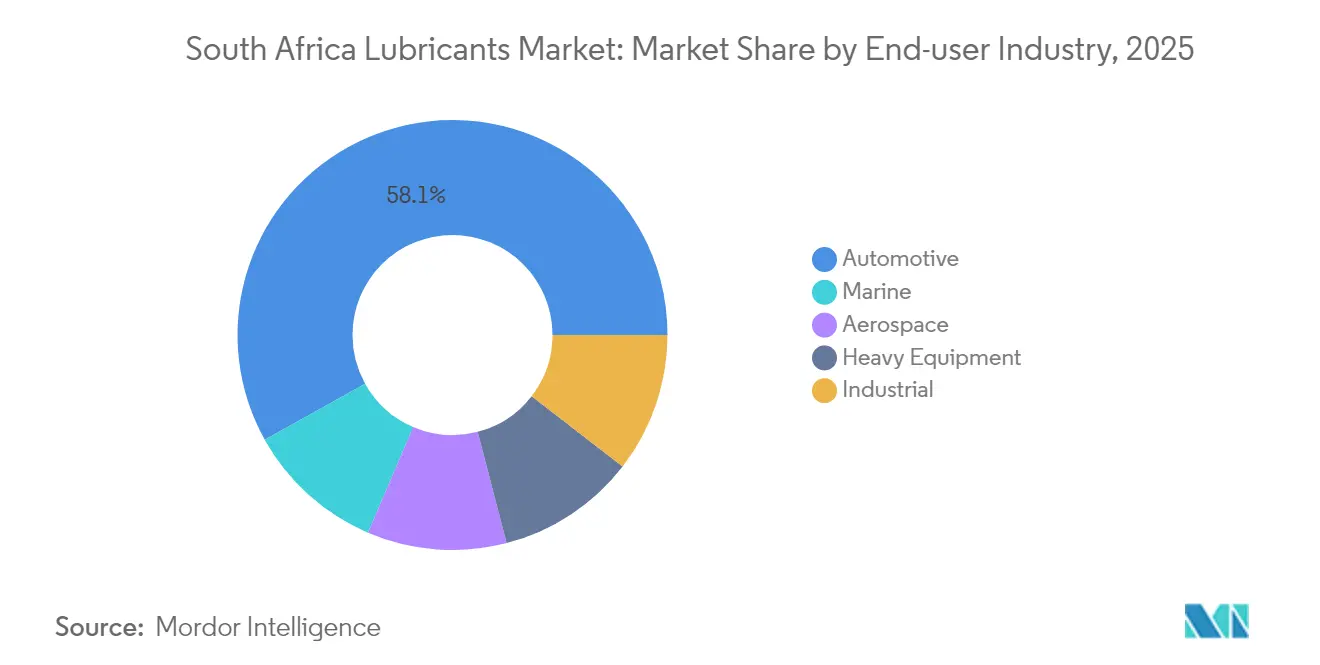
The automotive channel accounted for 58.09% of the total volume in 2025, underscoring the central role that private mobility still plays in South Africa. Dealerships, quick-lube chains, and informal workshops altogether account for millions of quarterly oil changes, keeping the South African lubricants market supplied with a predictable base load. Yet the industrial cohort—spanning mining, manufacturing, construction, agriculture, marine, and aviation—promises a faster payout, posting a 3.96% CAGR to 2031 as commodity projects revive and renewable power build-outs accelerate. Mining houses are standardizing on condition-monitoring-ready greases and fire-resistant hydraulic fluids, both of which carry higher ticket prices per liter than mainstream automotive oils.
Marine lubricants show upside because Durban and Cape Town ports sit on the key Europe-to-Asia route, obliging passing vessels to replenish trunk piston engine oils and eco-friendly stern-tube greases. The aviation niche remains comparatively small but stable, driven by South African Airways’ fleet maintenance and regional cargo expansion, which require high-performance turbine oils. Construction and agriculture add seasonality to demand profiles, with peak lubricant consumption tied to planting cycles and infrastructure funding releases. Suppliers courting industrial buyers differentiate via onsite fluid-management services, a value-adjacent angle less prevalent in mass-market automotive retail.
By Base Stock Type: Mineral Oils Face Synthetic Pressure
Cost consciousness ensures mineral-based formulations still capture 67.65% of liters sold, a reflection of both established refining-to-blending infrastructure and entrenched distributor relationships. Local supply advantages include shorter lead times and reduced hedge exposure, enabling competitive pricing in a Rand-volatile environment. Nevertheless, synthetics are forecast to post the fastest expansion, with a CAGR of 4.04% during the forecast period (2026-2031), capitalizing on their ability to extend drain intervals, slash unplanned downtime, and cut overall lubricant disposal volumes, outcomes now tracked under corporate ESG scorecards. Semi-synthetics serve as stepping-stones, allowing fleet operators to experience partial performance gains without incurring full synthetic premiums.
Ester-based hydraulics and transformer fluids demonstrate superior biodegradability and flash-point stability, factors critical in sensitive ecosystems such as coastal wind farms and underground platinum mines. Re-refined base oils (RRBO) also edge into mainstream blending, with Sasol certifying industrial gear oils that include up to 25% RRBO content without compromising OEM approvals. Over the forecast horizon, the combined synthetics and bio-based slice is expected to chip away six percentage points from conventional mineral shares in the South Africa lubricants market.
Geography Analysis
Gauteng, home to Johannesburg and Pretoria, remains the epicenter of lubricant consumption because it hosts the nation’s automotive OEM plants, primary mining headquarters, and the densest on-road vehicle fleet. Continuous freight traffic on the N1 and N3 corridors drives robust diesel engine and oil turnover, while OR Tambo International Airport anchors aviation lubricant demand. KwaZulu-Natal ranks second, buoyed by Durban’s multiproduct port that funnels marine-grade trunk piston engine oils and supports extensive petrochemical and automotive assembly activities. Load-shedding frequency in the province increases the frequency of generator-oil pull-through; however, port congestion occasionally delays additive imports, forcing local blenders to maintain higher safety margins.
The Western Cape’s lubricant requirements grow fastest among the coastal provinces, propelled by wind-energy projects across the Karoo and solar array installations in the Northern Cape that utilize specialty greases with wide operating-temperature ranges. Cape Town’s ship-repair yards further absorb niche synthetic emulsions and fire-resistant hydraulic fluids. Mining-heavy provinces—Limpopo, North West, and Northern Cape—consume large volumes of heavy-duty diesel engine oils, extreme-pressure differential gear oils, and high-dropping-point greases tailored to dusty, high-load environments. Distribution into these provinces faces logistics hurdles, including gravel-road final-mile delivery and limited storage facilities, raising landed-cost differentials versus coastal markets.
The Free State benefits from steady agricultural lubricant orders linked to maize and sunflower harvest cycles, while Sasol’s Secunda synthetic-fuel complex anchors consumption of turbine oils, compressor fluids, and specialized process oils. Eastern Cape’s automotive hub around Port Elizabeth houses Ford and Volkswagen assembly lines that issue stable tenders for metal-working fluids and pre-delivery engine fills. Local government data indicate that combined automotive and manufacturing activity in Eastern Cape will climb substantially, underpinning expansion in ancillary lubricant volumes. Across all provinces, supply-chain risk remains tied to port delays and periodic road-freight disruptions, factors that encourage distributors to maintain multi-port import strategies and inland cross-docking nodes within the South Africa lubricants market.
Regulatory Landscape
South Africa lubricant production, importing, and distribution sit within a broader petroleum and chemicals compliance umbrella led by the Department of Mineral Resources and Energy (Petroleum Products Act, 1977), with oversight implemented through technical requirements and licensing regimes. The National Regulator for Compulsory Specifications (NRCS), established under the NRCS Act (2008), administers compulsory specifications and technical regulations across automotive and chemicals-related product groupings, which functions as a gatekeeping layer for market entry and ongoing conformity in regulated product categories.
Environmental compliance is anchored by the Extended Producer Responsibility (EPR) framework under the Department of Forestry, Fisheries and the Environment, enforced since May 2021 for lubricants and related packaging. The rules require audited reporting and financed take-back systems for used oil and containers. In parallel, South Africa maintains obligations under the Basel, Rotterdam, and Stockholm conventions, shaping how hazardous substances and waste streams tied to lubricant additives, containers, and waste oil are managed across the value chain.
Value Chain Analysis
The value chain starts with base oils and additives. Local blending faces increasing import dependence for API Group II and III base oils and selected additive chemistries, while a smaller share is supplied through domestic refining and synthetic fuel value chains. Blending and packaging are concentrated around Gauteng and major logistics corridors, and products move through a layered distribution network that includes multinational brand marketers, large fuel retailers, and independent blenders and distributors such as Atlas Oil and Chemical, Strub Lubricants, CIM Lubricants, Durban Lubricants, and import-focused players like Oily SA.
Midstream storage, terminals, and road freight connect coastal ports to inland demand centers. Within the liquid fuels ecosystem, the Competition Commission granted SAPIA a conditional exemption for cooperation agreements across supply chain stages (including inbound logistics and terminal operations) through 30 June 2026. Downstream, route-to-market advantages continue to be reinforced by retail and workshop channels, while used-oil collection and recovery are organized under EPR-aligned systems. Industry-led structures such as the ROSE Foundation help coordinate collection pathways feeding into re-refining and recovery markets.
Competitive Landscape
The South Africa Lubricants market is moderately consolidated. Consolidation is reshaping competitive dynamics as multinational majors fine-tune global downstream portfolios while regional independents capitalize on divestitures. Vivo Energy’s completion of the Engen deal delivered a retail network of over 1,300 forecourts, providing the group with unmatched last-mile reach and enhancing brand visibility in both fuels and lubricants. Market entrants seeking a share must present credible EPR compliance plans, including used-oil collection partnerships, to satisfy automotive OEM procurement panels and mining tender boards.
South Africa Lubricants Industry Leaders
Astron Energy (Pty) Ltd.
Engen Petroleum
Sasol
BP p.l.c.
Shell plc
- *Disclaimer: Major Players sorted in no particular order


Market Opportunities and Future Outlook
EPR-driven circularity is creating whitespace for suppliers that can pair lubricants with verifiable used-oil and packaging take-back, audited reporting, and track-and-trace support under the EPR framework enforced since May 2021. For many fleets, mines, and industrial plants, differentiation is shifting beyond drum price toward service models that address proof-of-disposal needs, documented drain intervals, and reduced waste volumes that align with internal ESG scorecards.
Local capability additions also point to opportunities in additive localization and regional technical support. In January 2026, Chevron Oronite expanded its partnership with Azelis South Africa to begin local manufacture of PARATONE 24EX viscosity modifier in South Africa, offering a practical way to reduce lead times and currency exposure for formulations that depend on specialty additives. On the go-to-market side, FUCHS opened a new branch in Polokwane (May 2026) to strengthen logistics and technical coverage for Limpopo mining and agriculture corridors, reflecting how proximity-based service supports supplier selection in industrial provinces where uptime, condition monitoring, and specialty fluids such as hydraulics, gear oils, and greases carry higher performance requirements.
Recent Industry Developments
- June 2026: Engen Petroleum launched a new grease tubes range (including CV Joint, Wheel Bearing, and General Purpose variants) using anhydrous calcium technology. The format targets workshop convenience and cleaner application in automotive and light industrial maintenance, supporting premiumization through differentiated packaging and performance positioning.
- May 2026: FUCHS Lubricants South Africa opened a new branch in Polokwane, Limpopo, to extend logistics reach and technical support closer to mining and agricultural customers. The expansion strengthens service-led selling in northern industrial corridors where condition monitoring and faster replenishment cycles influence supplier selection.
- April 2024: Vivo Energy completed its acquisition of Engen, combining the businesses into a larger downstream platform in Southern Africa. In South Africa, the integration expanded forecourt and distribution reach, reinforcing route-to-market scale for lubricants through an enlarged retail and commercial network.


Research Methodology Framework and Report Scope
Market Definition and Coverage
This market covers finished lubricants consumed within South Africa across vehicle and industrial applications, measured at the point of local demand. We include volumes supplied through domestic production and imports, and we track them by lubricant use in typical operating conditions.
Scope exclusions: We exclude base oils sold as feedstock, additives sold as stand-alone chemicals, and fluids primarily used as fuels or process chemicals rather than lubricants.
Segmentation Overview
- By Product Type
- Automotive Engine Oil
- Industrial Engine Oil
- Transmission Fluids
- Gear Oil
- Brake Fluids
- Hydraulic Fluids
- Greases
- Process Oil (Including Rubber Process Oil & White Oil)
- Metalworking Fluids
- Turbine Oil
- Transformer Oil
- Other Product Types
- By End-user Industry
- Automotive
- Passenger Vehicles
- Commercial Vehicles
- Two-Wheelers
- Marine
- Aerospace
- Heavy Equipment
- Construction
- Mining
- Agriculture
- Industrial
- Power Generation
- Metallurgy & Metalworking
- Textiles
- Oil and Gas
- Other End-Use Industries
- Automotive
- By Base Stock Type
- Mineral Oil-Based Lubricants
- Synthetic Lubricants
- Semi-Synthetic Lubricants
- Bio-Based Lubricants
Data Sources, Market Sizing, and Validation
Desk Research
Desk research starts with building the demand picture for lubricants using public indicators that are stable year to year. We reference sources such as South African government statistics on manufacturing, mining, energy, and transport activity, customs and tariff-line trade data for lubricants, and road traffic and vehicle registration releases where available. Standards and product performance context are also cross-checked using bodies such as SAE, API, and ISO so the counted products match how lubricants are specified in real purchasing.
The desk phase is then grounded with manufacturer and distributor public materials such as annual reports, investor presentations, and press releases, which point to volumes, plant changes, and channel focus. When a data gap exists on private company scale, we use paid subscriptions for company financials and intelligence, lubricants-specific market information, and shipment-level import and export checks to avoid relying on a single-source assumption. The sources named above are illustrative, and many other public documents and datasets were reviewed to collect, verify, and clarify the final inputs.
Primary Interviews and Surveys
Primary work was used to translate the desk indicators into realistic lubricant demand and mix for South Africa, and to confirm what is actually sold into automotive, mining, agriculture, manufacturing, and power-related end uses. We spoke with participants across the value chain, including blenders, distributors, service workshops, fleet maintenance teams, and industrial plant maintenance staff. This input helped confirm pack sizes, change intervals, and the pace of product upgrading used in each end use.
Distribution of primary research fieldwork respondents
| Company type | Respondent position |
|---|---|
| Top tier: 39% | CXOs: 13% |
| Mid tier: 40% | Functional/Unit leaders: 34% |
| Smaller Players: 21% | Managers: 53% |
Market-Sizing & Forecasting
Sizing starts from a top-down demand reconstruction, where vehicle parc and utilization, industrial output signals, and lubricant change frequency are translated into liters consumed by major use cases, then filtered by typical drain intervals and product mix. Once the country total is built, it is pressure-tested with selective bottom-up checks such as sampled ASP times volume at the channel level, distributor throughput discussions, and import plus local blending availability to confirm that the totals make sense.
Key inputs used in the model include the active vehicle population by major category, freight and passenger movement trends that influence oil drain cycles, mining and manufacturing activity as proxies for industrial lubricant run time, and the split between bulk and packaged sales, since it affects how quickly pricing shifts show up. Forecasting is handled using scenario analysis anchored on macro and sector outlooks, where demand cases are adjusted based on expected maintenance intensity and the pace of higher-performance lubricant adoption. When coverage is uneven for smaller channels, we apply conservative gap-filling based on known penetration ranges, then re-check the implied per-unit consumption against interview feedback.
Data Validation & Update Cycle
Model outputs are checked against independent signals, such as implied liters per vehicle, import patterns versus local supply changes, and year-to-year shifts that should align with industrial cycles. When an outlier appears, assumptions are revisited and, if needed, we re-contact respondents to confirm whether the variance is due to timing, pricing, or a real demand change.
Before sign-off, the work goes through stepwise analyst reviews focused on unit consistency, conversion logic, and whether the inputs match the market definition. Reports are refreshed annually, and interim updates are made when material events occur such as regulatory shifts, supply disruptions, or major capacity moves. Right before delivery, a final analyst pass is done to ensure clients receive the most current view based on the latest available data.
Mordor Intelligence's South Africa Lubricants Market Market Size Compared Against Other Published Estimates
Published market sizes for South Africa lubricants can differ even when the topic label looks the same, because some studies size the market in revenue while others report volume, and because product boundaries can shift between finished lubricants and adjacent fluids. Timing also matters, since exchange rates, inflation, and swings in industrial activity can change the headline number quickly if the model is not refreshed.
By tracking unit-consistent liters first and then refreshing the price-per-liter bridge with current channel checks, Mordor Intelligence keeps the estimate tied to real consumption instead of mixing base oils, additives, or aggressive pricing assumptions into the same total.
Benchmark comparison
| Source | Market Size | Gaps in Research Methodology |
|---|---|---|
| Mordor Intelligence | USD 447.28 M (2026) | |
| Regional Consultancy A | USD 1.89 B (2026) | Reported as revenue for a broader scope that appears to combine multiple lubricant categories and pricing layers, which can inflate totals versus a consumption-led model. |
| Industry Report B | USD 420.00 M (2024) | Uses an earlier base year and a different scope label that may lean toward automotive oils, and the update timing can miss recent volume shifts and price resets. |
The spread is mainly explained by unit choice and scope boundaries, followed by how pricing is applied over time. A repeatable model that separates liters from pricing, and that keeps inclusions tight around finished lubricants sold into South Africa, makes the result easier to reconcile with observable demand signals.


Key Questions Answered in the Report
What is the projected volume for the South Africa lubricants market by 2031?
The market is expected to reach 538.26 million liters by 2031, reflecting a 3.77% CAGR.
Which product category leads demand?
Automotive engine oils account for 44.26% of 2025 volume, making them the largest product type.
Which end-user group is growing fastest?
Lubricant consumption in mining and broader industrial applications is forecast to grow at a 3.96% CAGR through 2031.
What share do mineral-based lubricants hold?
Mineral formulations captured 67.65% of 2025 volume, although synthetics are gaining ground.
How is the regulatory landscape affecting suppliers?
Extended Producer Responsibility rules raise compliance costs 2-3% as firms fund used-oil and packaging take-back programs.
Which company recently expanded blending capacity in South Africa?
FUCHS Africa doubled capacity at its Isando facility after a ZAR 218 million investment completed in 2024.
Page last updated on:


 Your data is secure and never sold or shared.


