
Electronic Nose Market Size and Share
Market Overview
| Study Period | 2020 - 2031 |
|---|---|
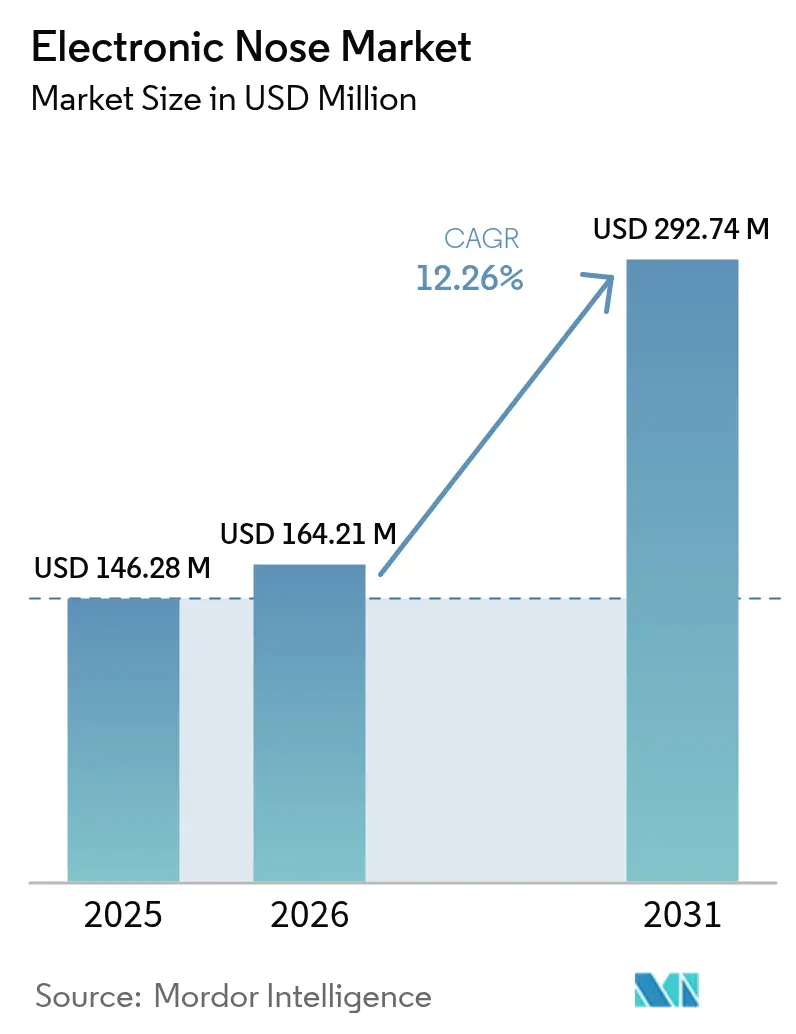
| Market Size (2026) | USD 164.21 Million |
| Market Size (2031) | USD 292.74 Million |
| Growth Rate (2026 - 2031) | 12.26 % |
| Fastest Growing Market | Asia Pacific |
| Largest Market | North America |
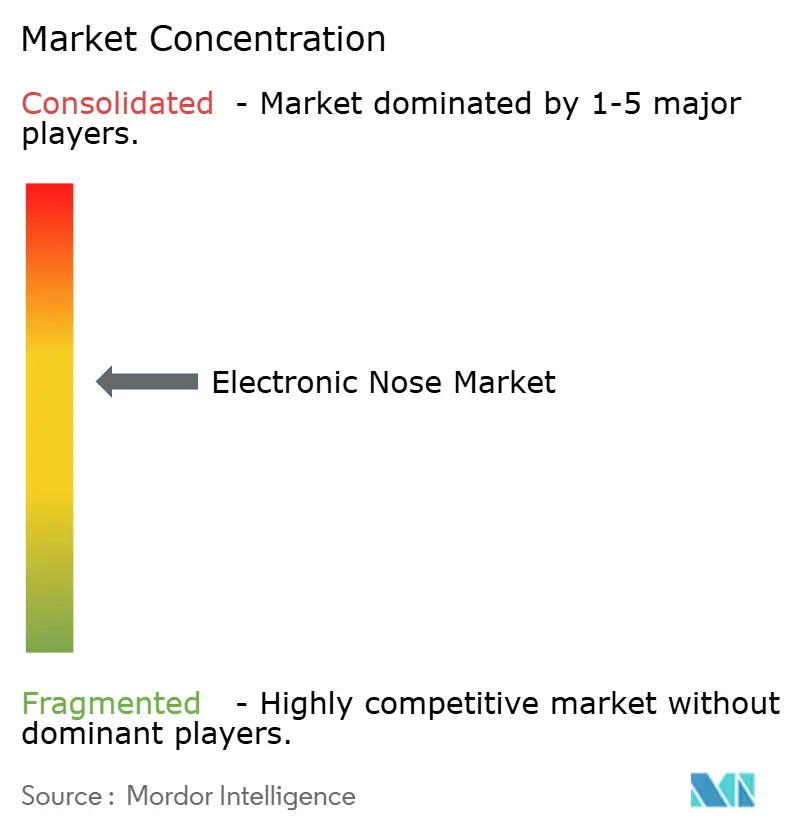
| Market Concentration | Medium |
Major Players *Disclaimer: Major Players sorted in no particular order Image © Mordor Intelligence. Reuse requires attribution under CC BY 4.0. | |
Electronic Nose Market Analysis by Mordor Intelligence
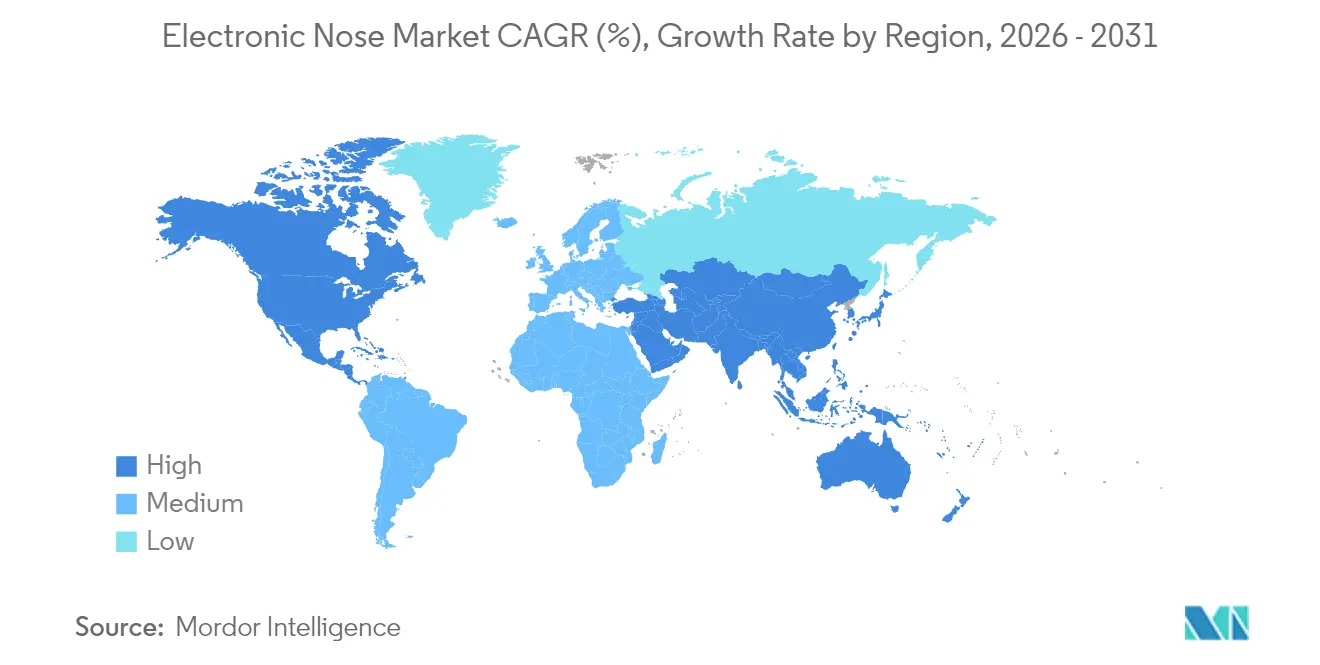
The electronic nose market size is expected to grow from USD 146.28 million in 2025 to USD 164.21 million in 2026 and is forecast to reach USD 292.74 million by 2031 at 12.26% CAGR over 2026-2031. Strong momentum arises from miniaturized MEMS sensor arrays, neuromorphic AI algorithms, and increasing deployment across healthcare, food safety, and environmental monitoring. High-speed odor detection now matches mammalian olfaction with millisecond response times, making the technology viable for real-time diagnostics. North America holds a 30.5% electronic nose market share in 2024 on the back of supportive regulatory frameworks for breath diagnostics. Meanwhile, the Asia-Pacific is the fastest-growing region at 14.0% CAGR, fueled by quality control demands in manufacturing and agriculture. Across end-user verticals, food and beverage commands 35.3% revenue while healthcare shows the highest 13.6% CAGR, driven by validated breath-based disease tests.
Key Report Takeaways
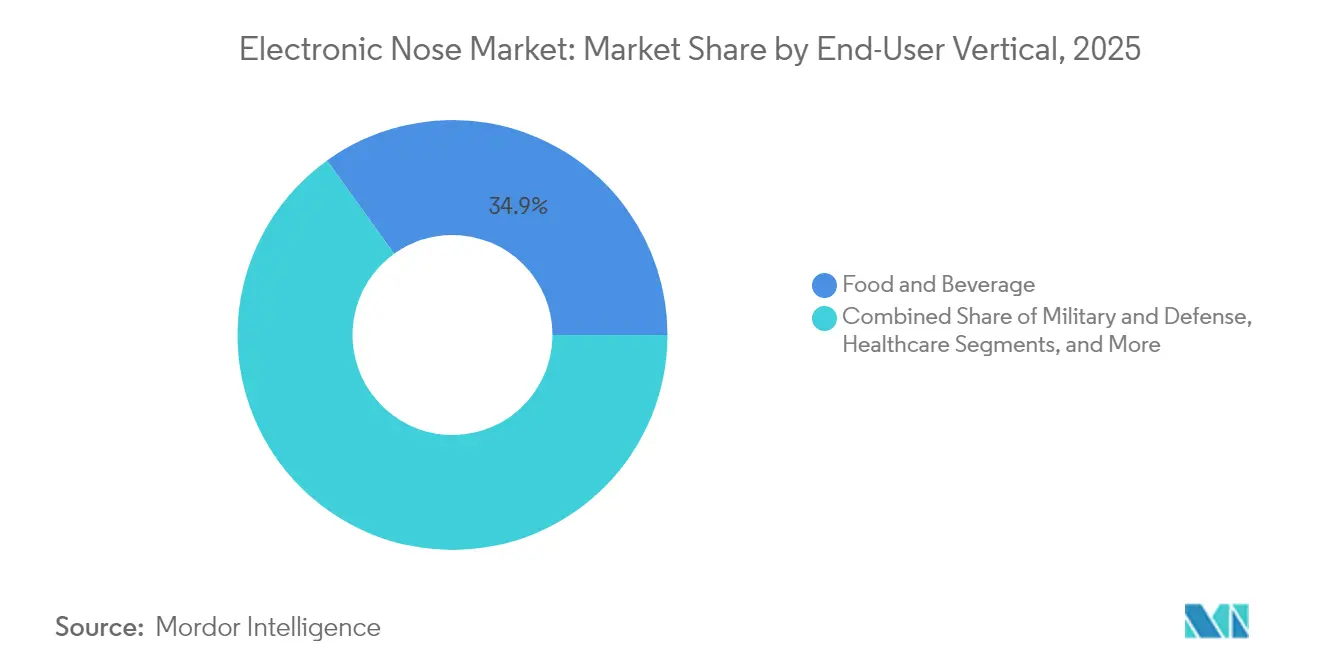
- By end-user vertical, food and beverage led with 34.92% revenue share in 2025, while healthcare is projected to advance at a 13.42% CAGR through 2031.
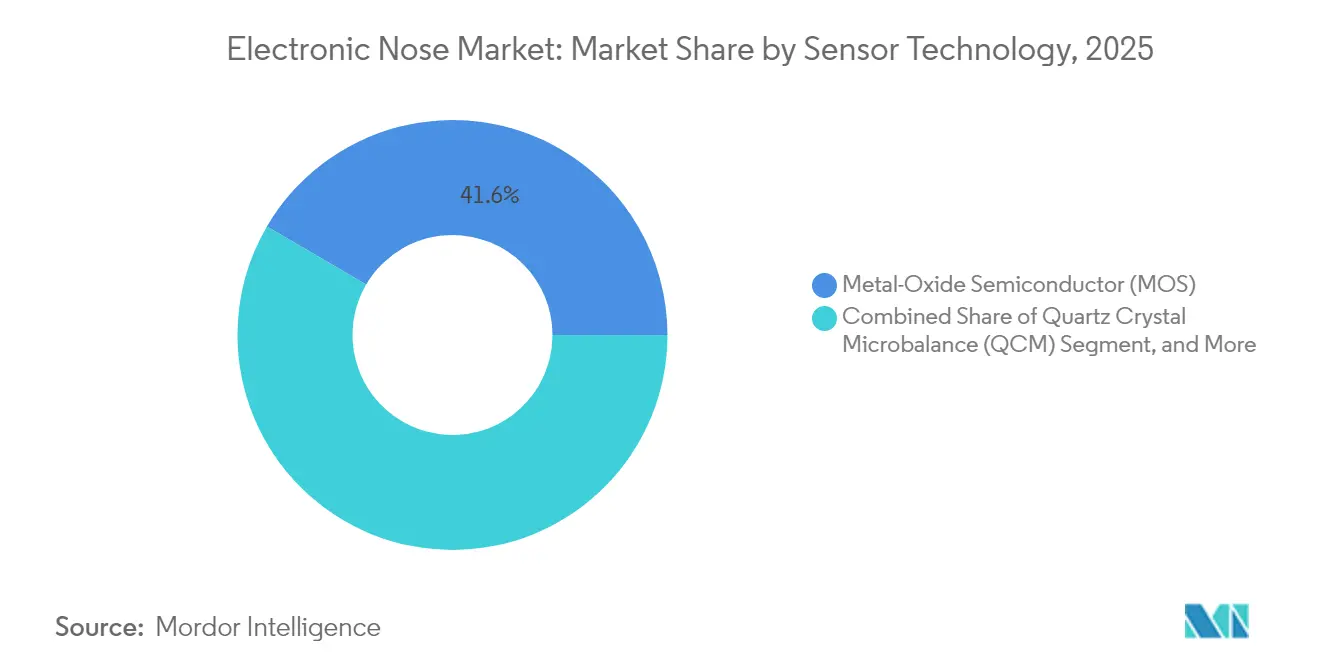
- By sensor technology, metal-oxide semiconductor arrays captured 41.58% of the electronic nose market share in 2025; field asymmetric ion mobility spectrometry is forecast to expand at a 13.68% CAGR to 2031.
- By application, quality control and shelf-life prediction accounted for a 32.18% share of the electronic nose market size in 2025, and disease diagnosis is moving forward at a 13.95% CAGR through 2031.
- By geography, North America held 30.12% revenue in 2025, whereas Asia-Pacific is tracking a 13.72% CAGR through 2031.
Note: Market size and forecast figures in this report are generated using Mordor Intelligence’s proprietary estimation framework, updated with the latest available data and insights as of 2026.
Market Trends and Insights
Driver Imapct Analysis of Electronic Nose Market*
| DRIVER | (~) % IMPACT ON CAGR FORECAST | GEOGRAPHIC RELEVANCE | IMPACT TIMELINE |
|---|---|---|---|
| Rapid miniaturization and cost decline of MEMS sensor arrays | +2.1% | Global (manufacturing centred in Asia-Pacific) | Medium term (2-4 years) |
| Integration of neuromorphic AI for real-time pattern recognition | +1.8% | North America and Europe leadership; Asia-Pacific adoption rising | Long term (≥ 4 years) |
| Heightened bio-security mandates in Agri-exporting nations | +1.4% | Global with focus on top exporters | Short term (≤ 2 years) |
| VOC-based disease diagnostics gaining regulatory fast-track | +1.7% | North America and Europe; global expansion | Medium term (2-4 years) |
| Odor-as-a-service platforms unlocking recurring revenue | +1.2% | Early uptake in developed markets | Long term (≥ 4 years) |
| Edge-to-cloud analytics lowering total cost of ownership | +1.5% | Global IoT environments | Medium term (2-4 years) |
| Source: Mordor Intelligence | |||


Rapid Miniaturization and Cost Decline of MEMS Sensor Arrays
MEMS-based systems now fit on credit-card footprints while maintaining >95% detection accuracy. Standardized semiconductor packaging and expanded wafer fabs in China, South Korea, and Taiwan have shaved 40-60% off unit costs since 2022. Tungsten-trioxide nanorod heaters enable 0.5–1 s identification, far outpacing legacy 10–30 s platforms.[1]Source: Nannan Zhang, “Smart E-Nose Uses Self-Heating Temperature Modulation,” phys.orgDuty-cycling strategies cut power draw to 160 µW at 250 °C, opening battery-operated and wearable use cases. The net result: entry barriers fall and the electronic nose market penetrates consumer electronics, telehealth, and smart-home ecosystems.
Integration of Neuromorphic AI for Real-Time Pattern Recognition
Spiking neural networks modeled on the mammalian olfactory bulb accomplish >97% classification accuracy with <16 ms latency on 1 mW ASICs.[2]Source: Anup Vanarse et al., “Application of Brain-Inspired Spiking Neural Networks,” mdpi.com Large-language-model extensions fuse chemical signatures with contextual metadata, sharpening selectivity for overlapping VOC profiles. Edge implementations trim cloud traffic, critical for hazardous-gas alerts in mining and process plants. Online active-learning loops counter sensor drift, keeping long-term accuracy above 90% without manual recalibration. These breakthroughs underpin the next wave of autonomous odor-analysis devices across defense, healthcare, and industrial safety.
Heightened Bio-security Mandates in Agri-Exporting Nations
Washington’s FY 2025 Chemical and Biological Defense Program budgets USD 1.66 billion toward advanced detection technologies.[3]Source: Office of the Under Secretary of Defense, “FY 2025 Justification Book,” defense.gov Electronic nose systems detect bark-beetle infestations at 95% accuracy, preventing multimillion-dollar timber losses in Europe and North America. Grain-storage operators deploy VOC sensors to isolate insect outbreaks and optimize fumigation timing. Export certificates in China, Brazil, and Australia increasingly require continuous olfactory monitoring to avoid trade disruptions. Integration with satellite crop-health data yields holistic bio-security dashboards, expanding the electronic nose market in smart-agriculture ecosystems.
VOC-Based Disease Diagnostics Gaining Regulatory Fast-Track
The FDA’s emergency authorizations for COVID-19 breath tests established precedent for expedited VOC-diagnostic approvals.[4]Source: Carrie Arnold, “Diagnostics to Take Your Breath Away,” nature.com Clinical trials on >10,000 patients achieved 93-98% accuracy in lung-cancer detection via breath, equaling gold-standard imaging. The NIOX platform’s clearance for asthma therapy monitoring further signals regulator openness to non-invasive olfactory tools. Governments in the EU, Japan, and Israel draft specific performance benchmarks, cutting time-to-market for medical device makers. Healthcare providers see cost reductions and patient-experience benefits, spurring hospital adoption and driving electronic nose market growth.
Restraints Impact Analysis of Electronic Nose Market*
| RESTRAINTS | (~) % IMPACT ON CAGR FORECAST | GEOGRAPHIC RELEVANCE | IMPACT TIMELINE |
|---|---|---|---|
| Sensor drift and calibration complexity in harsh environments | -1.9% | Global | Short term (≤ 2 years) |
| Data-privacy concerns for breath-biopsy health records | -1.3% | North America and Europe | Medium term (2-4 years) |
| Absence of harmonised global odour emission standards | -2.2% | Global | Long term (≥ 4 years) |
| Limited battery life in portable e-nose devices | -2.5% | Global | Medium term (2-4 years) |
| Source: Mordor Intelligence | |||
Sensor Drift and Calibration Complexity in Harsh Environments
Metal-oxide sensors exhibit pronounced baseline drift under humidity and temperature swings, forcing quarterly recalibration that inflates operating costs.[5]Source: Anil Kumar, “Correction Model for Metal Oxide Sensor Drift,” ncbi.nlm.nih.gov Seven-year field studies confirm performance erosion necessitating sensor replacement in refinery stacks and landfills. Wavelet-decomposition and machine-learning compensation reach 100% identification over one-year horizons but demand embedded computing power, raising the bill of materials. While one-class drift schemes cut calibration samples by 70%, they still rely on controlled training cycles. Industries requiring 24/7 uptime, such as petrochemical processing, view these maintenance burdens as adoption barriers.
Data-Privacy Concerns for Breath-Biopsy Health Records
Breath analysis outputs are classified as protected health information under HIPAA and GDPR, obligating encryption, consent tracing, and localized data storage. Hospital CIOs cite integration challenges with electronic medical record systems that were never designed for high-frequency chemical fingerprints. Cross-border data flows complicate clinical trials for multinational device makers, adding legal overhead. Cybersecurity audits now form part of procurement checklists, elongating sales cycles. These factors temper short-term healthcare deployments, although emerging privacy-preserving federated-learning frameworks promise relief.
*Our forecasts treat driver/restraint impacts as directional, not additive. The impact forecasts reflect baseline growth, mix effects, and variable interactions.
Electronic Nose Market Segment Analysis
By End-user Vertical:
Healthcare Drives Future GrowthHealthcare is projected to post a 13.42% CAGR through 2031. Breath-based oncology screening and asthma-monitoring devices drive demand, supported by favorable reimbursement pilots in the United States and Germany. Food and beverage remains the largest vertical, leveraging e-noses for meat freshness, wine oxidation, and dairy adulteration checks. Adoption spreads from processing plants to quick-service restaurants, integrating cloud dashboards for daily product audits.
Military, defense, and homeland security made up 9.05% revenue in 2025, propelled by toxic-gas detection requirements within NATO and Asia-Pacific defense modernization. Waste-management operators deploy odor sensors to comply with landfill emission caps in EU member states. Industrial safety and HVAC companies embed arrays in ventilation systems for 24/7 CO₂ and VOC tracking, reducing sick-building complaints. Overall, healthcare’s elevated CAGR positions it to eclipse food and beverage revenue post-2030.


By Sensor Technology:
FAIMS Challenges MOS DominanceMetal-oxide arrays held a 41.58% electronic nose market share in 2025 on account of proven reliability and sub-USD 1 per die pricing. Hybrid stacks incorporating tin-oxide and zinc-oxide nanoparticles deliver ppb-level sensitivity for formaldehyde and ammonia monitoring. Field asymmetric ion mobility spectrometry clocks a 13.68% CAGR as laboratories adopt it for high-selectivity breath diagnostics and explosive detection.
Quartz crystal microbalance sensors dominate moisture-sensitive applications like pharmaceutical blister-pack integrity, while conducting polymers attract wearables designers due to room-temperature operation. Emerging optical and photo-ionization detectors serve refinery and offshore platforms where intrinsic safety is mandatory. Machine-learning-driven sensor fusion tightens classification accuracy to 99% in complex odor matrices, reinforcing FAIMS' appeal in precision medicine.
By Application:
Disease Diagnosis Transforms Market DynamicsQuality control and shelf-life prediction 32.18% of the electronic nose market size in 2025, serving meat, dairy, spirits, and cosmetics producers. Cloud-based dashboards enable real-time pass/fail flags that sync with MES systems. Disease diagnosis, currently 10.62% of revenue, will expand at a 13.95% CAGR as clinical validation stacks up for lung cancer, COPD, and cystic fibrosis.
Hazardous-gas detection remains a core industrial safety segment with 11.67% revenue, fueled by stricter methane-emissions rules in North America and Europe. Indoor-air-quality monitoring benefits from the post-pandemic emphasis on ventilation and workplace wellness. Research and academic testing increase steadily as universities secure grants to explore VOC biomarkers for Alzheimer’s and sepsis.
Geography Analysis
North America Electronic Nose Market
North America generated 30.12% of the electronic nose market, underpinned by NIH grants and early FDA clearances for breath diagnostics. Defense and homeland-security spending on chemical-threat detection further stimulates demand. Academic-industry collaborations at institutions such as Stanford and MIT accelerate new-product pipelines.
APAC Electronic Nose Market
Asia-Pacific is projected to clock the fastest 13.72% CAGR as China, Japan, and India digitize food-supply chains and smart-factory lines. Semiconductor manufacturing hubs in Taiwan and South Korea offer cost-effective fabs for MEMS die, lowering regional ASPs. Local start-ups in Shenzhen and Bengaluru use edge AI to tailor low-cost modules for curry freshness, rice-wine quality, and urban air pollution use cases.
EMEA and South America Electronic Nose Market
Europe is sustained by EN 13725:2022 odor-emission enforcement that obliges industrial sites to deploy continuous monitoring. The region’s agri-exporters integrate e-noses in bio-security protocols to protect trade with the Middle East and Asia. In South America and the Middle East, and Africa, the demand for electronic nose is driven by agricultural export inspection and oil-and-gas methane detection respectively, albeit from a lower base.

Regulatory Landscape
Electronic nose systems operate under sector-specific regulation rather than a single global framework. In environmental monitoring, deployments in Europe often follow broader compliance expectations for automatic measuring systems and quality assurance, including EN 14181:2014 and EN 15267:2009. Odor monitoring and testing methodologies are further addressed through engineering guidance such as VDI/VDE 3518-3:2018 for odor-related measurements using electronic noses. For indoor air and building applications, ISO methods such as ISO 16000-29:2014 provide test approaches relevant to VOC detector performance, shaping procurement requirements for IAQ and workplace monitoring programs.
In healthcare and breath diagnostics, regulatory and privacy requirements affect both product development and data handling. Breath analysis outputs are treated as protected health information under frameworks such as HIPAA and GDPR, consistent with the market adoption constraints described in this report, and FDA emergency authorizations for COVID-19 breath tests have set precedent for expedited pathways for VOC-based diagnostics. In food and beverage quality and safety, acceptance depends on demonstrating equivalence and reproducibility relative to established food safety criteria overseen by agencies such as the FDA and EFSA. This reinforces the need for standardized data acquisition, validation, and calibration practices before routine use expands beyond human sensory panels.
Value Chain Analysis
The electronic nose value chain begins with upstream materials and components, including metal-oxide, conducting polymer, QCM, and FAIMS-related sensor elements, along with MEMS packaging and micro-heaters that influence performance and power draw. Midstream players design and assemble sensor arrays, sampling modules, and embedded electronics, then pair them with pattern-recognition software and cloud or edge analytics. Differentiation has shifted toward AI training, sensor-fusion, and drift-compensation workflows. Calibration gases, reference methods, and periodic field services also remain key inputs, since drift and environmental variability directly affect total cost of ownership.
Downstream, system integrators and automation partners embed e-nose modules into factory systems, instruments, and monitoring networks for end users across food processing, healthcare, industrial safety, waste management, and defense. The value chain increasingly includes hardware-plus-software subscription models (odor-as-a-service / SmellTech-as-a-Service), where recurring revenue links to model updates and remote monitoring. Recent partner-led scaling shows this approach in practice, with Ainos working with ASE Technology Holding for backend semiconductor facilities and with industrial computing and automation partners such as NEXCOM and Kenmec, reflecting how adoption often depends on integration into existing smart-factory edge infrastructure rather than standalone device sales.
Competitive Landscape
Market fragmentation remains moderate: the top five vendors. MSA Safety fortified its position with the USD 200 million takeover of M&C TechGroup, bolstering process-gas analytics. Owlstone Medical secured USD 2.3 million from the Cystic Fibrosis Foundation to accelerate breath-based pathogen tests, highlighting investor appetite for niche healthcare platforms.
SICK transferred 800 employees to a joint venture with Endress+Hauser to leverage shared gas-analysis IP for refinery and chemical customers. Envirosuite drew a USD 10 million minority stake from Hitachi Construction Machinery to merge odor-monitoring with ESG mining platforms. Sensirion’s methane-monitor partnerships with Intero – The Sniffers and Sensible EDP demonstrate targeted vertical solutions.
Start-ups such as Plasmion and Aryballe specialize in FAIMS and silicon photonics, respectively, pursuing OEM licensing rather than end-product sales. Large tech firms experiment with odor sensing for mixed-reality and autonomous-vehicle cabins, though still at research and development stages. Overall, value migrates toward software analytics and application-specific customization rather than commodity hardware.
Electronic Nose Industry Leaders
Alpha MOS SA
Owlstone Medical Ltd .
Airsense Analytics GmbH
Aryballe Technologies SAS
Envirosuite Ltd.
- *Disclaimer: Major Players sorted in no particular order
Electronic Nose Market Companies Covered in this Report
- Alpha MOS SA
- Electronic Sensor Technology Inc.
- Plasmion GmbH
- Envirosuite Ltd.
- The eNose Company BV
- Airsense Analytics GmbH
- Sensigent LLC
- Common Invent BV
- E-Nose Pty Ltd.
- Owlstone Medical Ltd.
- Smart Nanotubes Technologies GmbH
- Scentroid Inc.
- Oizom Instruments Pvt Ltd. (Odosense)

Market Opportunities and Future Outlook
Food quality, spoilage detection, and allergen screening remain a commercialization white space because they tie clear operational pain points to high-throughput sensing at the edge. In June 2026, University of California, Berkeley researchers reported a 16-sensor electronic nose array that classified foods, including fresh and spoiled dairy and meat, and detected allergens such as walnuts and peanuts with 92.6% accuracy. This reinforces a pathway from lab prototypes to in-line or consumer-adjacent screening, where current practice often relies on sampling, lab testing, or subjective checks. The opportunity supports continuous monitoring on processing lines, cold-chain checkpoints, and smart appliances, but it depends on vendors hardening solutions against complex background odors and establishing validation protocols.
Healthcare opportunity centers on non-invasive VOC diagnostics that reduce friction versus imaging or invasive sampling, but it is constrained by privacy, data governance, and regulator-aligned performance benchmarks. Scientific work continues to expand the biomarker map, and in July 2026, Scientific Reports described feasibility for metal-oxide electronic noses to differentiate bacterial species in biofilm-promoting blood cultures, with 100.0% accuracy for species with distinct volatile signatures. That points to use cases such as rapid triage support and therapy guidance where turnaround time matters. Across food and medical applications, the main unmet needs concentrate on standardized data acquisition and model validation, drift-resilient operation in uncontrolled environments, and integrated edge-to-cloud workflows that keep protected datasets compliant while still enabling continuous model improvement.
Recent Industry Developments in Electronic Nose Market
- June 2026: AIRSENSE Analytics GmbH announced a collaboration with Proengin to integrate AIRSENSE IMS technology into Proengin systems, highlighted around Eurosatory 2026. The move enhances interoperability in CBRNe detection stacks, supporting wider field deployment where procurement favors integrated platforms over standalone sensors.
- October 2025: Owlstone Medical won an award of up to USD 49.1 million from ARPA-H for the POSEIDON program to develop at-home multi-cancer early detection tests. This funding accelerates scale-up for breath-based VOC analytics and raises the bar for clinical validation, manufacturing readiness, and secure data workflows in breath diagnostics.
- September 2024: Owlstone Medical entered a five-year Research Collaboration Agreement with the US FDA Center for Devices and Radiological Health (CDRH) to develop methods for identifying volatile organic compounds in breath. The collaboration ties tool development to regulatory science, helping define measurement and validation approaches that can streamline future submissions for breath-based devices.


Electronic Nose Market Report Scope and Research Methodology
Market Definition and Coverage
For this study, the electronic nose market is defined as revenue generated from instruments and systems that use sensor arrays and pattern recognition to detect, classify, and monitor odors or volatile compounds in real use settings.
Scope exclusions: We exclude general-purpose single gas detectors and standalone lab sensors that are not packaged and sold as an electronic nose solution.
Segments Covered in This Report
- By End-user Vertical
- Military and Defence
- Healthcare
- Food and Beverage
- Waste Management (Environmental Monitoring)
- Industrial Safety and HVAC
- By Sensor Technology
- Metal-Oxide Semiconductor (MOS)
- Quartz Crystal Microbalance (QCM)
- Field Asymmetric Ion Mobility Spectrometry (FAIMS)
- Conducting Polymer
- Optical and Photo-Ionisation
- By Application
- Disease Diagnosis (Breath Analysis)
- Quality Control and Shelf-life Prediction
- Hazardous Gas Detection
- Indoor Air Quality Monitoring
- Research and Academic Testing
- By Geography
- North America
- United States
- Canada
- Mexico
- South America
- Brazil
- Argentina
- Rest of South America
- Europe
- Germany
- United Kingdom
- France
- Rest of Europe
- Asia-Pacific
- China
- Japan
- India
- South Korea
- South-East Asia
- Rest of Asia-Pacific
- Middle East and Africa
- Middle East
- Saudi Arabia
- United Arab Emirates
- Rest of Middle East
- Africa
- South Africa
- Egypt
- Rest of Africa
- Middle East
- North America
Data Sources, Market Sizing, and Validation
Desk Research
Desk work started by mapping how electronic nose solutions are built and sold, which helped us keep the scope consistent across end uses like food quality checks, healthcare screening, and environmental monitoring. We pulled foundational context from public sources such as the US FDA (for medical device references where relevant), the US EPA (air and VOC monitoring context), Eurostat, UN Comtrade, and the World Bank for macro indicators that influence industrial and lab spending.
We also reviewed product literature, patents, peer-reviewed articles on sensor technologies like MOS and QCM, plus company filings and investor presentations to understand pricing ranges and deployment patterns. When needed, we used paid subscriptions for company financials and intelligence, news and financials, patent databases, and import and export shipment-level checks to validate supply signals and timing. The sources listed here are illustrative only, and many other public documents and datasets were also used to cross-check and clarify inputs.
Primary Interviews and Surveys
Primary work focused on interviews and short surveys with manufacturers, distributors, system integrators, lab users, and end users in healthcare, food processing, and environmental testing. For a global market like this, we spoke across APAC, EMEA, and the Americas so adoption pace, replacement cycles, and average selling price could be adjusted to local buying behavior and procurement timing.
Distribution of primary research fieldwork respondents
| Company type | Respondent position | Region |
|---|---|---|
| Top tier: 26% | CXOs: 13% | APAC: 46% |
| Mid tier: 60% | Functional/Unit leaders: 32% | EMEA: 32% |
| Smaller Players: 14% | Managers: 55% | Americas: 22% |
Market-Sizing & Forecasting
Sizing was built using a top-down approach where electronics and sensing demand signals are reconstructed into an addressable pool for electronic nose solutions, then filtered by adoption in key end uses. To keep the result grounded, we corroborated totals using selective bottom-up approximations like sampled unit volumes by application, channel checks on typical deal sizes, and price band validation for portable versus embedded systems.
A few practical inputs that shaped the model include adoption in food quality control lines, breath and disease-screening pilots in healthcare settings, regulatory pull for air and VOC monitoring, average selling price progression by sensor technology, and replacement and calibration cycles that drive repeat purchases. Where unit signals were patchy in smaller countries, gaps were handled using proxy indicators such as lab infrastructure spend and industrial production mix, followed by expert review.
For forecasting, scenario analysis was used so that faster or slower adoption could be tested against the same demand drivers, and then the final path was selected after aligning with what interviewees expected for budgets and validation timelines. The output is checked for logical year-to-year movement, then converted into USD using consistent currency timing for the modeled year.
Data Validation & Update Cycle
Outputs are validated by comparing the modeled totals with independent signals such as shipment and trade direction, public budget trends in health and environmental monitoring, and the expected revenue capacity implied by active solution providers. When an outlier shows up, assumptions are revisited, and we re-contact select respondents to confirm whether the change is real or a data mismatch.
Before sign-off, the model goes through multi-step internal review so definitions, conversion logic, and growth drivers stay consistent across sections. Reports are refreshed annually, and interim updates are made when there are material events like major regulatory shifts or sudden changes in end-market spending. Right before delivery, we run a final data pass so clients receive the most current view available.
Mordor Intelligence's Electronic Nose Market Size Compared Against Other Published Estimates
Published numbers for the electronic nose market can look far apart because the scope boundary is not always the same, and the base year and currency timing also vary by publisher. Differences can also come from whether an estimate assumes faster adoption in healthcare or anchors more on industrial quality control.
The table shows a wide spread mainly because some sources appear to fold broader adjacent sensing categories into the same bucket, and the pricing and volume build can be based on different assumptions for replacement cycles. In Mordor Intelligence's model, only electronic nose systems sold as odor or VOC pattern-recognition solutions are counted, and general single-gas detection equipment is not included, which keeps the total closer to the definable demand pool.
Benchmark comparison
| Source | Market Size | Gaps in Research Methodology |
|---|---|---|
| Mordor Intelligence | USD 164.21 M (2026) | |
| Industry Consultancy A | USD 1.10 B (2024) | Likely uses a broader definition that blends electronic nose with wider digital scent or sensing device revenues, and may apply higher assumed ASPs without separating embedded pilots from scaled deployments. |
| Research Publisher B | USD 146.48 M (2025) | Uses a different base year and forecast window, and may treat healthcare adoption timing and regional weighting differently, which shifts the current-year size even when the core product category looks similar. |
Looking across the three values, the key takeaway is that scope and timing choices move the market size more than the math does. Our approach stays traceable to a clear product definition, practical adoption indicators, and repeated checks against real buying patterns, which helps keep the estimate usable for planning.


Key Questions Answered in the Report
How large is the electronic nose market in 2026?
The electronic nose market size stands at USD 164.21 million in 2026.
What CAGR is projected for electronic nose solutions to 2031?
A 12.26% CAGR is forecast from 2026 to 2031.
Which region shows the fastest uptake of electronic nose systems?
Asia-Pacific is growing fastest at 13.72% CAGR due to manufacturing and agricultural applications.
Which sensor technology is gaining on MOS arrays?
Field asymmetric ion mobility spectrometry is advancing at a 13.68% CAGR, challenging MOS dominance.
Page last updated on:


 Your data is secure and never sold or shared.


