E-Mountain Bike Market Size and Share
Market Overview
| Study Period | 2020 - 2031 |
|---|---|
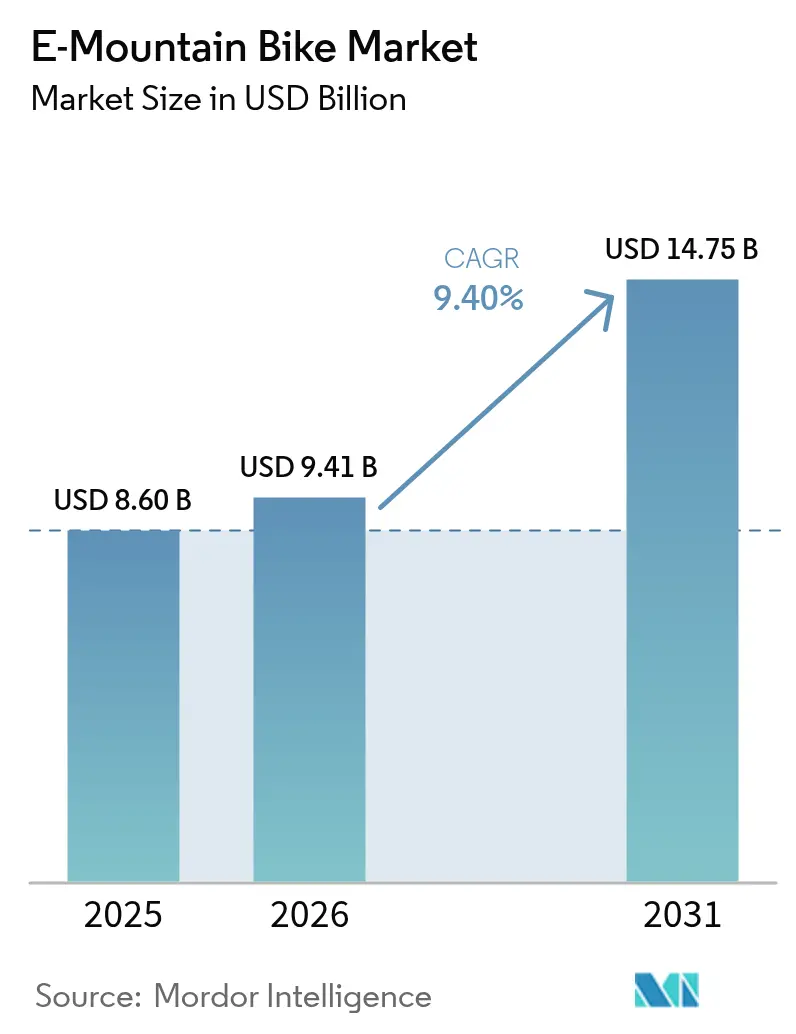
| Market Size (2026) | USD 9.41 Billion |
| Market Size (2031) | USD 14.75 Billion |
| Growth Rate (2026 - 2031) | 9.40% CAGR |
| Fastest Growing Market | Asia Pacific |
| Largest Market | Europe |
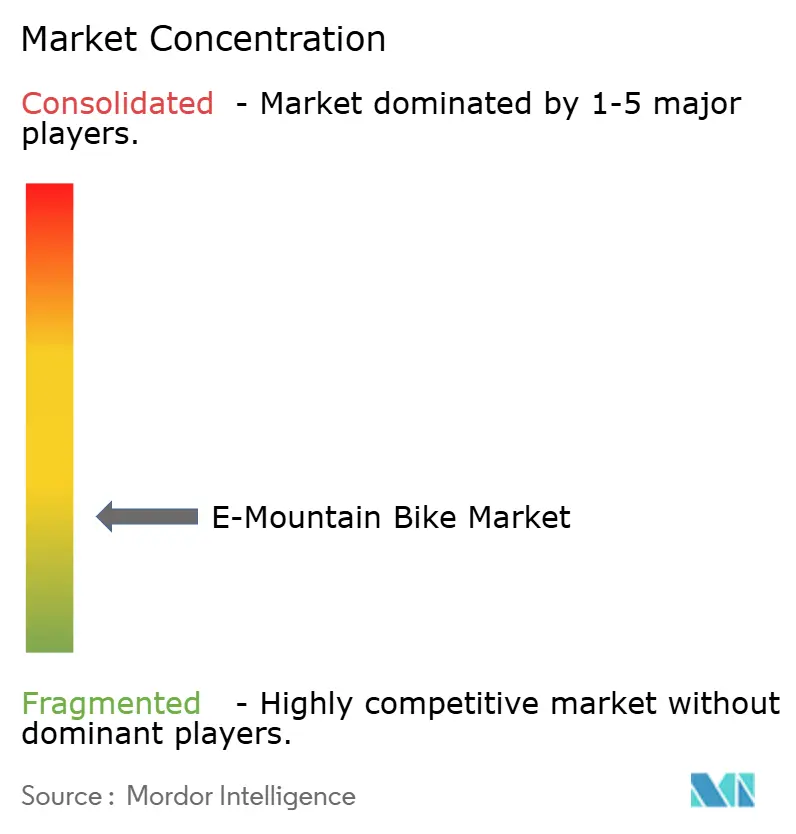
| Market Concentration | Low |
Major Players *Disclaimer: Major Players sorted in no particular order Image © Mordor Intelligence. Reuse requires attribution under CC BY 4.0. | |
E-Mountain Bike Market Analysis by Mordor Intelligence
E-Mountain Bike market size in 2026 is estimated at USD 9.41 billion, growing from 2025 value of USD 8.60 billion with 2031 projections showing USD 14.75 billion, growing at 9.4% CAGR over 2026-2031. The E-Mountain Bike market benefits from a confluence of lightweight high-capacity lithium-ion packs, improved motor efficiency, and smart connectivity that collectively extend real-world range, ease rider concerns over steep-terrain performance, and enable predictive maintenance services. Subscription and leasing schemes, now scaling across key urban-adjacent regions, are lowering upfront cost hurdles, broadening the addressable base, and realigning revenue flows toward recurring service income streams. Competitive dynamics remain fragmented as bicycle incumbents, automotive suppliers, and digital-first entrants pursue distinct go-to-market strategies that range from dealer-centric servicing to direct-to-consumer bundles featuring IoT software add-ons.
Key Report Takeaways
- By propulsion type, pedal-assisted systems held 71.62% of the E-Mountain Bike market share in 2025; dual-mode systems are projected to rise at a 10.05% CAGR through 2031.
- By application, leisure and adventure captured 46.78% of the E-Mountain Bike market share in 2025, while tourism rentals are set to climb at an 10.92% CAGR to 2031.
- By battery chemistry, lithium-ion packs commanded 91.02% of the E-Mountain Bike market share in 2025; solid-state and lead-acid alternatives will advance at a 15.2% CAGR during the outlook period.
- By power output, the 250-500 W class accounted for 58.74% of the E-Mountain Bike market share in 2025; systems above 500 W will grow at 9.72% CAGR amid rising demand for steep-grade assistance.
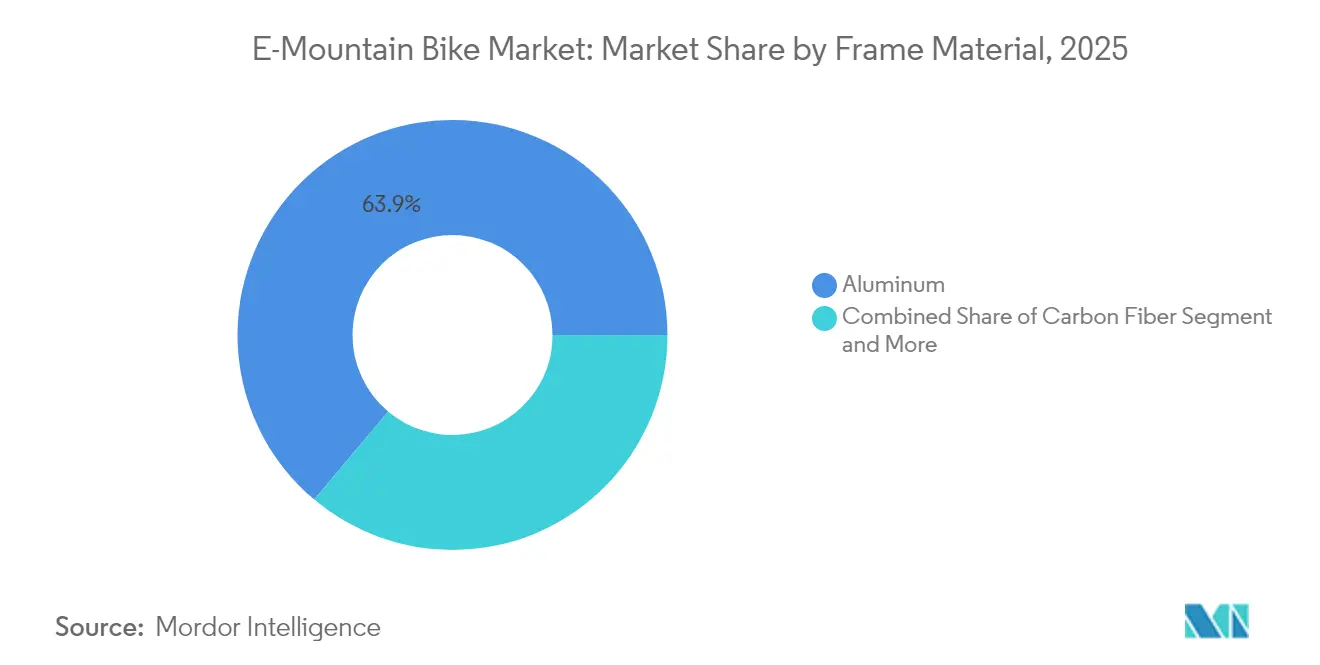
- By frame material, aluminum dominated at 63.88% of the E-Mountain Bike market share in 2025, whereas carbon fiber variants are forecast to accelerate at a 10.63% CAGR through 2031.
- By distribution channel, specialty bike stores retained 45.08% of the E-Mountain Bike market share in 2025, but subscription and leasing platforms are expected to expand at an 11.18% CAGR through the end of the decade.
- By geography, Europe led with 42.87% of the E-Mountain Bike market share in 2025; Asia-Pacific is on track for a 10.32% CAGR through 2031.
Note: Market size and forecast figures in this report are generated using Mordor Intelligence’s proprietary estimation framework, updated with the latest available data and insights as of 2026.
Market Trends and Insights
Drivers Impact Analysis of E-Mountain Bike Market*
| Driver | (~) % Impact on CAGR Forecast | Geographic Relevance | Impact Timeline |
|---|---|---|---|
| Lightweight, High-Capacity Batteries Advance | +2.1% | Global | Long term (≥4 years) |
| Growing Adventure Tourism Popularity | +1.8% | Europe and North America | Medium term (2-4 years) |
| Incentives and Subsidies for E-Mobility | +1.5% | Europe and North America; emerging in Asia-Pacific | Short term (≤2 years) |
| Subscription Models Lowering Upfront Costs | +1.3% | Urban-adjacent regions in Europe and North America | Medium term (2-4 years) |
| IoT and Smart Connectivity Integrated | +1.2% | Europe and North America; expanding in Asia-Pacific | Medium term (2-4 years) |
| Resort Fleets Deploying E-MTBs | +0.9% | Alpine and Rockies tourism hubs | Short term (≤2 years) |
| Source: Mordor Intelligence | |||
Advancements in Lightweight High-Capacity Li-ion Batteries
Energy densities now exceed 300 Wh/kg while pack mass falls, letting riders climb farther without handling compromises. Fast-charge routines reach 75% in 90 minutes, critical for rental fleets that rely on quick turnover. Predictive battery-management software factors gradient and cadence to stretch range by 15-20% versus prior models. The technology reshapes marketing from watt-hours to “vertical meters per charge,” a user-friendly metric that resonates with newcomers. Higher capacities unlock multi-day hut trips once reserved for elite athletes. This chemistry evolution underpins premium pricing and broadens use cases.
Rising Popularity of Adventure Sports and Eco-Tourism
Adventure tourism blends sustainability goals with adrenaline appeal, turning e-MTBs into gateway products for consumers who once avoided steep alpine trails. Alpine resorts that added e-MTB rentals recorded summer visitation rises, creating new revenue streams outside ski season [1]“E-Bike Rental Boosts Alpine Summer Traffic,” Eurobike, eurobike.com. Aging populations welcome pedal assistance that preserves stamina without sacrificing scenery. National tourism boards now highlight e-MTB loops alongside hiking and skiing, repositioning the bike as core infrastructure rather than an accessory. Guided package deals that bundle equipment, lodging, and lift transport lift the average guest's spend. These synergies elevate demand elasticity and reinforce long-run volume growth.
Government Incentives and Subsidies for E-Mobility
Policy makers increasingly treat e-bikes as transport assets, widening rebate programs from commuters to off-road categories. Several states in the United States rebate up to USD 1,500 per e-MTB, trimming 20-30% off entry-level prices. The EU’s 2025 battery rules reward brands that certify recycled content, nudging procurement toward transparent suppliers. Trail-usage data flowing from connected fleets fit smart-city dashboards, helping agencies justify funding. Manufacturers able to audit supply chains win asymmetric advantages during tender bids. Collectively, incentives accelerate adoption and pull forward demand.
Subscription-Based Ownership Models Lowering Upfront Cost
Monthly plans bundle hardware, servicing, and theft insurance, spreading a significant outlay into manageable fees. Pilot programs in Amsterdam and Denver report a significant number of subscribers upgrading to higher-spec models within 18 months, lifting lifetime value. Digital onboarding apps schedule tune-ups automatically, directing traffic to partner workshops and stabilizing dealer revenue. Flexible swap-out clauses ease anxiety over rapid tech cycles, a barrier that previously stalled early adopters. Finance partners bundle carbon-offset certificates to appeal to environmentally conscious riders. By lowering the cash hurdle, subscriptions unlock price-sensitive demand segments.
Restraints Impact Analysis of E-Mountain Bike Market*
| Restraint | (~) % Impact on CAGR Forecast | Geographic Relevance | Impact Timeline |
|---|---|---|---|
| High Upfront Cost Barrier | –1.4% | Global; acute in emerging markets | Short term (≤2 years) |
| Limited E-Bike Trail Access | –1.1% | North America federal lands; European forests | Long term (≥4 years) |
| Steep Terrain Range Anxiety | –0.8% | Mountainous regions worldwide | Medium term (2-4 years) |
| Battery Performance in Cold | –0.6% | Nordic and alpine climates | Medium term (2-4 years) |
| Source: Mordor Intelligence | |||
High Upfront Cost vs. Conventional MTBs
High premiums over analog bikes deter mass adoption, especially in economies where consumer credit penetration is low. Carbon-framed flagships often come with a cost, restricting ownership to affluent enthusiasts despite rising financing options. Manufacturers now offer modular upgrade paths that defer part of the spend across ownership’s life cycle. Total cost-of-ownership calculators highlighting savings on shuttle fuel and lift passes are gaining traction but have yet to sway price-first buyers. Subsidies ease the gap, yet sticker shock remains a near-term brake on the E-Mountain Bike market.
Land-Access Rules Limiting E-Bike Trail Entry
Jurisdictions vary on whether pedal-assist counts as motorized, forcing riders to study local bylaws before riding. United States federal forests permit Class 1 e-MTBs only on roads wider than 2 m, sidelining most single-track. Proposed EU biodiversity laws could shift cycling to corridor trails, curbing off-piste exploration. Such ambiguity dissuades retailers from stocking e-MTBs in regions with uncertain legality. Advocacy groups lobby for harmonized definitions, yet statutory cycles progress slowly. The policy maze suppresses addressable demand despite abundant terrain.
*Our forecasts treat driver/restraint impacts as directional, not additive. The impact forecasts reflect baseline growth, mix effects, and variable interactions.
E-Mountain Bike Market Segment Analysis
By Propulsion Type:
Pedal Assistance Anchors Adoption while Dual-Mode Gains PacePedal-assisted configurations secured 71.62% of the E-Mountain Bike market share in 2025, entrenching them as the cornerstone of the E-Mountain Bike market. Their cadence-sensing controllers preserve the rhythmic feel of analog riding, earning social acceptance in trail communities and satisfying regulators that demand rider input for motor activation. Many premium models now blend multi-sensor torque readings with predictive algorithms that taper power seamlessly, eliminating the “on-off” sensation earlier units displayed. The segment’s strength stems from compatibility with single-track access rules that often bar throttle use, ensuring broad legal applicability.
By contrast, dual-mode systems offering pedal assist and throttle are moving at a 10.05% CAGR by appealing to riders who traverse mixed terrain or transport cargo uphill, particularly in bike-park shuttling and adaptive cycling programs. Brands are segmenting price tiers cleverly: entry-level pedal-assist bikes for mainstream adventurers, dual-mode flagships for thrill seekers, and throttle-only variants for utility scenarios. As firmware sophistication advances, manufacturers envision over-the-air unlocks that let owners switch assistance modes for specific venues, a tactic expected to deepen engagement and extend upgrade cycles within the E-Mountain Bike market.


By Application:
Leisure Dominates, Tourism Rentals Accelerate Commercial PenetrationLeisure and adventure riders accounted for 46.78% of the E-Mountain Bike market share in 2025, evidencing the segment’s role as the emotional magnet for first-time buyers who value expanded range and reduced physical strain. Typical owner profiles skew toward experienced cyclists wanting longer mileage on alpine routes without exhaustive conditioning. Yet, younger social-media-driven cohorts increasingly use e-MTBs to film dynamic content on gnarly descents. Though smaller at inception, tourism rentals are expanding at 10.92% CAGR as destination operators bundle guided tours, shuttle passes, and accommodations into turnkey experiences.
Resort fleets report higher daily earnings versus analog bike rentals while stretching shoulder-season occupancy, validating the business case for high-capex inventory. Sports-racing formats are solidifying with sanctioning bodies introducing dedicated e-enduro series, legitimizing the segment, and inspiring component makers to release race-oriented motor maps. Commuter usage remains niche but is predicted to climb modestly where trailheads intersect suburban transport grids, leveraging mixed-purpose bikes that toggle between weekday commuting and weekend off-road exploration.
By Battery Chemistry:
Lithium-Ion Retains Dominance as Solid-State EmergesLithium-ion cells represented 91.02% of the E-Mountain Bike market share in 2025, reflecting mature supply chains, reliable thermal performance, and a favorable cost trajectory. OEMs continue to prioritize nickel-cobalt-manganese blends for high-capacity packs above 800 Wh, enabling all-day alpine rides without midday charging. However, safety narratives surrounding cobalt sourcing and thermal runaway have spurred research into solid-state iterations that promise non-flammable electrolytes and energy densities surpassing 350 Wh/kg. This nascent class is tracking a 15.2% CAGR, albeit from a low base, as pilot volumes flow from consumer electronics factories into limited-edition e-MTB flagships.
Manufacturers are redesigning downtubes around modular battery bays that can house either chemistry, future-proofing frames, and sustaining resale value. Winter-riding use cases highlight cold-weather derating issues where lithium-ion capacity dips by up to 30%; integrated pack heaters now mitigate such losses, allowing four-season performance and bolstering the E-Mountain Bike market’s appeal in Nordic and alpine regions.
By Power Output:
Mid-Range Motors Balance Legal Compliance and Trail UtilitySystems rated 250-500 W captured 58.74% of the E-Mountain Bike market share in 2025, harmonizing with European standards that cap continuous power at 250 W yet permit peaks above 600 W during climbs. These motors deliver torque curves around 85-95 Nm, sufficient for most rider weights on 15% gradients while conserving battery life. Above-500 W drives are gathering momentum at 9.72% CAGR as riders tackle steeper, looser terrain or haul gear for backcountry overnight trips.
In markets like the United States, where regulatory ceilings are higher, 750 W peak motors gain favor for freeride parks and adaptive cycling. Future European legislation may ratify 750 W peak caps, aligning consumer expectations with real-world motor behavior, thereby narrowing the policy gap across continents . Concurrently, torque-first marketing replaces raw-watt language; companies tout “instant surge” and “natural cadence matching” to convey ride quality, illustrating how product storytelling evolves as the e-mountain Bike market matures.
By Frame Material:
Aluminum Stays Workhorse as Carbon Captures Premium LanesAluminum frames retained a 63.88% of the E-Mountain Bike market share in 2025, prized for cost-effective manufacturability, robustness, and straightforward repair after crash events common in gravity-oriented riding. Hydroformed tubes now integrate internal channeling for wiring harnesses and cooling air gaps around battery casings, enhancing aesthetics and thermal management. Carbon fiber, advancing at 10.63% CAGR, seduces weight-conscious riders and competitive racers who value sub-23 kg builds plus vibration damping on rocky descents. The material’s malleability allows sculpted downtubes that seamlessly cradle batteries, eliminating bulky external housings and elevating perceived luxury.
Recycled aluminum and low-resin carbon layups are debuting in 2025 models, signaling industry acknowledgment of embedded-carbon scrutiny under EU sustainability audits. Frame innovation thus becomes a battleground for performance, design differentiation, and environmental storytelling within the E-Mountain Bike market.
By Distribution Channel:
Specialty Retail Anchors Expertise while Subscriptions Redefine AccessSpecialty bike stores, accounting for 45.08% of the E-Mountain Bike market share in 2025, remain pivotal thanks to their service bays, demo fleets, and rider-fit expertise necessary for complex e-systems. Premium brands mandate professional assembly to safeguard warranty compliance and motor calibration. Nonetheless, subscription and leasing platforms are rising at an 11.18% CAGR, bundling hardware, insurance, and maintenance into monthly packages that resonate with consumers wary of rapid tech obsolescence.
Direct-to-consumer webshops exploit rich media tutorials and augmented-reality sizing to sidestep dealer margins, but many partner with mobile service vans to address post-sale support gaps. Hybrid “click-and-collect” models emerge, letting riders purchase online yet pick up pre-tuned bikes at partner shops, blending convenience with technical assurance. Add-value services, battery health diagnostics, firmware updates, and guided excursions become critical moats for brick-and-mortar outlets as the E-Mountain Bike market pivots from transactional retail to lifecycle experience management.
Geography Analysis
Europe E-Mountain Bike Market
Europe led the E-Mountain Bike market with 42.87% of the E-Mountain Bike market share in 2025, powered by dense trail networks, supportive insurance regimes, and cultural acceptance of e-mobility across all age brackets. Germany remains the continent’s anchor with 2.05 million e-bike sales in 2024, buttressed by a dealer network skilled in diagnostics and spares. France and Italy follow, leveraging tourism economies that promote e-MTB guiding services in Alpine and coastal regions. EU battery sourcing mandates enacted in 2025 skew procurement toward regional cell makers, subtly recentering supply chains and reinforcing Europe’s leadership position in the E-Mountain Bike market.
APAC E-Mountain Bike Market
Asia-Pacific is the fastest-growing territory at a 10.32% CAGR through 2031, a trajectory fueled by China’s manufacturing scale and a burgeoning aspirational middle class. Domestic brands capitalize on direct-to-consumer logistics infrastructure honed in broader e-commerce, undercutting global incumbents on price without sacrificing connectivity features. Japanese firms refine compact 250 W motors optimized for tight trail systems with stricter speed caps, while Korean suppliers invest in solid-state battery pilot lines slated for 2027 release. India’s hill-station tourism districts begin adopting resort fleets to move visitors up steep gradients, illustrating the region’s potential to leapfrog legacy cycling adoption and move directly into the E-Mountain Bike market.
North America E-Mountain Bike Market
North America contributes significant volume yet contends with federal land-access fragmentation that stalls wider single-track penetration. The United States imported a significant number of e-bikes in 2024, reflecting a positive year-on-year growth, though only a fraction were e-MTBs owing to policy uncertainty. California and Colorado rebate programs now reimburse up to USD 1,500, triggering spikes in retailer preorders. Canada mirrors trends in British Columbia and Québec, where provincial incentives dovetail with well-maintained trail networks to foster above-average adoption.


Competitive Landscape
The competitive field is moderately fragmented, with no brand surpassing a mid-teens global share. Legacy bicycle giants such as Giant, Trek, and Specialized leverage broad dealer footprints and co-develop drive units with Bosch or Shimano, ensuring after-sales support and warranty continuity. Automotive entrants expand brand portfolios: Yamaha’s acquisition of Brose’s e-bike motor unit deepens powertrain vertical integration and safeguards supply in Europe. Audi partnered with Fantic to launch the second-generation e-MTB 2.0, blending Dakar-inspired design cues with 180 mm suspension travel to court affluent enthusiasts [3]“Audi eMTB 2.0 Press Release,” Audi AG, audi.com.
Direct-to-consumer challengers like Amflow disrupt by embedding DJI’s Avinox drive in a carbon chassis priced below equivalent spec dealer brands, exploiting consumer electronics cost structures. Subscription specialists coordinate fleet servicing and software-based usage analytics, creating sticky ecosystems less susceptible to one-off discounting.
Component suppliers hold outsized influence; motor firmware and battery chemistry set ride feel and range, meaning OEMs often co-market with drive vendors to signal performance credibility. As hardware commoditizes, differentiation tilts toward companion apps, map integration, and update cadence. Consequently, future leadership in the E-Mountain Bike market may hinge more on digital engagement metrics than on frame tube hydroforming.
E-Mountain Bike Industry Leaders
Trek Bicycle Corporation
Giant Manufacturing Co. Ltd
Specialized Bicycle Components, Inc.
Scott Sports SA
Yamaha Motor Co. Ltd
- *Disclaimer: Major Players sorted in no particular order
E-Mountain Bike Market Companies Covered in this Report
- Giant Manufacturing Co. Ltd
- Pivot Cycles
- Scott Sports SA
- Trek Bicycle Corporation
- CUBE GmbH & Co. KG
- Yamaha Motor Co. Ltd
- Pedego Electric Bikes
- BH Bikes
- Specialized Bicycle Components, Inc.
- Haibike
- Merida Industry Co. Ltd
- Santa Cruz Bicycles
- Rocky Mountain Bicycles
- Cannondale (Dorel Sports)
- Bulls Bikes
- Commencal
- Kona Bicycle Company
- Orbea S. Coop.

Recent Industry Developments in E-Mountain Bike Market
- September 2025: Audi unveiled its second-generation electric mountain bike developed with Fantic, featuring an Öhlins 180 mm suspension and a lighter aluminum frame.
- June 2025: RAYMON Bicycles debuted the RAVOR and VANTOR e-MTBs at Eurobike 2025, both powered by the new Yamaha PW-X4 drive producing 100 Nm torque.
- April 2025: Bonnell Electric launched the 775 series, a modular lineup targeting commuters, trail riders, and hybrid e-moto users.
- September 2024: Canyon released the Spectral:ONfly, integrating Keep-It-Stable steering damping and double-sealed pivots for quieter operation.


Global E-Mountain Bike Market Report Scope
The e-mountain bike is an electric bicycle that is dedicated to trekking applications. These are made favorable for a wide variety of terrain to keep their performance high.
The e-mountain bike market is segmented by propulsion type, application, and geography. Based on propulsion type, the market is segmented into pedal-assisted and throttle-assisted. Based on application type, the market is segmented into leisure and commuting. Based on geography, the market is segmented into North America, Europe, Asia-Pacific, and the Rest of the World.
The report offers market size and forecasts for the e-mountain market in value (USD billion) for all the above-mentioned segmentation.
Segmentation Overview
| Pedal-Assisted |
| Throttle-Assisted |
| Dual-Mode (Pedal + Throttle) |
| Leisure and Adventure |
| Commuting |
| Sports / Racing |
| Tourism Rental |
| Lithium-ion |
| Lithium-Polymer |
| Others (Lead-acid, Solid-state) |
| Less than/Equals 250 W |
| 250-500 W |
| Above 500 W |
| Aluminum |
| Carbon Fiber |
| Steel and Others |
| OEM Dealerships |
| Specialty Bike Stores |
| Online Retail |
| Subscription and Leasing Platforms |
| North America | United States |
| Canada | |
| Rest of North America | |
| South America | Brazil |
| Argentina | |
| Rest of South America | |
| Europe | Germany |
| United Kingdom | |
| Italy | |
| Switzerland | |
| France | |
| Spain | |
| Rest of Europe | |
| Asia-Pacific | China |
| Japan | |
| South Korea | |
| India | |
| Australia | |
| Rest of Asia-Pacific | |
| Middle East and Africa | United Arab Emirates |
| Saudi Arabia | |
| Turkey | |
| Egypt | |
| South Africa | |
| Rest of Middle East and Africa |
| By Propulsion Type | Pedal-Assisted | |
| Throttle-Assisted | ||
| Dual-Mode (Pedal + Throttle) | ||
| By Application | Leisure and Adventure | |
| Commuting | ||
| Sports / Racing | ||
| Tourism Rental | ||
| By Battery Type | Lithium-ion | |
| Lithium-Polymer | ||
| Others (Lead-acid, Solid-state) | ||
| By Power Output | Less than/Equals 250 W | |
| 250-500 W | ||
| Above 500 W | ||
| By Frame Material | Aluminum | |
| Carbon Fiber | ||
| Steel and Others | ||
| By Distribution Channel | OEM Dealerships | |
| Specialty Bike Stores | ||
| Online Retail | ||
| Subscription and Leasing Platforms | ||
| By Geography | North America | United States |
| Canada | ||
| Rest of North America | ||
| South America | Brazil | |
| Argentina | ||
| Rest of South America | ||
| Europe | Germany | |
| United Kingdom | ||
| Italy | ||
| Switzerland | ||
| France | ||
| Spain | ||
| Rest of Europe | ||
| Asia-Pacific | China | |
| Japan | ||
| South Korea | ||
| India | ||
| Australia | ||
| Rest of Asia-Pacific | ||
| Middle East and Africa | United Arab Emirates | |
| Saudi Arabia | ||
| Turkey | ||
| Egypt | ||
| South Africa | ||
| Rest of Middle East and Africa | ||


Key Questions Answered in the Report
What is the current value of the global E-Mountain Bike market?
The market stands at USD 9.41 billion in 2026 and is projected to reach USD 14.75 billion by 2031.
Which region leads sales of electric mountain bikes?
Europe holds 42.87% of global revenue, supported by mature infrastructure and favorable regulations.
What segment is growing fastest within the E-Mountain Bike space?
Dual-mode propulsion systems are expanding at a 10.05% CAGR as riders seek both pedal assistance and throttle flexibility.
How big is the tourism rental opportunity for e-MTBs?
Tourism rentals are advancing at an 10.92% CAGR, with resort fleets reporting 40% higher daily revenue than analog bike rentals.
What battery technology dominates current models?
Lithium-ion packs command 91.02% of units, though solid-state alternatives are emerging at a 15.2% CAGR.
Are subscription models affecting purchase behavior?
Yes, subscription and leasing channels are rising at an 11.18% CAGR, lowering upfront costs and bundling maintenance services.
Page last updated on:


