Dry Beans Market Size and Share
Dry Beans Market Analysis by Mordor Intelligence
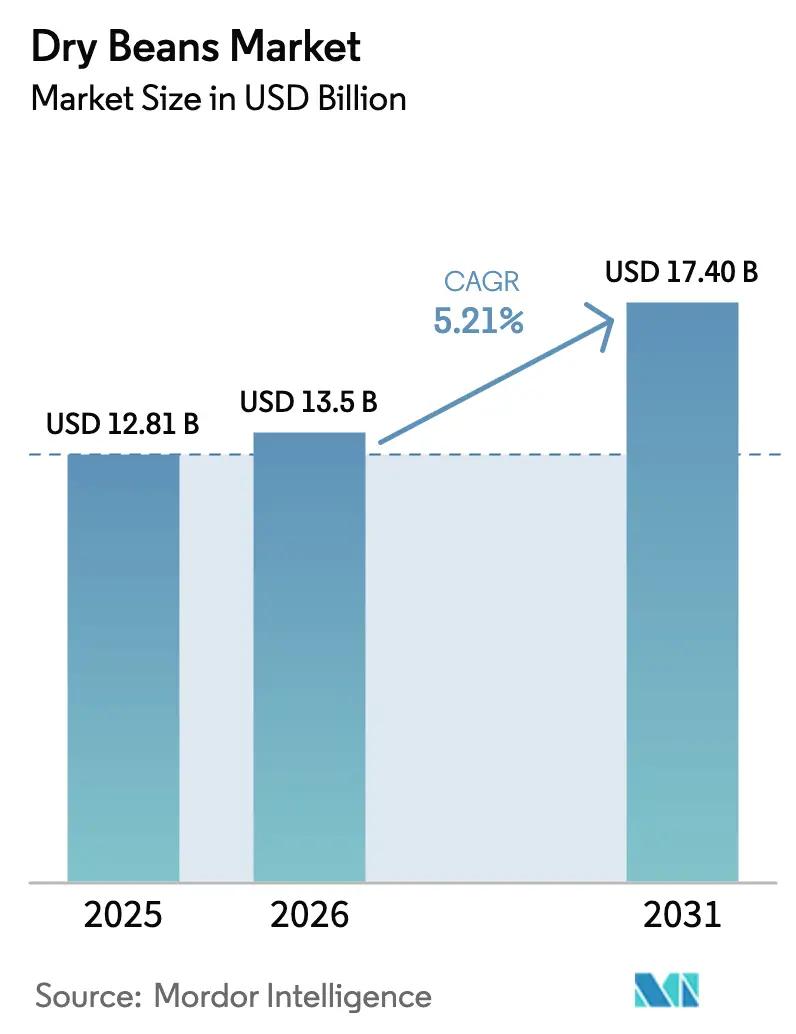
The dry beans market size was valued at USD 12.81 billion in 2025 and is estimated to reach USD 13.50 billion in 2026. The market is further projected to reach USD 17.40 billion by 2031, registering a CAGR of 5.21% during the forecast period (2026–2031). Strong retail demand for plant proteins, wider crop-rotation benefits for growers, and supportive trade policies keep the growth engine running. Carbon-credit programs that reward nitrogen fixation are turning agronomic advantages into new revenue streams for producers. Food manufacturers are scaling bean-based snacks, pastas, and ready-to-eat meals, while quick-service chains test black-bean and chickpea patties to court younger diners who value sustainability. At the farm level, gene-edited drought-tolerant cultivars are moving from trial plots to commercial seed catalogs, especially in water-scarce regions. These drivers coexist with headwinds such as pest outbreaks, yield swings linked to extreme weather, and labor constraints in smallholder systems, creating a patchwork of opportunities and risks that stakeholders in the dry beans market navigate daily.
Key Report Takeaways
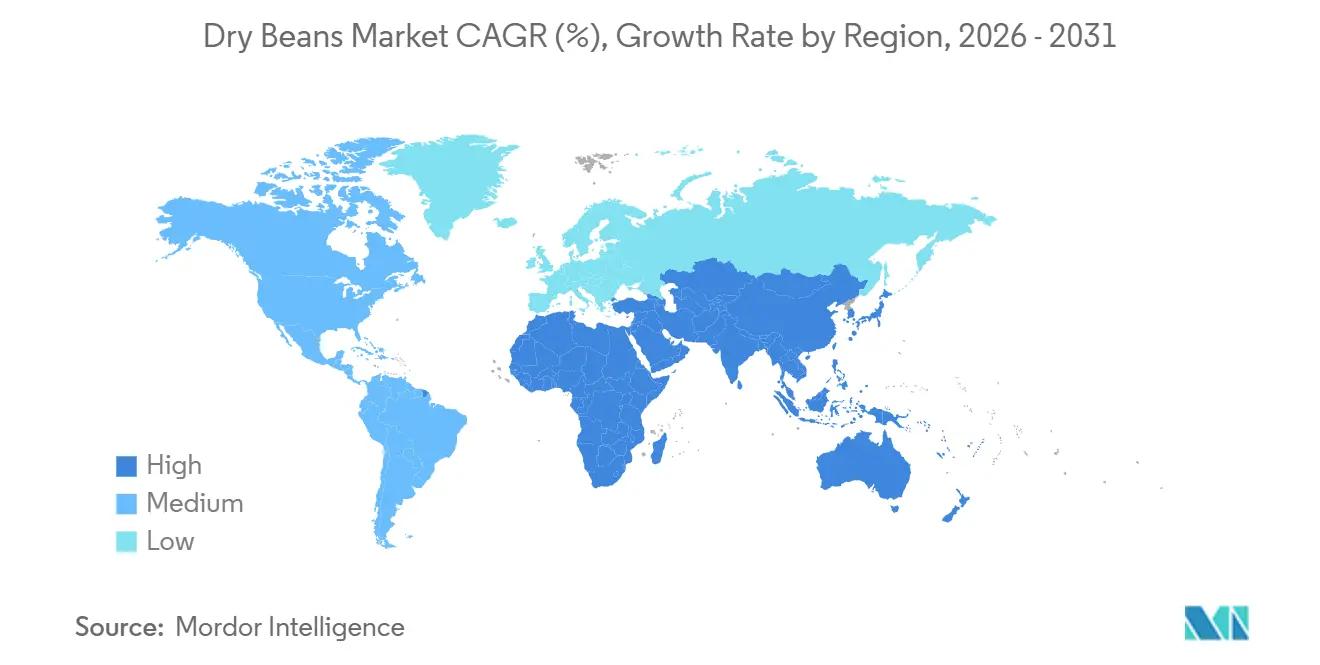
- By geography, the Asia-Pacific region accounted for 41.2% of the dry beans market share in 2025, while the Middle East is projected to register a 6.8% CAGR through 2031.
Note: Market size and forecast figures in this report are generated using Mordor Intelligence’s proprietary estimation framework, updated with the latest available data and insights as of January 2026.
Global Dry Beans Market Trends and Insights
Drivers Impact Analysis*
| Driver | (~) % Impact on CAGR Forecast | Geographic Relevance | Impact Timeline |
|---|---|---|---|
| Rising global adoption of vegan and flexitarian diets | +1.2% | North America, Europe, and emerging Asia-Pacific urban hubs | Medium term (2 to 4 years) |
| Expanding pulse-crop rotations in cereal-dominant regions | +0.9% | North America, Europe, and Asia-Pacific grain belts | Long term (≥ 4 years) |
| Import tariff cuts on plant proteins in high-income nations | +0.6% | North America, Europe, and Asia-Pacific | Short term (≤ 2 years) |
| Monetization of on-farm carbon credits for nitrogen-fixing beans | +0.7% | North America, Europe, and pilot sites in South America | Medium term (2 to 4 years) |
| Gene-edited drought-tolerant cultivar commercialization | +0.8% | United States, Australia, Brazil, and research clusters worldwide | Long term (≥ 4 years) |
| Surge in demand for gluten-free staple foods | +1.0% | North America and Europe with global spillover | Medium term (2 to 4 years) |
| Source: Mordor Intelligence | |||


Rising Global Adoption of Vegan and Flexitarian Diets
Consumers reducing animal protein intake are driving higher household purchases of pulses, particularly dried beans. The plant-based retail sector in Europe has nearly doubled in value over the past five years, reflecting strong demand for sustainable alternatives. Shelf space for bean-based snacks, pasta, and ready meals continues to expand, while quick-service restaurants are piloting chickpea and black-bean burgers to appeal to younger diners. Institutional caterers in schools and hospitals are also incorporating more legume dishes to align with health guidelines and carbon reduction targets. Retail data show consistent growth in the consumption of dry beans and other pulses, even when meat prices decline, signaling a structural shift in dietary preferences. Uptake is strongest in metropolitan areas, but similar trends are emerging in secondary cities across North America.
Expanding Pulse-Crop Rotations in Cereal-Dominant Regions
Growers in temperate grain belts are increasingly adopting pulse rotations due to the clear agronomic and economic benefits they offer. United States field trials show that wheat crops grown after legumes experience noticeable yield improvements. This is because legumes naturally enrich the soil by depositing nitrogen and help suppress harmful pathogens[1]Source: United States Department of Agriculture Agricultural Research Service, “Pulse Crop Rotation Benefits,” ars.usda.gov. Incentives from agricultural policies and high fertilizer costs have strengthened the case for rotating beans with barley and wheat. In Australia, pulses are also used as biological break crops to combat herbicide-resistant weeds. Mechanized farms integrate beans quickly, whereas smallholders in South Asia and Africa face challenges due to limited access to seeds and extension services. Rotation benefits remain compelling wherever synthetic fertilizer costs remain elevated, making dry beans and other pulses a valuable complement to cereal systems.
Gene-Edited Drought-Tolerant Cultivar Commercialization
Advances in Clustered Regularly Interspaced Short Palindromic Repeats (CRISPR) technology are accelerating the development of bean cultivars that maintain yields under water stress. Field trials are underway for drought-tolerant lines engineered with deeper roots and improved osmotic balance, building on natural resilience traits. Regulatory frameworks in several countries classify many gene-edited crops as non-transgenic, shortening approval timelines and encouraging private-sector investment. Seed companies anticipate commercial sales later this decade, targeting arid zones where water scarcity limits the production of common beans. Adoption will depend on seed pricing and proven yield stability, but early demonstration plots show promising results. These innovations could reshape production in regions most vulnerable to climate variability.
Surge in Demand for Gluten Free Staple Foods
Growing awareness of celiac disease and non-celiac gluten sensitivity is boosting demand for gluten-free products worldwide. Bean flours are increasingly used as substitutes for wheat in bread, pasta, and snacks, offering protein and fiber without gluten. Food manufacturers capture significant premiums for gluten-free variants, and traditional recipes in countries such as Italy and France are evolving to incorporate more pulses. Public health campaigns encourage higher intake of dry beans, reinforcing their role as nutritious staples. Sensory challenges remain, but research into enzyme treatments and fermentation is improving texture and flavor. These advances are widening consumer acceptance and expanding the market for gluten-free pulse-based foods.
Restraints Impact Analysis*
| Restraint | (~) % Impact on CAGR Forecast | Geographic Relevance | Impact Timeline |
|---|---|---|---|
| Pest and disease vulnerability elevating farm-gate losses | -0.7% | North America, South Asia, and East Africa | Short term (≤ 2 years) |
| Yield volatility from extreme weather cycles | -0.9% | Africa, South Asia, and North America | Short term (≤ 2 years) |
| Slow mechanization in smallholder regions | -0.5% | Africa, South Asia, and parts of South America | Long term (≥ 4 years) |
| Rising labor costs in key producing countries | -0.6% | North America, Europe, Brazil, and Asia-Pacific | Medium term (2 to 4 years) |
| Source: Mordor Intelligence | |||
Pest and Disease Vulnerability Elevating Farm-Gate Losses
Diseases such as halo blight and white mold can severely reduce yields, with losses reaching up to half of potential output in affected fields[2]Source: United States Department of Agriculture Agricultural Research Service, “Halo Blight and White Mold Disease Management 2024,” ars.usda.gov. Resistant varieties and fungicides help mitigate damage, but many smallholders lack access to these solutions. Climate change is intensifying risks by allowing pests to overwinter in regions previously protected by frost, expanding outbreaks. Quality downgrades from discoloration or shriveled seeds further erode farm-gate prices, reducing farmer incomes. Breeding programs focused on durable resistance are crucial in countering these threats. Wider access to integrated pest management (IPM) tools will be critical to reducing losses and stabilizing production.
Yield Volatility from Extreme Weather Cycles
Extreme weather events are a major source of yield volatility in pulse production. Droughts during critical growth phases can sharply reduce output, while excessive rainfall encourages fungal diseases and disrupts pollination. Irrigation can triple yields, yet the Food and Agriculture Organization (FAO) estimates show only a small fraction of African farmland is irrigated, leaving millions of farmers exposed[3]Source: Food and Agriculture Organization, “Agricultural Mechanization and Labor Savings in Bean Harvesting 2024,” fao.org. Crop insurance provides protection in developed markets, but similar tools remain scarce in developing regions. This lack of safety nets amplifies income shocks and discourages investment in pulse farming. Addressing weather-related risks will be central to ensuring stable supply and farmer resilience.
*Our forecasts treat driver/restraint impacts as directional, not additive. The impact forecasts reflect baseline growth, mix effects, and variable interactions.
Geography Analysis
The Asia-Pacific region accounted for 41.2% of the dry beans market share in 2025, underscoring its role as the largest regional base. India anchors this position with substantial output, while China remains a major importer even as it signals greater self-sufficiency. Myanmar and other Southeast Asian countries highlight the region’s export orientation, channeling beans into international markets. Australia contributes through mechanized farms that integrate pulse rotations with cereals, improving soil fertility and supporting export flows. Rising urban incomes and shifts in dietary preferences toward plant-based foods continue to drive consumption growth. Together, these dynamics reinforce the Asia-Pacific region’s dominance in both production and demand, positioning it as the global hub for dry beans.
The Middle East dry beans market size is projected to grow at a CAGR of 6.8% through 2031, making it the fastest-growing region in the dry beans market. Turkey and Iran are expanding domestic acreage to reduce reliance on imports, while broader regional initiatives emphasize food security. Government-backed programs encourage farmers to diversify cropping systems, supporting pulses as a strategic staple. Rising consumer demand for plant proteins is also reshaping dietary preferences, creating opportunities for local producers. The region’s growth trajectory reflects a combination of policy support, shifting consumption habits, and investment in agricultural modernization. As these factors converge, the Middle East is set to become a key driver of global dry bean expansion.
North America remains a critical export hub, with the United States and Mexico contributing significant volumes despite weather-related yield swings. South America is centered on Brazil, where rising domestic consumption absorbs much of the output, while Argentina’s crop-mix shifts add volatility. Europe exhibits diverse trends, with Russia, Italy, and France promoting the consumption of dry beans and other pulses, and Germany importing heavily to meet its plant-protein demand. Africa remains dominated by smallholder systems, where the Food and Agriculture Organization estimates show beans are among the most important food crops. Limited irrigation magnifies weather risks, constraining yield gains relative to irrigated benchmarks. Collectively, these regions balance global supply and demand.

Competitive Landscape
Major multinational agribusinesses, including Archer Daniels Midland Company, Cargill Incorporated, Louis Dreyfus Company B.V., and Olam Agri Holdings Pte Ltd., play a significant role in the dry beans market. Their operations encompass procurement, processing, and global distribution, linking producers with international buyers. These companies utilize economies of scale, advanced logistics infrastructure, and commodity trading expertise to stabilize supply chains and manage price fluctuations. Their strategies often integrate dry beans into broader portfolios of pulses and grains, ensuring consistent availability across various markets. Additionally, they influence production incentives, farmer practices, and sustainability benchmarks, making them essential to the long-term resilience of the dry beans market.
Companies such as Goya Foods Inc., Bonduelle SA, Bush Brothers & Company, and Conagra Brands Inc. are key stakeholders in the dry beans market. These firms process dry beans into packaged, canned, or ready-to-eat products, bridging the gap between agricultural supply and consumer demand. Their contributions include branding, product innovation, and promoting consumption through convenience foods and health-oriented offerings. By investing in marketing and distribution, they shape consumer preferences and drive demand growth in both established and emerging markets. These companies also respond to dietary trends, positioning beans as cost-effective sources of protein and fiber. Their purchasing decisions and quality standards have a significant impact on growers and processors, underscoring their role in shaping the market's trajectory.
Stakeholders such as AGT Food and Ingredients Inc. and J.R. Simplot Company bring specialized expertise and diversified portfolios to the dry beans market. AGT focuses extensively on pulses, including dry beans, offering processing, packaging, and export services that enhance global trade flows. J.R. Simplot, while primarily associated with potatoes, diversifies into beans and other crops, contributing to the resilience of agricultural supply chains. These companies often leverage regional strengths, connecting local producers with international buyers while maintaining flexibility in their product offerings. Their strategies emphasize innovation in processing, sustainability initiatives, and niche market development. Alongside larger agribusinesses and consumer brands, these stakeholders ensure the market remains dynamic, striking a balance between global scale and regional specialization to meet changing demand patterns.
Recent Industry Developments
- December 2024: CHS Inc. expanded the processing capacity of dry beans at its Othello facility in the Pacific Northwest. Rising demand for affordable plant‑based protein and ethnic cuisine is fueling growth, positioning dry beans as a profitable rotational crop and strengthening CHS’s role in dry beans markets.
- August 2024: Hanwei Foods introduced a new line of dry bean snacks, emphasizing high protein, fiber, and vitamin content. The launch positioned dry beans as a convenient, nutrient-dense option in the global snack market with eco-friendly packaging.
- February 2024: AGT Africa acquired Pannar’s dry bean seed business, expanding its portfolio with locally adapted varieties. This move strengthens regional supply and supports African growers with improved genetics to meet rising demand.


Research Methodology Framework and Report Scope
Market Definitions and Key Coverage
Mordor Intelligence frames the dry beans market as the value generated by all mature, dried seeds of leguminous plants traded under HS-0713, including kidney, navy, pinto, black, and similar beans, measured at the point they leave primary processors and before any substantial further transformation into canned, frozen, or fractionated ingredients. We consider both export-oriented commodity flows and in-country direct consumption channels.
Scope Exclusions: The study deliberately leaves out fresh green beans, soybeans, chickpeas, and any revenue from ready-to-eat, dehydrated, or canned bean products.
Segmentation Overview
- By Geography
- North America
- United States
- Production Analysis (Area Harvested, Yield, and Production Volume)
- Consumption Analysis (Consumption Value and Volume)
- Import Market Analysis (Import Value, Volume, and Key Supplying Markets)
- Export Market Analysis (Export Value, Volume, and Key Destination Markets)
- Wholesale Price Trend Analysis and Forecast
- Regulatory Framework
- List of Key Players
- Logistic and Infrastructure
- Seasonality Analysis
- Mexico
- Production Analysis (Area Harvested, Yield, and Production Volume)
- Consumption Analysis (Consumption Value and Volume)
- Import Market Analysis (Import Value, Volume, and Key Supplying Markets)
- Export Market Analysis (Export Value, Volume, and Key Destination Markets)
- Wholesale Price Trend Analysis and Forecast
- Regulatory Framework
- List of Key Players
- Logistic and Infrastructure
- Seasonality Analysis
- United States
- Europe
- Russia
- Production Analysis (Area Harvested, Yield, and Production Volume)
- Consumption Analysis (Consumption Value and Volume)
- Import Market Analysis (Import Value, Volume, and Key Supplying Markets)
- Export Market Analysis (Export Value, Volume, and Key Destination Markets)
- Wholesale Price Trend Analysis and Forecast
- Regulatory Framework
- List of Key Players
- Logistic and Infrastructure
- Seasonality Analysis
- Italy
- Production Analysis (Area Harvested, Yield, and Production Volume)
- Consumption Analysis (Consumption Value and Volume)
- Import Market Analysis (Import Value, Volume, and Key Supplying Markets)
- Export Market Analysis (Export Value, Volume, and Key Destination Markets)
- Wholesale Price Trend Analysis and Forecast
- Regulatory Framework
- List of Key Players
- Logistic and Infrastructure
- Seasonality Analysis
- France
- Production Analysis (Area Harvested, Yield, and Production Volume)
- Consumption Analysis (Consumption Value and Volume)
- Import Market Analysis (Import Value, Volume, and Key Supplying Markets)
- Export Market Analysis (Export Value, Volume, and Key Destination Markets)
- Wholesale Price Trend Analysis and Forecast
- Regulatory Framework
- List of Key Players
- Logistic and Infrastructure
- Seasonality Analysis
- Germany
- Production Analysis (Area Harvested, Yield, and Production Volume)
- Consumption Analysis (Consumption Value and Volume)
- Import Market Analysis (Import Value, Volume, and Key Supplying Markets)
- Export Market Analysis (Export Value, Volume, and Key Destination Markets)
- Wholesale Price Trend Analysis and Forecast
- Regulatory Framework
- List of Key Players
- Logistic and Infrastructure
- Seasonality Analysis
- Russia
- Asia-Pacific
- China
- Production Analysis (Area Harvested, Yield, and Production Volume)
- Consumption Analysis (Consumption Value and Volume)
- Import Market Analysis (Import Value, Volume, and Key Supplying Markets)
- Export Market Analysis (Export Value, Volume, and Key Destination Markets)
- Wholesale Price Trend Analysis and Forecast
- Regulatory Framework
- List of Key Players
- Logistic and Infrastructure
- Seasonality Analysis
- India
- Production Analysis (Area Harvested, Yield, and Production Volume)
- Consumption Analysis (Consumption Value and Volume)
- Import Market Analysis (Import Value, Volume, and Key Supplying Markets)
- Export Market Analysis (Export Value, Volume, and Key Destination Markets)
- Wholesale Price Trend Analysis and Forecast
- Regulatory Framework
- List of Key Players
- Logistic and Infrastructure
- Seasonality Analysis
- Myanmar
- Production Analysis (Area Harvested, Yield, and Production Volume)
- Consumption Analysis (Consumption Value and Volume)
- Import Market Analysis (Import Value, Volume, and Key Supplying Markets)
- Export Market Analysis (Export Value, Volume, and Key Destination Markets)
- Wholesale Price Trend Analysis and Forecast
- Regulatory Framework
- List of Key Players
- Logistic and Infrastructure
- Seasonality Analysis
- Australia
- Production Analysis (Area Harvested, Yield, and Production Volume)
- Consumption Analysis (Consumption Value and Volume)
- Import Market Analysis (Import Value, Volume, and Key Supplying Markets)
- Export Market Analysis (Export Value, Volume, and Key Destination Markets)
- Wholesale Price Trend Analysis and Forecast
- Regulatory Framework
- List of Key Players
- Logistic and Infrastructure
- Seasonality Analysis
- China
- South America
- Brazil
- Production Analysis (Area Harvested, Yield, and Production Volume)
- Consumption Analysis (Consumption Value and Volume)
- Import Market Analysis (Import Value, Volume, and Key Supplying Markets)
- Export Market Analysis (Export Value, Volume, and Key Destination Markets)
- Wholesale Price Trend Analysis and Forecast
- Regulatory Framework
- List of Key Players
- Logistic and Infrastructure
- Seasonality Analysis
- Argentina
- Production Analysis (Area Harvested, Yield, and Production Volume)
- Consumption Analysis (Consumption Value and Volume)
- Import Market Analysis (Import Value, Volume, and Key Supplying Markets)
- Export Market Analysis (Export Value, Volume, and Key Destination Markets)
- Wholesale Price Trend Analysis and Forecast
- Regulatory Framework
- List of Key Players
- Logistic and Infrastructure
- Seasonality Analysis
- Brazil
- Middle East
- Turkey
- Production Analysis (Area Harvested, Yield, and Production Volume)
- Consumption Analysis (Consumption Value and Volume)
- Import Market Analysis (Import Value, Volume, and Key Supplying Markets)
- Export Market Analysis (Export Value, Volume, and Key Destination Markets)
- Wholesale Price Trend Analysis and Forecast
- Regulatory Framework
- List of Key Players
- Logistic and Infrastructure
- Seasonality Analysis
- Iran
- Production Analysis (Area Harvested, Yield, and Production Volume)
- Consumption Analysis (Consumption Value and Volume)
- Import Market Analysis (Import Value, Volume, and Key Supplying Markets)
- Export Market Analysis (Export Value, Volume, and Key Destination Markets)
- Wholesale Price Trend Analysis and Forecast
- Regulatory Framework
- List of Key Players
- Logistic and Infrastructure
- Seasonality Analysis
- Turkey
- Africa
- Tanzania
- Production Analysis (Area Harvested, Yield, and Production Volume)
- Consumption Analysis (Consumption Value and Volume)
- Import Market Analysis (Import Value, Volume, and Key Supplying Markets)
- Export Market Analysis (Export Value, Volume, and Key Destination Markets)
- Wholesale Price Trend Analysis and Forecast
- Regulatory Framework
- List of Key Players
- Logistic and Infrastructure
- Seasonality Analysis
- Kenya
- Production Analysis (Area Harvested, Yield, and Production Volume)
- Consumption Analysis (Consumption Value and Volume)
- Import Market Analysis (Import Value, Volume, and Key Supplying Markets)
- Export Market Analysis (Export Value, Volume, and Key Destination Markets)
- Wholesale Price Trend Analysis and Forecast
- Regulatory Framework
- List of Key Players
- Logistic and Infrastructure
- Seasonality Analysis
- South Africa
- Production Analysis (Area Harvested, Yield, and Production Volume)
- Consumption Analysis (Consumption Value and Volume)
- Import Market Analysis (Import Value, Volume, and Key Supplying Markets)
- Export Market Analysis (Export Value, Volume, and Key Destination Markets)
- Wholesale Price Trend Analysis and Forecast
- Regulatory Framework
- List of Key Players
- Logistic and Infrastructure
- Seasonality Analysis
- Tanzania
- North America
Detailed Research Methodology and Data Validation
Primary Research
To verify numbers and fill gaps, Mordor analysts conduct structured interviews with bean exporters in Brazil, cleaning-plant operators in North Dakota, procurement leads at Asian food manufacturers, and regional agronomists tracking seed varieties. These conversations test yield assumptions, typical farm-gate prices, and realistic loss factors before we lock the model.
Desk Research
Our analysts start by mapping global production and trade using public datasets such as FAOSTAT, UN Comtrade, USDA-ERS, Eurostat, and Brazil's IBGE, which reveal where beans are grown, shipped, and priced. We then enrich those baselines with insight from multilateral bodies (FAO, World Bank), regional farm boards, and academic journals that track yield trends, pest incidents, and dietary shifts. Financial filings, investor decks, and reputable press stories supply company-level expansion clues. Access to D&B Hoovers and Dow Jones Factiva lets us cross-check revenue ranges and news on privately held handlers. This list is illustrative; many other open and subscription sources underpin our evidence gathering.
Market-Sizing & Forecasting
A top-down production-plus-trade construct sets the first view: national output, minus on-farm seed retention and post-harvest losses, plus net imports gives the consumable pool in value and volume. We reconcile that figure with sampled bottom-up checks, processor throughput reports, and average selling price times volume snapshots in five key markets to tighten the total. Variables such as harvested acreage, average yields, farm-gate prices, per-capita bean intake, income elasticity, and plant-based diet penetration feed the model. Forecasts rely on multivariate regression blended with scenario analysis so we can stress-test for weather shocks and policy shifts flagged by interviewees.
Data Validation & Update Cycle
Before release, separate analyst teams run variance screens versus shipment data and food-balance sheets, then senior reviewers sign off. The model refreshes annually; interim updates trigger when big crop failures, tariff changes, or currency moves alter the outlook.
Why Mordor's Dry Beans Baseline Earns Trust
Published estimates often differ because firms choose dissimilar scopes, price anchors, and refresh speeds. Our disciplined selection of HS-0713 only, use of farm-gate values, and yearly updates keeps figures realistic and comparable.
Key gap drivers usually stem from others mixing canned or dehydrated formats, applying retail price multipliers, or rolling forward old production data without weather-adjusted acreage.
Benchmark comparison
| Market Size | Anonymized source | Primary gap driver |
|---|---|---|
| USD 8.90 B (2025) | Mordor Intelligence | - |
| USD 4.93 B (2024) | Global Consultancy A | Excludes informal trade flows and values only packaged retail beans |
| USD 7.25 B (2024) | Industry Association B | Omits losses and assumes uniform farm-gate pricing across regions |
| USD 15.92 B (2023) | Regional Consultancy C | Merges canned, dehydrated, and fresh beans with dry commodity totals |
Differences shown above highlight why buyers seeking a balanced, transparent starting point rely on Mordor's numbers: our scope is precise, our inputs are verified twice, and our update cadence ensures decisions rest on the latest realities.


Key Questions Answered in the Report
What is the estimated current size of the dry beans market, and what is its projected size by 2031?
The dry beans market size is estimated to reach USD 13.50 billion in 2026 and is projected to climb to USD 17.40 billion by 2031.
What is the compound annual growth rate (CAGR) projected for the dry beans market from 2026 to 2031?
The market will advance at a 5.21% CAGR from 2026 to 2031.
Which region held the largest revenue share of the dry beans market in 2025?
Asia-Pacific led with 41.2% share in 2025 due to strong production in India and sizable import demand from China and other economies.
Which geography is projected to record the fastest CAGR through 2031?
The Middle East shows the fastest growth, with a 6.8% CAGR projected through 2031 as Turkey and Iran boost output and consumption.
What are the main growth drivers of the dry beans market projected through 2031?
Rising vegan and flexitarian diets, wider pulse rotations, tariff reductions on plant proteins, carbon credit programs, and gene-edited drought-tolerant seeds all support demand.
Which pests and diseases are projected to pose the greatest threat to dry bean yields through 2031?
Halo blight, white mold, and rust diseases top the list, cutting yields by up to 50% when control measures are lacking.
Page last updated on:


