Dock And Yard Management Systems Market Size and Share
Market Overview
| Study Period | 2020 - 2031 |
|---|---|
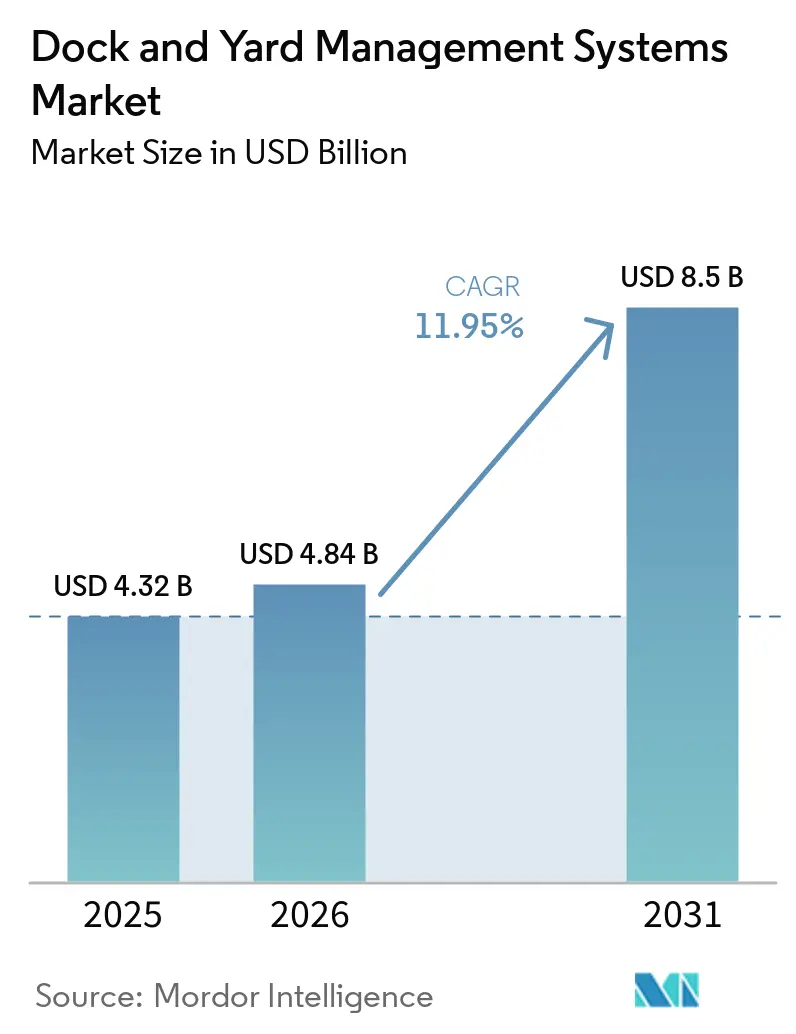
| Market Size (2026) | USD 4.84 Billion |
| Market Size (2031) | USD 8.5 Billion |
| Growth Rate (2026 - 2031) | 11.95% CAGR |
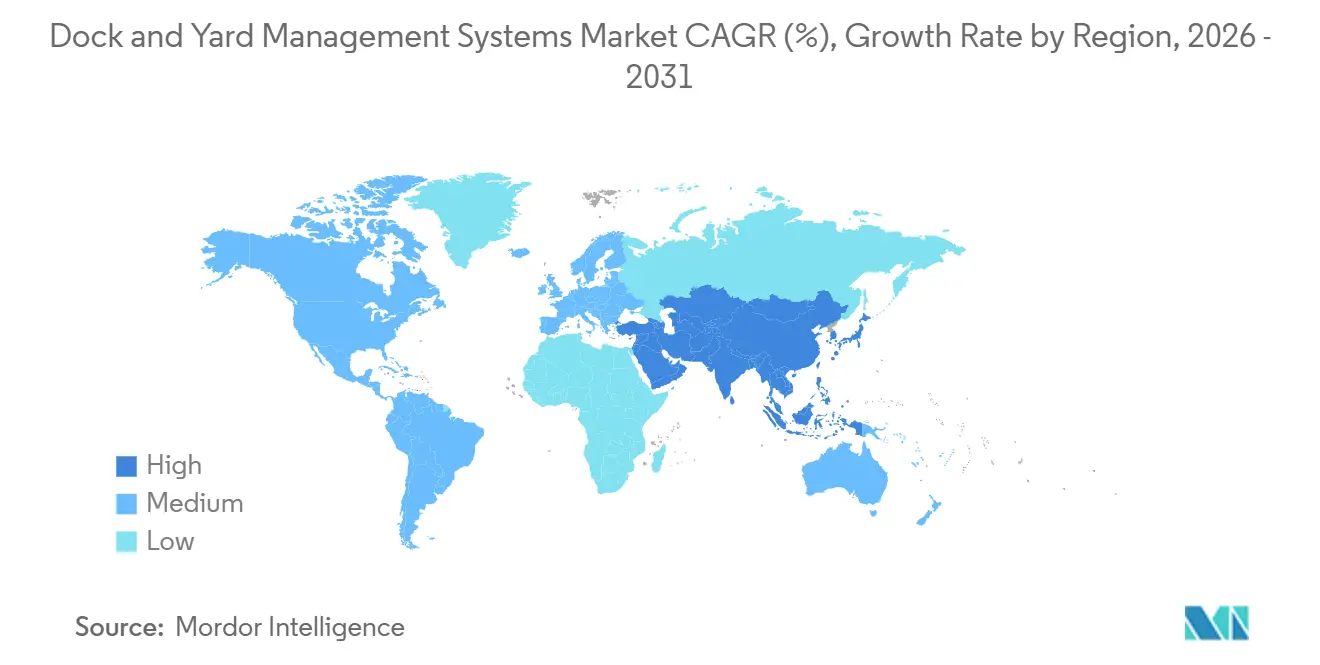
| Fastest Growing Market | Asia Pacific |
| Largest Market | North America |
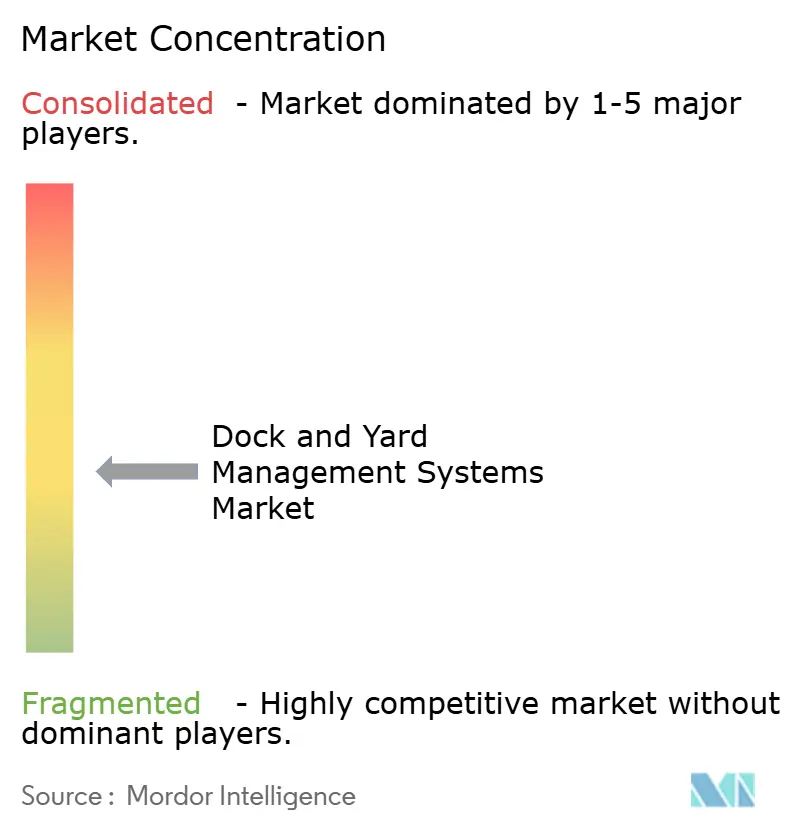
| Market Concentration | Medium |
Major Players *Disclaimer: Major Players sorted in no particular order Image © Mordor Intelligence. Reuse requires attribution under CC BY 4.0. | |
Dock And Yard Management Systems Market Analysis by Mordor Intelligence
The dock and yard management systems market size is projected to expand from USD 4.32 billion in 2025 and USD 4.84 billion in 2026 to USD 8.50 billion by 2031, registering an 11.95% CAGR between 2026 and 2031. Parcel flows surpassed 121 billion units in 2025, labor expenses in key North American hubs rose 15-20%, and large shippers are demanding sub-hour truck turn-times to avoid detention penalties that already cost carriers USD 3 billion per year. Software held 55.53% of market revenue in 2025, while services will record the fastest growth of 12.38% as buyers favor integration expertise. Cloud deployments represented 60.44% of revenues, yet hybrid models are scaling at 12.58% as operators marry low-latency gate processing with centralized analytics. Retail and e-commerce led with 28.23% of 2025 revenue, healthcare is advancing at 12.08% on cold-chain compliance needs, and North America commanded a 36.67% share, ahead of the 12.67% growth pace seen in Asia-Pacific.
Key Report Takeaways
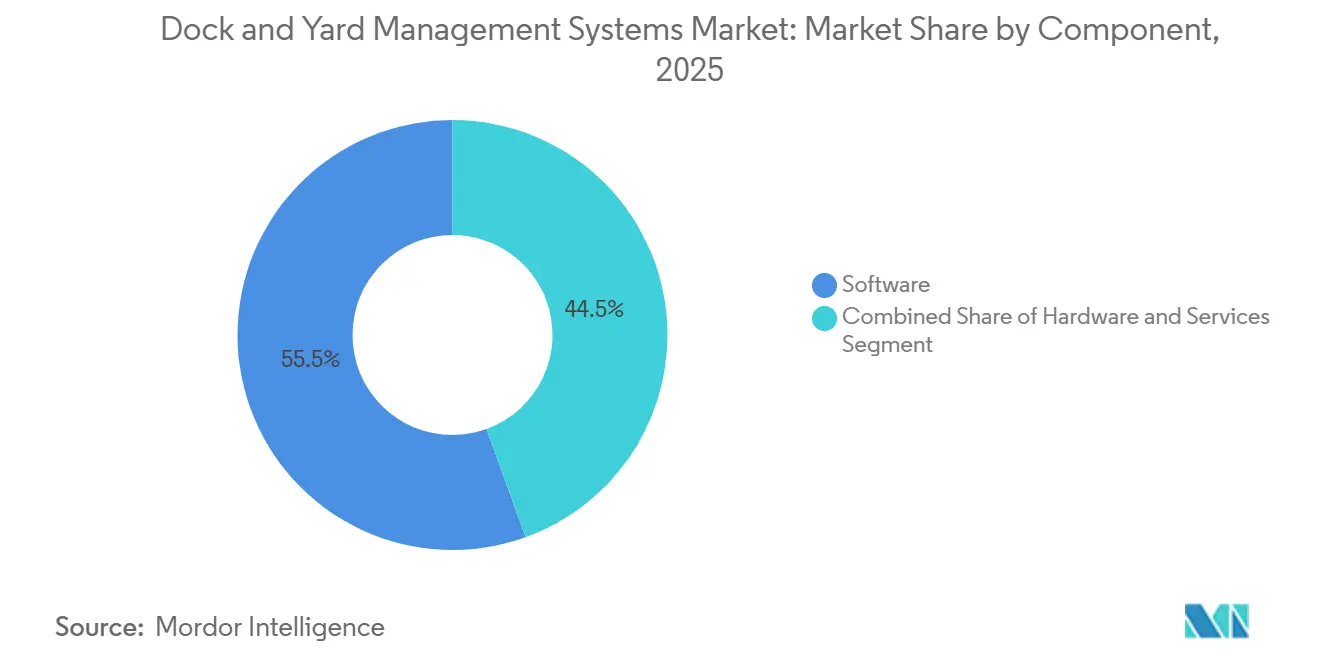
- By component, software accounted for 55.53% of 2025 revenue, while services will outpace the overall dock and yard management systems market at a 12.38% CAGR through 2031.
- By deployment mode, the cloud segment secured 60.44% of 2025 revenue, whereas hybrid solutions are projected to expand at 12.58% between 2026 and 2031.
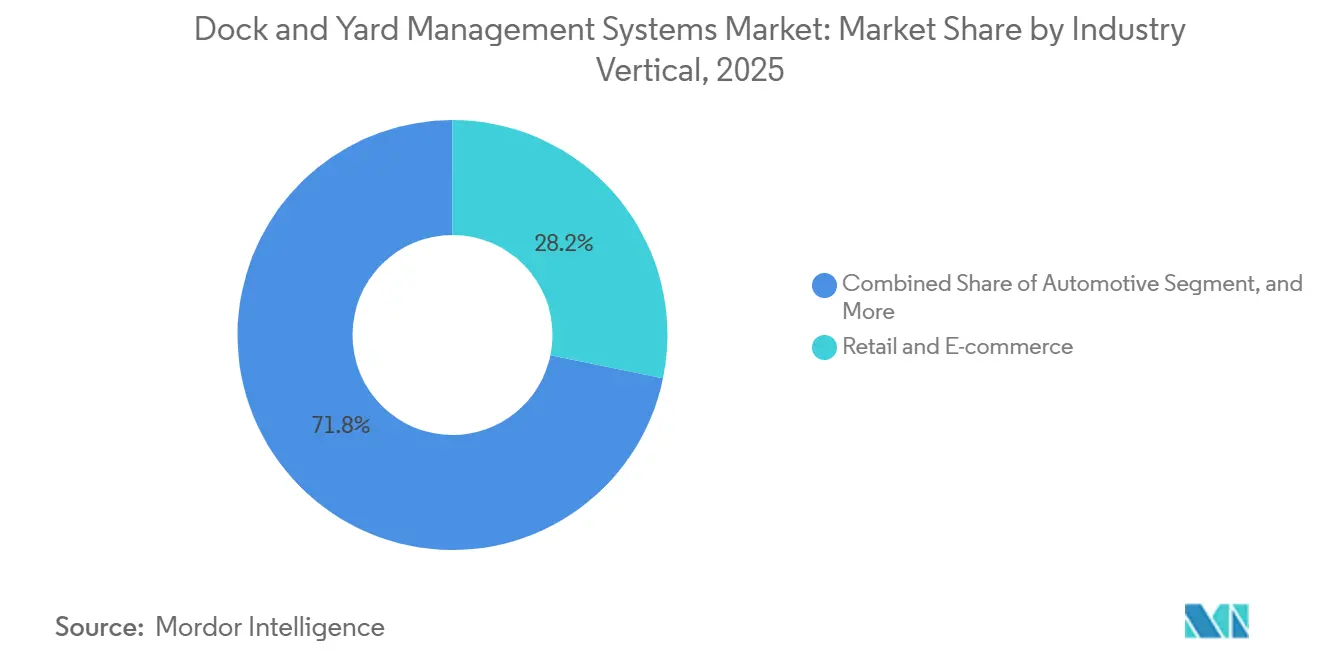
- By industry vertical, retail and e-commerce delivered 28.23% of 2025 revenue, while healthcare is set to grow at 12.08% over the forecast period.
- By application, dock door scheduling accounted for 33.10% of 2025 demand, even as analytics and reporting modules are positioned for a 12.34% CAGR through 2031.
- By geography, North America accounted for 36.67% of 2025 revenue, while Asia-Pacific is forecast to post the fastest 12.67% CAGR through 2031.
Note: Market size and forecast figures in this report are generated using Mordor Intelligence’s proprietary estimation framework, updated with the latest available data and insights as of January 2026.
Global Dock And Yard Management Systems Market Trends and Insights
Drivers Impact Analysis*
| Driver | (~) % Impact on CAGR Forecast | Geographic Relevance | Impact Timeline |
|---|---|---|---|
| Rising E-Commerce Parcel Volumes | +3.2% | Global, peak in North America and Asia-Pacific | Short term (≤ 2 years) |
| Shift to Real-Time Visibility Platforms | +2.8% | North America and Europe, expanding to Asia-Pacific | Medium term (2–4 years) |
| Adoption of Cloud-Native Supply-Chain Suites | +2.5% | Global, led by North America and Europe | Medium term (2–4 years) |
| Regulatory Push for Truck-Turn-Time Reduction | +1.9% | North America and Europe, emerging in Middle East | Long term (≥ 4 years) |
| AI-Enabled Yard Automation | +1.4% | North America, Europe, developed Asia-Pacific | Medium term (2–4 years) |
| Dock Scheduling Convergence With ESG Reporting | +0.9% | Europe and North America, early Asia-Pacific adoption | Long term (≥ 4 years) |
| Source: Mordor Intelligence | |||
Rising E-Commerce Parcel Volumes
Global parcel volume hit 121 billion units in 2025, lifting daily trailer arrivals at retail distribution centers by 30-40%. Operators are adopting dynamic dock scheduling that reallocates bays in real time using carrier GPS feeds and warehouse inventory priorities. Amazon equipped its 55 fulfillment centers opened in 2024 with robotic sortation, trimming dock-to-dispatch cycles to under 45 minutes. Walmart integrated yard modules across 4,000-plus stores, cutting perishable spoilage by 12-15%.[1]Walmart Inc., “Annual Report 2024,” WALMART.COM Same-day fulfillment norms increase detention-fee exposure, prompting shippers to adopt appointment-compliance tools that penalize late arrivals and reward early check-ins.
Shift to Real-Time Visibility Platforms
A 2025 study found 60% of North American yards still used manual check-in processes, creating blind spots that hampered inventory accuracy.[2]C3 Solutions, “2025 Yard Management Study,” C3SOLUTIONS.COM New platforms combine GPS, RFID, and computer vision so every trailer movement updates enterprise systems instantly. FourKites’ YardWorks suite slashed gate processing from up to seven minutes to 90 seconds by automating ID capture. project44 and Celonis layered process mining on shipment data to uncover dock doors with chronic 20-30% longer unload times. As visibility converges with transportation management systems, carriers receive mobile alerts that reduce no-show rates by 15-20%.
Adoption of Cloud-Native Supply-Chain Suites
Cloud architecture accounted for 78% of new warehouse-management system deployments in 2025, and yard modules are following the same path. Manhattan Associates offers Active Yard Management free to WMS subscribers while billing for implementation services. Oracle, SAP, and Blue Yonder embed yard workflows into broader suites, providing single-pane visibility from purchase order through final delivery. Hybrid models keep latency-sensitive gate logic on-premises while analytics scale in the cloud, satisfying both performance and governance mandates.
Regulatory Push for Truck-Turn-Time Reduction
Detention delays cost U.S. carriers USD 3 billion annually, triggering policy pressure to accelerate gate throughput. California SB-415 forces new warehouses above 100,000 sq ft to submit truck-routing and electrification plans, fueling demand for software that simulates emissions and dwell times. UNCTAD now lists turn-time as an official port efficiency metric, while automated container yards like DP World’s BOXBAY target sub-60-minute truck cycles. Appointment engines integrated with WMS data can cut wait times 30% when dock capacity is dynamically balanced against inbound flows.
Restraints Impact Analysis*
| Restraint | (~) % Impact on CAGR Forecast | Geographic Relevance | Impact Timeline |
|---|---|---|---|
| Legacy WMS/TMS Integration Hurdles | -2.1% | Global, most acute in North America and Europe | Short term (≤ 2 years) |
| High Up-Front Hardware Costs (RFID, Cameras) | -1.7% | Global, heavier burden for SMB operators in emerging markets | Medium term (2–4 years) |
| Cyber-Security Concerns in Connected Yards | -0.9% | North America and Europe, rising Asia-Pacific awareness | Medium term (2–4 years) |
| Shortage of In-House OT/IT Skills | -0.6% | Global, particularly North America and Europe | Long term (≥ 4 years) |
| Source: Mordor Intelligence | |||
Legacy WMS/TMS Integration Hurdles
Roughly 70% of North American warehouses still run pre-2015 WMS installations with limited APIs. Implementing yard software therefore requires custom middleware that can consume 20-30% of project budgets, extending rollouts to a year for multi-site networks. The absence of event-driven messaging in legacy TMS platforms forces vendors to poll for updates every few minutes, degrading appointment accuracy. Providers are releasing standardized connectors for top WMS suites, but long-tail custom systems continue to demand bespoke code. Industry standards such as EPCIS 2.0 promise relief, yet adoption remains slow among cost-constrained mid-tier operators.
High Up-Front Hardware Costs (RFID, Cameras)
Outfitting a 50-door facility with passive RFID tags, fixed readers, and handheld scanners can exceed USD 1 million, while industrial camera arrays may add USD 100,000-plus. Edge servers for real-time inference bring another USD 10,000-20,000 per site. Although paybacks average 18-24 months through labor savings and asset utilization gains, SMB operators often rank WMS or automation projects ahead of yard investment. Leasing models and hardware-as-a-service contracts lower barriers, yet penetration is below 10% of current deployments.[3]Honeywell, “Warehouse Automation Solutions,” HONEYWELL.COM
*Our forecasts treat driver/restraint impacts as directional, not additive. The impact forecasts reflect baseline growth, mix effects, and variable interactions.
Segment Analysis
By Component: Services Gain as Integration Complexity Mounts
Services revenue is set to outpace overall dock and yard management systems market growth, expanding 12.38% between 2026 and 2031 as enterprises lean on integrators for process mapping, API configuration, and post-go-live optimization. Software still dominated with 55.53% of 2025 turnover, thanks to recurring subscriptions, but cloud economics are compressing license margins and shifting value to expertise.
The share of hardware continues to decline because open APIs now decouple software from any one sensor brand. Manhattan Associates provides Active Yard Management at no extra license fee, monetizing via implementation and premium support. FourKites introduced managed services that monitor gate throughput and retune algorithms, while Zebra Technologies bundles installation and multi-year maintenance in operational-expense contracts.


By Deployment Mode: Hybrid Models Balance Latency and Scale
In 2025, the cloud accounted for 60.44% of the revenue, driven by shippers' preference for elastic capacity and automatic upgrades. This trend highlights the increasing reliance on cloud-based solutions to meet the dynamic demands of the shipping industry. However, hybrid architectures are experiencing significant growth, expanding at a rate of 12.58%. This growth is primarily fueled by operators who maintain on-site gate cameras and trailer-ID inference systems to ensure sub-second response times, which are critical for operational efficiency and real-time decision-making.
Pharmaceutical cold-chain yards, which must comply with the stringent requirements of FDA's 21 CFR Part 11, often store real-time data locally to preserve audit integrity. These facilities typically transmit only summarized data to the cloud during overnight hours, balancing regulatory compliance with operational efficiency. Edge computing has emerged as a key enabler in optimizing bandwidth usage. For example, a yard equipped with 50 cameras can reduce 10 TB of raw video data to just 100 GB of metadata, significantly minimizing data transfer requirements while ensuring uninterrupted operations during internet outages. Additionally, advancements in Kubernetes packaging now allow containers to operate seamlessly on-premises or within AWS environments without requiring any modifications to the underlying code, offering greater flexibility and scalability for businesses.
By Industry Vertical: Healthcare Leads Growth Amid Cold-Chain Mandates
Retail and e-commerce remained the largest buyer group, accounting for 28.23% of 2025 spend, driven by rollouts from Amazon and Walmart. Healthcare, however, will post a 12.08% CAGR through 2031 because biologics worth hundreds of thousands of dollars can spoil during yard dwell if temperatures deviate from -80 °C to +25 °C. As a result, temperature-controlled logistics solutions are becoming increasingly vital in the healthcare supply chain.
Pharmaceutical distributors adopt IoT-enabled yard software that alerts staff when cold-chain trailers are queued too long, ensuring immediate unloading. Automotive OEMs deploy appointment portals for tier-1 suppliers, as a minute's delay in a trailer can idle an assembly line, costing USD 20,000 per hour. Food and beverage processors improve freshness by sequencing deliveries with the shortest shelf life, demonstrating that compliance and perishability are equally strong motivators.
By Application: Analytics Modules Gain as ESG Reporting Intensifies
In 2025, dock door scheduling contributed significantly, accounting for 33.10% of the total revenue. This highlights its critical importance as the starting point for operations, where trailers are systematically allocated to bays to ensure efficient workflows. The analytics and reporting segment demonstrated remarkable growth, increasing by 12.34%. This growth is attributed to corporations increasingly incorporating yard dwell metrics into their Scope 3 carbon accounting frameworks, reflecting a broader commitment to sustainability and operational transparency.
Blue Yonder's advanced capabilities in predicting trailer arrivals within a 15-minute window enable organizations to optimize labor management by pre-staging workers. This proactive approach has led to a substantial reduction in idle time, ranging between 20% and 25%. Similarly, FourKites provides valuable benchmarking data on carrier dwell time, empowering shippers to negotiate waiver clauses effectively and thereby enhancing operational efficiency. Furthermore, asset-tracking modules have proven instrumental in reducing the number of "lost" trailers, thereby decreasing the capital investment required for spare equipment. Complementing these advancements, gate-automation workflows ensure that driver credentials are thoroughly verified and safety protocols are strictly enforced before unloading operations commence, thereby enhancing both security and compliance.
Geography Analysis
North America accounted for 36.67% of global 2025 revenue, bolstered by DHL’s EUR 2 billion (USD 2.26 billion) automation outlay and FedEx’s USD 5.9 billion capital program. California’s SB-415 further motivates adoption by conditioning warehouse permits on detailed truck-routing plans. The region's focus on technological advancements and regulatory measures continues to strengthen its market position.
Asia-Pacific is the fastest-growing region, with 12.67% growth, thanks to large-scale smart-warehouse investments. Amazon’s Shenzhen fulfillment center cut storage costs 45% through AI-driven slotting and yard automation, and Yamato Holdings launched a 24,900 sq m hub in India to serve e-commerce and cold-chain clients. South Korea awarded USD 66 million in robotics contracts for Daiso’s new distribution hub, showing that regional retailers are matching multinational ambition.
Europe’s adoption of Industry 4.0 programs is accelerating amid post-Brexit complexity. DP World committed EUR 170 million (USD 180 million) for BOXBAY at London Gateway to achieve sub-60-minute truck cycles, while Swisslog and Bünting are building an automated fresh-goods warehouse that merges dock scheduling with cold-chain monitoring. The Middle East and Africa benefit from Saudi Vision 2030 and the UAE's logistics-hub strategies, whereas South America remains a nascent opportunity, limited by infrastructure gaps.

Competitive Landscape
The dock and yard management systems market remains moderately fragmented, with the top five suppliers controlling roughly 35-40% of global revenue. Vendors like Manhattan Associates, Oracle, SAP, and Blue Yonder, known for their enterprise suites, enhance their broader logistics offerings by bundling yard modules to cater to the convenience of existing ERP and WMS users.
Pure-play specialists, including C3 Solutions, YardView, and Yard Management Solutions, differentiate through deep dock-workflow functionality such as dynamic appointment engines and trailer-spot optimization. Edge-ready architectures and open APIs help these challengers integrate quickly with legacy systems. The market is expected to grow steadily over the forecast period, driven by rising demand for efficient logistics operations.
Innovation centers on computer vision and predictive analytics. Blue Yonder and FourKites each automate trailer identification, cutting manual gate checks 85% and improving throughput. Zebra Technologies merged its MotionWorks Yard hardware with FourKites’ software to deliver end-to-end asset visibility. New entrants like Terminal Industries and Peripass target underserved SMB and mid-tier manufacturers with subscription pricing under USD 500 per month, illustrating room for niche disruption in segments still reliant on spreadsheets.
Dock And Yard Management Systems Industry Leaders
Manhattan Associates Inc.
Oracle Corporation
SAP SE
Blue Yonder Group, Inc.
C3 Solutions Inc.
- *Disclaimer: Major Players sorted in no particular order

Recent Industry Developments
- February 2026: Doosan Logistics Solutions won a USD 113 million automation contract for Daiso’s South Korean hub, integrating AS/RS and dock-door scheduling to lift throughput 40%.
- January 2026: MOL invested SGD 260 million (USD 195 million) to develop OMEGA 1, a 24-story automated warehouse in Singapore that includes real-time yard software.
- January 2026: SFA secured a 90 billion won (USD 66 million) deal to deploy AI robots and camera-based trailer ID at another Daiso center, promising 30% dock-throughput gains.
- January 2026: Yamato Holdings opened a 24,900 sq m logistics center in India with automated sortation and dock scheduling to process 10,000 parcels per hour.


Global Dock And Yard Management Systems Market Report Scope
Dock and Yard Management Systems facilitate the efficient movement, scheduling, and tracking of trucks, trailers, and goods within distribution centers, warehouses, and manufacturing facilities. By integrating real-time data, automation, and analytics, these systems enhance operational visibility, optimize dock utilization, minimize congestion, and improve overall supply chain efficiency.
The Dock and Yard Management Systems Market Report is Segmented by Component (Software, Hardware, and Services), Deployment Mode (On-Premises, and Cloud, Hybrid), Industry Vertical (Retail and E-Commerce, Food and Beverages, Automotive, Pharmaceutical and Healthcare, Manufacturing and 3PL, and More), Application (Dock Door Scheduling, Yard Asset and Trailer Management, Gate and Security Operations, Labor and Resource Management, and Analytics and Reporting), and Geography (North America, Europe, Asia-Pacific, Middle East and Africa, and South America). The Market Forecasts are Provided in Terms of Value (USD).
| Software |
| Hardware |
| Services |
| On-Premises |
| Cloud |
| Hybrid |
| Retail and E-Commerce |
| Food and Beverages |
| Automotive |
| Pharmaceutical and Healthcare |
| Manufacturing and 3PL |
| Rest of Industry Vertical |
| Dock Door Scheduling |
| Yard Asset and Trailer Management |
| Gate and Security Operations |
| Labor and Resource Management |
| Analytics and Reporting |
| North America | United States | |
| Canada | ||
| Mexico | ||
| Europe | Germany | |
| United Kingdom | ||
| France | ||
| Russia | ||
| Rest of Europe | ||
| Asia-Pacific | China | |
| Japan | ||
| India | ||
| South Korea | ||
| Australia | ||
| Rest of Asia-Pacific | ||
| Middle East and Africa | Middle East | Saudi Arabia |
| United Arab Emirates | ||
| Rest of Middle East | ||
| Africa | South Africa | |
| Egypt | ||
| Rest of Africa | ||
| South America | Brazil | |
| Argentina | ||
| Rest of South America | ||
| By Component | Software | ||
| Hardware | |||
| Services | |||
| By Deployment Mode | On-Premises | ||
| Cloud | |||
| Hybrid | |||
| By Industry Vertical | Retail and E-Commerce | ||
| Food and Beverages | |||
| Automotive | |||
| Pharmaceutical and Healthcare | |||
| Manufacturing and 3PL | |||
| Rest of Industry Vertical | |||
| By Application | Dock Door Scheduling | ||
| Yard Asset and Trailer Management | |||
| Gate and Security Operations | |||
| Labor and Resource Management | |||
| Analytics and Reporting | |||
| By Geography | North America | United States | |
| Canada | |||
| Mexico | |||
| Europe | Germany | ||
| United Kingdom | |||
| France | |||
| Russia | |||
| Rest of Europe | |||
| Asia-Pacific | China | ||
| Japan | |||
| India | |||
| South Korea | |||
| Australia | |||
| Rest of Asia-Pacific | |||
| Middle East and Africa | Middle East | Saudi Arabia | |
| United Arab Emirates | |||
| Rest of Middle East | |||
| Africa | South Africa | ||
| Egypt | |||
| Rest of Africa | |||
| South America | Brazil | ||
| Argentina | |||
| Rest of South America | |||


Key Questions Answered in the Report
What is the dock and yard management systems market size in 2026?
The dock and yard management systems market size stands at USD 4.84 billion in 2026.
Which component segment is growing fastest?
Services will post the strongest 12.38% CAGR through 2031 as companies seek integration, training, and continuous optimization support.
Which region offers the highest growth potential?
Asia-Pacific is forecast to expand at a 12.67% CAGR, led by large-scale smart-warehouse investments in China, India, Japan, and South Korea.
How are analytics modules creating value?
Analytics and reporting software links yard dwell to Scope 3 carbon metrics, allowing shippers to cut idle time and negotiate carrier performance clauses.
Who are the notable emerging players?
Terminal Industries and Peripass disrupt the mid-tier and SMB segments with subscription models priced below USD 500 per month.
What is the main barrier for small operators?
High up-front hardware costs for RFID and computer-vision systems can exceed USD 1 million for a mid-size facility, delaying adoption despite attractive payback periods.
Page last updated on:


