Containerization Software Market Size and Share
Market Overview
| Study Period | 2020 - 2031 |
|---|---|
| Market Size (2026) | USD 11.05 Billion |
| Market Size (2031) | USD 24.20 Billion |
| Growth Rate (2026 - 2031) | 16.97% CAGR |
| Fastest Growing Market | Asia-Pacific |
| Largest Market | North America |
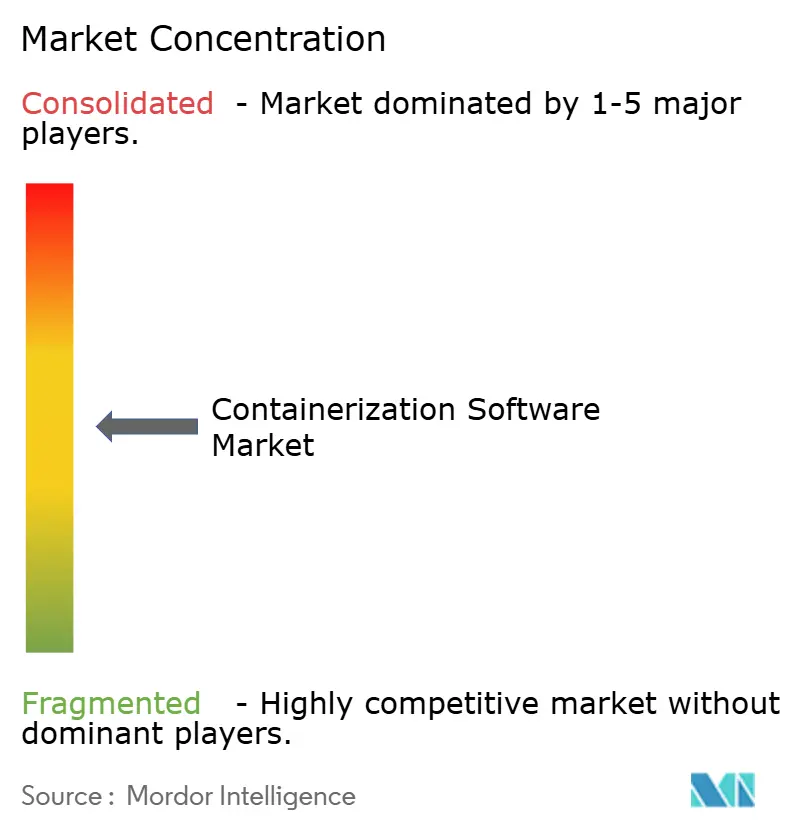
| Market Concentration | Medium |
Major Players *Disclaimer: Major Players sorted in no particular order Image © Mordor Intelligence. Reuse requires attribution under CC BY 4.0. | |
Containerization Software Market Analysis by Mordor Intelligence
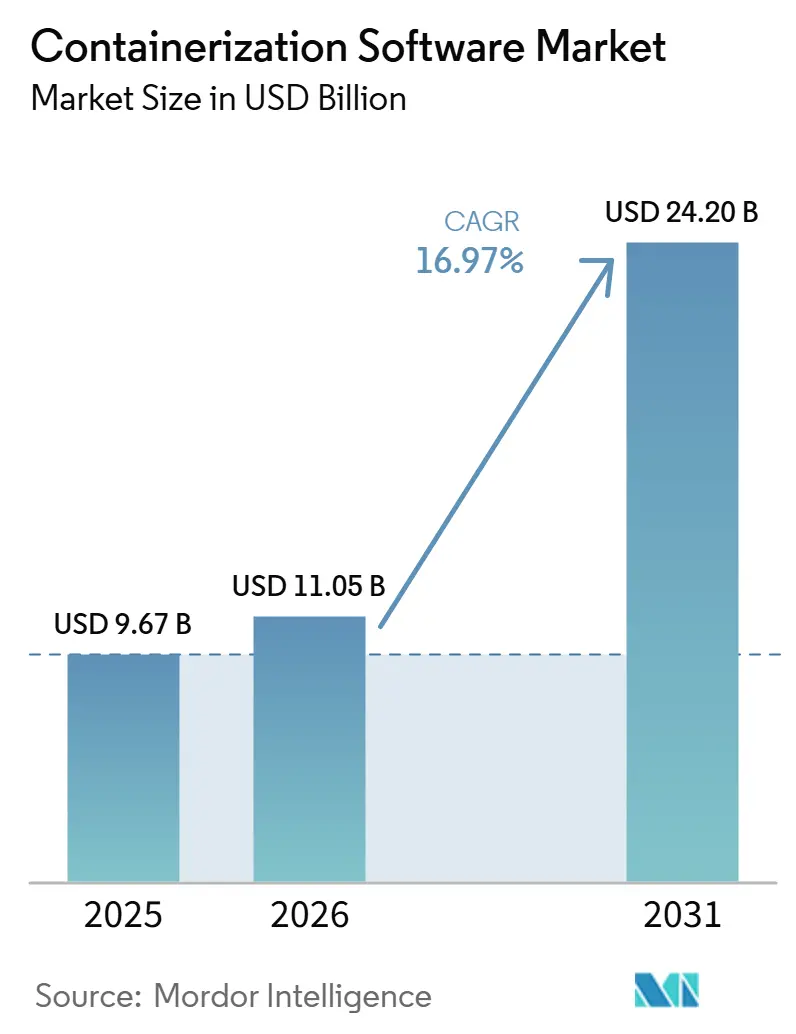
The containerization software market size is projected to be USD 9.67 billion in 2025, USD 11.05 billion in 2026, and reach USD 24.2 billion by 2031, growing at a CAGR of 16.97% from 2026 to 2031. The containerization software market is expanding because containers are now central to cloud-native operations, AI inference environments, and platform governance across large enterprises. Growth is being supported less by first-time adoption and more by deeper spending on observability, policy control, runtime security, and standardized developer workflows. The containerization software market is also benefiting from the push to run AI workloads across mixed infrastructure, where portability, reproducibility, and cluster-level resource management matter more than simple infrastructure abstraction. At the same time, buyers are placing more value on hybrid control, sovereign deployment options, and certified enterprise distributions that reduce operational risk in regulated environments. Near-term expansion remains strong, although skills shortages and a rising container attack surface continue to raise execution costs for organizations with less mature platform engineering and security practices.
Key Report Takeaways
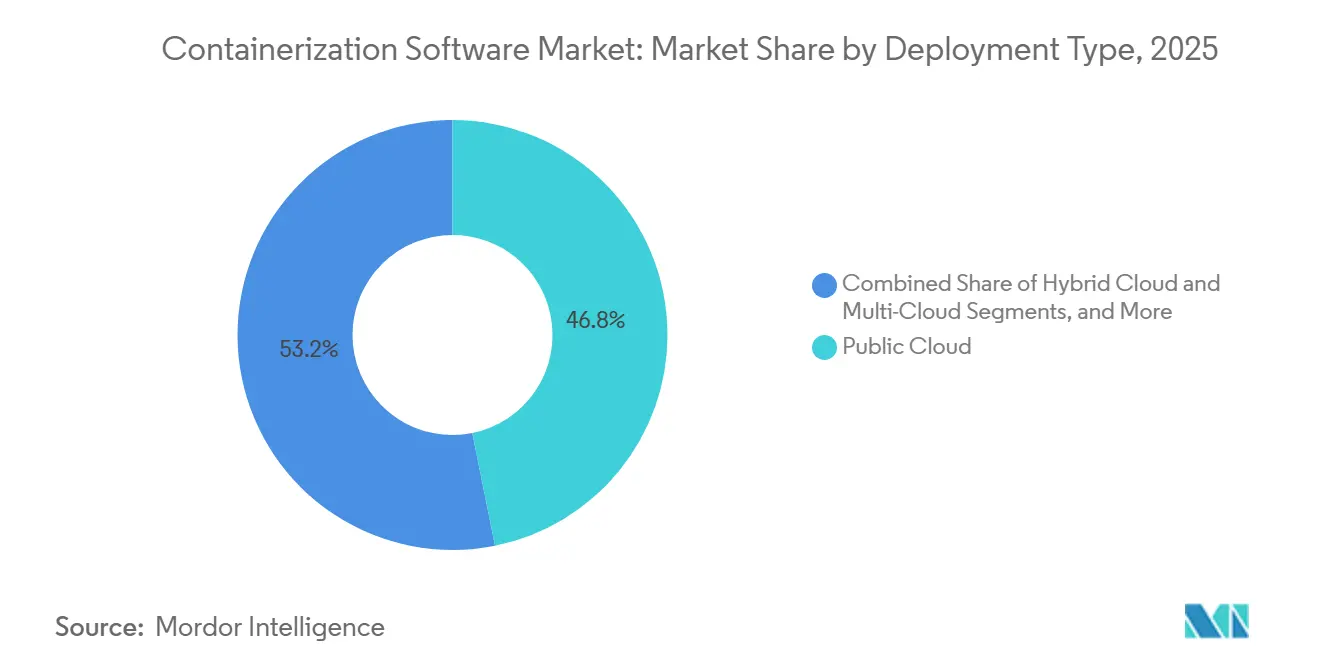
- By deployment type, public cloud held 46.83% of the containerization software market share in 2025, while multi-cloud is projected to expand at a 19.62% CAGR through 2031.
- By platform, Kubernetes held 42.18% of the containerization software market share in 2025, while Azure Kubernetes Service is projected to grow at a 22.14% CAGR through 2031.
- By container type, application containers accounted for 79.46% share in 2025, while unikernels are expected to expand at a 22.73% CAGR through 2031.
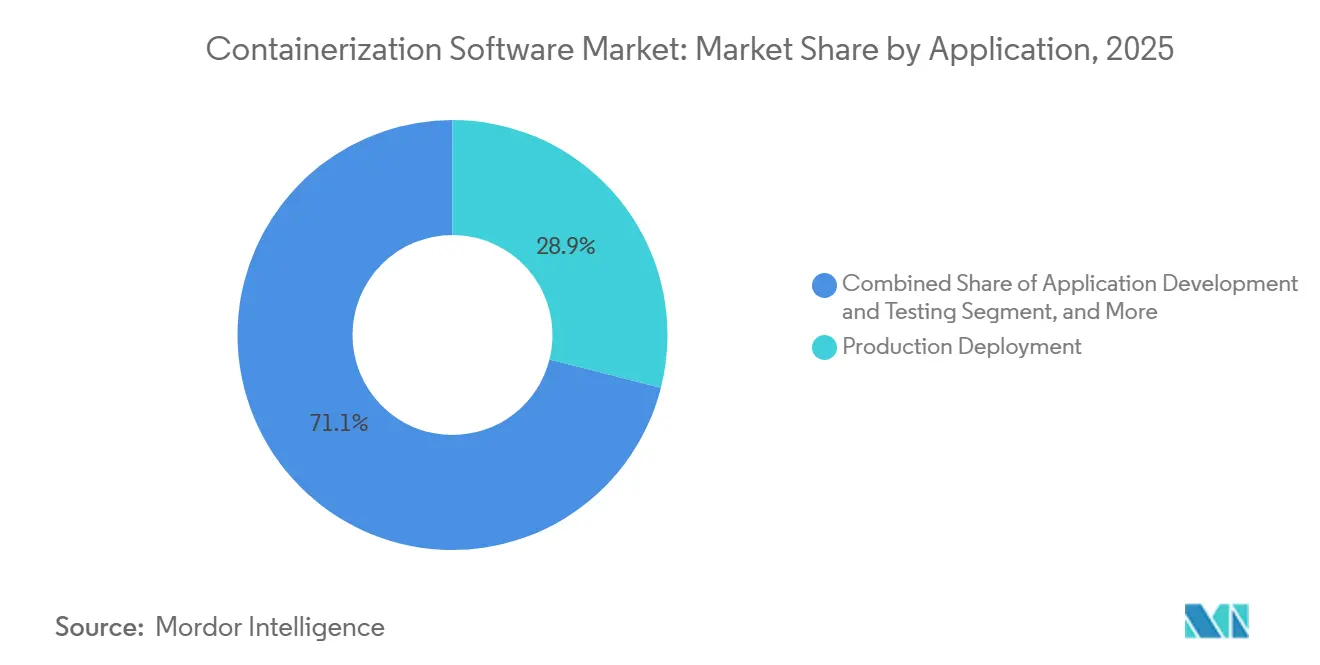
- By application, production deployment accounted for 28.94% in 2025, while AI and ML model deployment is projected to grow at a 24.88% CAGR through 2031.
- By end user, IT and telecommunications held 29.87% share in 2025, while healthcare and life sciences are projected to advance at a 19.94% CAGR through 2031.
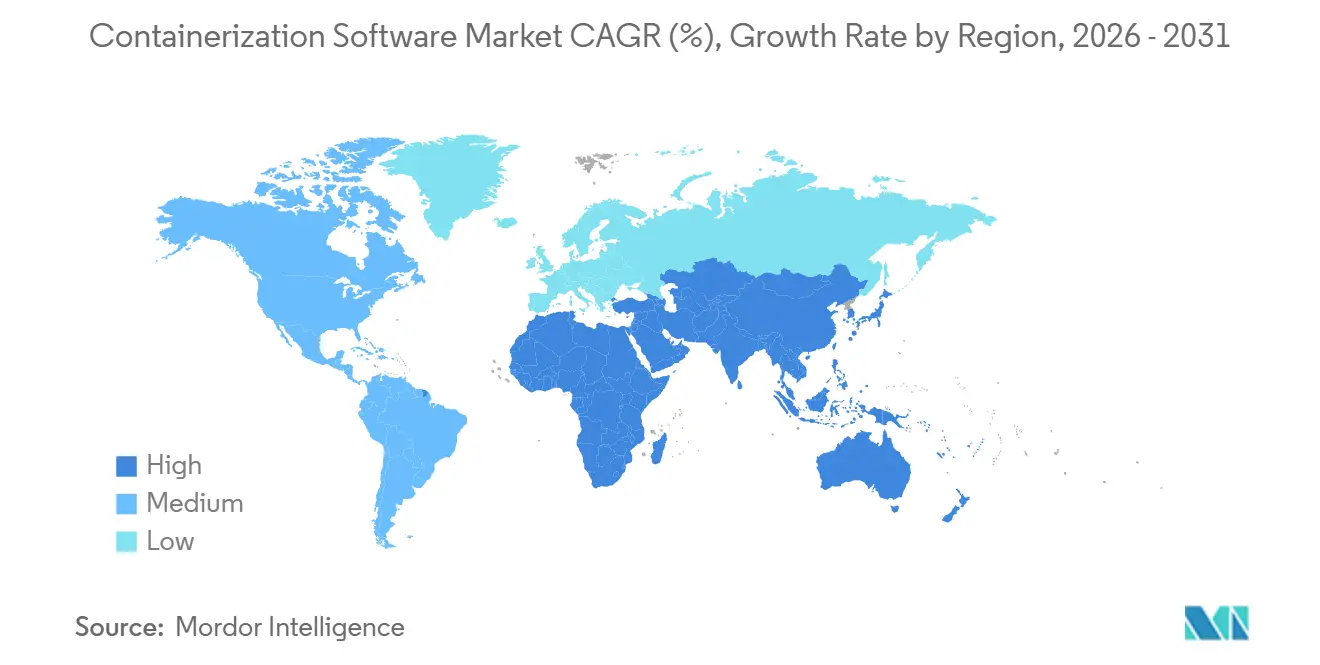
- By geography, North America held 39.84% of the containerization software market share in 2025, while Asia-Pacific is projected to expand at a 19.73% CAGR through 2031.
Note: Market size and forecast figures in this report are generated using Mordor Intelligence’s proprietary estimation framework, updated with the latest available data and insights as of January 2026.
Global Containerization Software Market Trends and Insights
Drivers Impact Analysis*
| Driver | (~) % Impact on CAGR Forecast | Geographic Relevance | Impact Timeline |
|---|---|---|---|
| Cloud-Native Migration Across Enterprise Workloads | +4.2% | Global, led by North America and Europe | Short term (≤ 2 years) |
| AI And ML Workload Containerization | +3.5% | Global, the highest intensity in North America and the Asia-Pacific | Short term (≤ 2 years) |
| DevOps And CI/CD Standardization | +2.8% | Global, with the deepest penetration in North America and Western Europe | Medium term (2-4 years) |
| Platform Engineering Adoption in Large Enterprises | +1.8% | North America, Europe, and East Asia | Medium term (2-4 years) |
| Sovereign Cloud and Hybrid Control Requirements | +1.4% | Europe, the Middle East, and South and Southeast Asia | Medium term (2-4 years) |
| Runtime Economics Shift Toward Usage-Based Platform Pricing | +0.9% | Global, with early traction in North America and Europe | Long term (≥ 4 years) |
| Source: Mordor Intelligence | |||
Cloud-Native Migration Across Enterprise Workloads
Enterprise modernization has moved past trial activity, and the containerization software market now reflects the need to make large-scale container use sustainable across production estates. The CNCF 2025 Annual Cloud Native Survey found that 56% of organizations used containers for most or all production applications in 2025, while only 6% remained in pilot mode. This changes spending patterns inside the containerization software market because enterprises that already containerized core workloads now need stronger telemetry, policy enforcement, cost attribution, and governance layers. Portworx reported in 2026 that 74% of organizations planned to modernize or migrate workloads, and Kubernetes was identified as the preferred long-term host platform for many of those estates. That migration path supports the containerization software market by linking legacy virtualization transformation programs with demand for modern orchestration, governance, and platform services.
AI And ML Workload Containerization
AI inference and model operations are making containers a core deployment method rather than a secondary packaging option within the containerization software market. The CNCF survey found that 66% of organizations hosting generative AI models used Kubernetes for some or all inference workloads in 2025. Nutanix reported in January 2026 that 82% of surveyed executives said their current on-premises infrastructure was not fully ready to support AI workloads, which is pushing upgrade cycles toward containerized AI platforms. Amazon Web Services expanded Amazon EKS in July 2025 to support up to 100,000 worker nodes per cluster, which it said could scale to 800,000 NVIDIA GPUs. That scale matters for the containerization software market because AI buyers increasingly want portability, version control, and reproducible runtime behavior across large compute environments.
DevOps and CI/CD Standardization
The containerization software market continues to benefit from the fact that DevOps pipelines have become the primary path for new workloads to enter production. The CNCF State of Cloud Native Development Q1 2026 report found that 88% of backend developers worked in standardized DevOps and platform environments, and that there were nearly 20 million cloud-native developers worldwide. As those teams standardize software delivery, they also create stronger internal demand for internal developer platforms that rely on container-based workflows, curated images, and repeatable deployment patterns. OWASP included software supply chain failures as A03 in its 2025 Top 10, underscoring the importance of SBOM support and container image controls within CI and CD pipelines. This favors the containerization software market because standard delivery pipelines now require not only orchestration but also compliance-aware image management and traceability.
Platform Engineering Adoption in Large Enterprises
Large enterprises are formalizing platform engineering, creating a more durable buyer base for the containerization software market. The CNCF State of Platform Engineering Report showed that 55% of organizations had adopted platform engineering by 2025, and those teams typically represented 2%-6% of total engineering headcount. The same report indicated that major enterprises were committing USD 5-10 million each year to platform engineering programs, while only 25% rated their platforms as mature. This means many organizations are still building the internal product layer that developers use to consume Kubernetes, governance, policy controls, and deployment templates. That change supports the containerization software market because vendor decisions now depend more on developer experience, release consistency, and governance outcomes than on raw infrastructure cost alone.
Restraints Impact Analysis*
| Restraint | (~) % Impact on CAGR Forecast | Geographic Relevance | Impact Timeline |
|---|---|---|---|
| Kubernetes Skills Shortage and Platform Complexity | -2.3% | Global, most acute in South America, Africa, and Southeast Asia | Short term (≤ 2 years) |
| Container Security and Supply Chain Risk Exposure | -1.9% | Global, most acute in Europe and North America due to regulatory scrutiny | Medium term (2-4 years) |
| Legacy Application Constraints and VM Stickiness | -1.4% | Global, highest in BFSI and government sectors in Asia-Pacific and Europe | Medium term (2-4 years) |
| Fragmented Tooling and Integration Overhead | -0.9% | Global, with the highest complexity in multi-cloud and hybrid deployments | Long term (≥ 4 years) |
| Source: Mordor Intelligence | |||
Kubernetes Skills Shortage and Platform Complexity
The containerization software market still faces a talent bottleneck because production container estates now require deeper engineering than just basic cluster administration. The CNCF State of Platform Engineering Report found that large organizations were already spending USD 5-10 million annually on platform engineering, yet only 25% considered their platforms mature.[1]Cloud Native Computing Foundation, “State of Platform Engineering,” Cloud Native Computing Foundation, cncf.io That gap shows why delivery timelines often slow once container programs expand from web applications into AI scheduling, policy controls, and internal developer platforms. The problem is more acute in environments that need GPU-aware orchestration, deeper security controls, and mixed infrastructure operations across cloud and on-premises estates. As a result, the containerization software market continues to grow, but less mature buyers face higher execution risk, longer rollout cycles, and rising ownership costs.
Container Security and Supply Chain Risk Exposure
Security remains a meaningful drag on the containerization software market because runtime protection and software provenance are now operational requirements rather than optional add-ons. Three critical run-time vulnerabilities, CVE-2025-31133, CVE-2025-52565, and CVE-2025-52881, were disclosed in November 2025 and demonstrated that container escapes via procfs write manipulation were still possible in widely used environments. OWASP classified software supply chain failures as A03 in its 2025 Top 10, which raised the compliance importance of image verification, SBOM coverage, and dependency governance. Red Hat responded in February 2026 with a contextual SBOM pattern that traced package provenance across container image hierarchies, but uneven adoption means many organizations still lack consistent controls. This slows the containerization software market in some accounts because buyers must fund security tooling, validation processes, and attestation workflows before scaling production deployments.
*Our forecasts treat driver/restraint impacts as directional, not additive. The impact forecasts reflect baseline growth, mix effects, and variable interactions.
Segment Analysis
By Deployment Type: Public Cloud Anchors Spend as Multi-Cloud Rewires Architectures
Public cloud accounted for 46.83% of the containerization software market in 2025, indicating that managed services still account for the largest share of current spending. Public cloud platforms remain attractive because AWS EKS and ECS, Azure AKS, and Google GKE remove much of the infrastructure burden that enterprise teams would otherwise carry in-house. That value becomes stronger when organizations want AI-ready environments with integrated observability, policy controls, and scalable runtime services. Amazon said in June 2026 that SageMaker AI could cut the time to scale out generative AI inference by up to half through automatic container image caching, underscoring the operational advantages of managed cloud environments for inference-heavy workloads. The containerization software industry still keeps meaningful on-premises demand in regulated sectors where sovereignty, latency, or internal control requirements limit public cloud placement.
On-premises deployments remain important for government, healthcare, and other tightly regulated use cases because sensitive workloads often need stricter control over data location and runtime configuration. Hybrid cloud supports those buyers by connecting controlled environments with elastic infrastructure when burst capacity or workload balancing becomes necessary. The containerization software market also benefits from hybrid demand because Kubernetes gives enterprises a common control plane across mixed estates, which reduces rework during application movement. Unikernels and system containers are gaining attention in hybrid edge settings where smaller footprints and tighter isolation are valued over broad feature depth. Multi-cloud is projected to grow at a 19.62% CAGR through 2031, and that pace reflects deliberate architecture choices aimed at portability and lower dependency on any single hyperscaler. Buyers are not adopting multi-cloud only for resilience, they are also using standardized container APIs to preserve freedom of deployment as sovereignty and governance requirements become stricter.


By Platform: Kubernetes Dominates as Managed Services Compete on AI Differentiation
Kubernetes held 42.18% of the containerization software market share in 2025, which confirms its role as the standard orchestration layer across enterprise container environments. The CNCF survey found that 82% of container users ran Kubernetes in production in 2025, which reinforces how deeply the platform is embedded in modern software delivery. The same survey reported that 66% of organizations used Kubernetes for some or all of their generative AI inference workloads, tying the platform directly to rising AI infrastructure demand. Docker remains important at the build and development layer, while Amazon ECS serves teams that want AWS-native container management without the full operational complexity of Kubernetes. Google Kubernetes Engine continues to stand out among buyers seeking closer alignment with TPU and NVIDIA GPU infrastructure, keeping competition active even within a Kubernetes-led platform segment.
Azure Kubernetes Service is projected to grow at a 22.14% CAGR through 2031, making it the fastest-growing platform in the containerization software market. Microsoft stated at Red Hat Summit 2026 that AKS was running OpenAI and Anthropic workloads on clusters that scaled to 75,000 nodes, and it also highlighted bare-metal AKS configurations that enabled direct NVLink and RDMA access for demanding AI training environments. That positioning matters because platform competition is moving away from basic orchestration and toward AI-native scheduling, performance tuning, and integrated observability. The other platform group, including Mirantis k0s, SUSE K3s, and Canonical MicroK8s, remains relevant in edge, air-gapped, and lightweight environments where full-scale distributions are harder to justify. As a result, the containerization software market is becoming more differentiated at the platform level even though Kubernetes remains the common operating base across most enterprise deployments.
By Container Type: Application Containers Dominate While Unikernels Gain in Security-Focused Environments
Application containers held a 79.46% share in 2025, indicating they remain the standard format for packaging microservices, APIs, and other stateless workloads across the containerization software market. Their lead is supported by mature tooling, broad ecosystem support, and steady investment in hardened base images and curated packages. Docker expanded its hardened system package offering to more than 8,000 Alpine packages in March 2026, reflecting continued demand for smaller, more secure application container foundations.[2]Docker, “Docker Hardened System Packages,” Docker, docker.com System containers continue to serve use cases that require operating system-level isolation without full virtualization, while hypervisor containers such as Kata Containers and gVisor address environments where standard container isolation is insufficient. That combination keeps the segment broad, but the spending center of gravity still lies with application containers because they align with the dominant software delivery model used across enterprises.
Unikernels are projected to grow at a 22.73% CAGR through 2031, making them the fastest-growing container type in the containerization software market. Their appeal is strongest where buyers want minimal attack surfaces, deterministic execution, and single-purpose runtime images for edge or sensitive AI inference workloads. The November 2025 runc breakout disclosures reinforced the value of reduced system call exposure, which gives additional relevance to execution models that narrow the underlying attack surface. Adoption is still constrained by a less mature developer toolchain than mainstream containers, so unikernels remain a high-growth but smaller-volume segment. Even with that limitation, demand from defense, critical infrastructure, and financial services keeps the category strategically important because those buyers often prioritize isolation and control over ease of operation.
By Application: Production Deployment Leads as AI And ML Workloads Change the Mix
Production deployment accounted for 28.94% of the containerization software market in 2025, reflecting its role as the primary runtime for the broader application stack. Development, testing, cloud migration, and CI/CD automation all feed into production, keeping this segment at the center of current enterprise spending. The containerization software market also sees strong support from microservices management and DevOps workflow standardization, as these tasks rely on repeatable images, orchestrated releases, and consistent runtime behavior. Edge computing and IoT containerization are building momentum as lightweight Kubernetes distributions make it easier to manage workloads on constrained hardware. This application mix shows that containers are no longer confined to software teams alone, because the same operating model is now being used across data, edge, and business-critical production environments.
AI and ML model deployment is projected to grow at a 24.88% CAGR through 2031, making it the fastest-growing application segment in the containerization software market. The CNCF survey found that only 7% of organizations deployed AI models daily in 2025, while 47% did so occasionally, suggesting that many teams are still early in the operational cycle and have room to scale frequency and standardization. That pattern points to further demand for reproducible model packaging, environment consistency, and cluster-based resource scheduling as AI moves deeper into enterprise production. Big data and analytics workloads are also growing as organizations containerize Spark, Flink, and Ray clusters for efficiency and repeatability, although their expansion remains slower than AI and ML deployment. The containerization software market therefore keeps broad application diversity, but AI deployment is now reshaping where the fastest incremental demand is forming.
By End User: IT And Telecommunications Leads Current Spend While Healthcare Accelerates Fastest
IT and telecommunications accounted for 29.87% of the containerization software market share in 2025, which made the segment the largest end-user contributor by current spending. The sector benefits from mature DevOps practices, network function virtualization programs, and a long history of cloud-native software development, all of which fit well with container-based delivery models. BFSI follows as another major buyer group because digital banking platforms, trading systems, and reporting workloads benefit from repeatable deployment and stronger version control. Government adoption is also moving forward in North America and Europe, as zero-trust policies and platform engineering mandates align with containerized operating models. These patterns keep IT and telecommunications at the center of current demand because the segment already has both the technical maturity and the workload intensity needed to sustain large-scale container use.
Healthcare and life sciences are projected to expand at a 19.94% CAGR through 2031, making it the fastest-growing end-user segment in the containerization software market. Nutanix reported in July 2025 that 86% of healthcare IT leaders said AI was accelerating container adoption, 81% expected containerization levels to increase, and 99% said their organizations were at least in the process of containerizing applications. That growth is linked to the need to move clinical AI and software-defined care workloads from centralized data centers toward bedside and point-of-care environments with consistent runtime controls. HIPAA data security requirements and US Food and Drug Administration guidance for software as a medical device add compliance pressure that favors auditable and repeatable deployment environments. Manufacturing, industrial automation, energy, and utilities are also moving upward as industrial IoT workloads shift toward containerized edge platforms, although those markets remain smaller in absolute terms than BFSI and healthcare.
Geography Analysis
North America held a 39.84% share in 2025, making it the largest regional block in the containerization software market. The region benefits from the deepest concentration of hyperscaler infrastructure, enterprise software buyers, and platform engineering talent. The United States remains the clear anchor because most leading managed Kubernetes, developer tooling, and enterprise platform suppliers have significant operational depth there. The CNCF survey continued to show strong production Kubernetes maturity in this region in 2025, which supports sustained demand for higher-value tooling rather than just core orchestration. Canada and Mexico add support through financial services modernization and the adoption of manufacturing-linked container technology, broadening the region beyond the United States alone.
Asia-Pacific is projected to grow at a 19.73% CAGR through 2031, making it the fastest-growing region in the containerization software market. A Linux Foundation Japan report published in May 2025 found that 91% of surveyed Japanese enterprises used containers in production, indicating strong operational maturity in one of the region's most advanced enterprise markets.[3]Linux Foundation Japan, “Cloud Native 2024, A Decade of Code, Cloud, and Transformation,” Linux Foundation Japan coverage, atmarkit.itmedia.co.jp India is gaining momentum through the large-scale expansion of data centers and cloud infrastructure, while China continues to emphasize sovereign registries and domestic Kubernetes development. Japan, South Korea, and Australia contribute more mature demand, while India, Indonesia, and Vietnam support high-growth adoption built on newer digital infrastructure layers. That mix keeps Asia-Pacific central to future growth because it combines mature enterprise use cases with newer buildouts that are less constrained by older virtualization estates.
Europe, the Middle East, and Africa present a more mixed profile across the containerization software market. Western Europe continues to be led by Germany, the United Kingdom, and France, where enterprise modernization and compliance-led cloud programs remain active. The Middle East is recording stronger momentum as sovereign cloud investments support government and energy workloads that need controlled deployment environments. South America remains the smallest regional opportunity, but Brazil and Argentina continue to benefit from digital transformation in financial services and media. Africa is still at an early stage, with South Africa and Nigeria acting as entry points as enterprise cloud infrastructure expands and creates a broader base for containerized deployments.

Competitive Landscape
The containerization software market is moderately concentrated, with an upper tier led by hyperscalers such as AWS, Microsoft, and Google, which combine managed Kubernetes with AI compute, observability, and developer tooling. Their strength lies in selling integrated operating environments rather than isolated container services, which raises switching costs once enterprises standardize on a preferred stack. Below that top tier, Red Hat, SUSE, Mirantis, and Canonical compete more directly on hybrid portability, open-source alignment, and enterprise control. The containerization software market also remains open enough for specialist providers to gain traction in security, service mesh, and lightweight edge distributions. That balance creates a landscape where scale matters, but focused products can still influence specific parts of the platform stack.
Several strategic moves in 2026 showed that vendors are trying to expand their roles in enterprise container operations. IBM and Red Hat committed USD 5 billion to Project Lightwell in May 2026 to strengthen trust in open-source software across the full production stack, positioning supply chain assurance as a competitive lever rather than a support feature.[4]IBM, “IBM and Red Hat Commit USD 5 Billion to Redefine the Future of Open Source in the AI Era,” IBM Newsroom, newsroom.ibm.com Docker announced the general availability of Docker Offload in April 2026, moving the container engine into Docker's managed cloud so developers in restricted environments could still run container workflows without relying on local virtualization. Broadcom released VMware vSphere Kubernetes Service 3.7 in June 2026 with Kubernetes 1.36 support, CNCF certification, automated compliance tools, and a reworked add-on framework, showing that infrastructure incumbents are still defending the on-premises enterprise base.
Competition is also shifting toward platform depth in AI and security rather than broad claims about orchestration alone. Cisco introduced Cloud Control in June 2026 as a unified platform for human and AI agent management of critical IT infrastructure, which extends the contest into runtime control and automated operations. HPE launched fourth-generation private cloud systems in May 2026 with Kubernetes-based unified management for virtual machines and containers on one platform, which strengthens the case for container-led modernization inside controlled enterprise environments. In this environment, the containerization software market is being shaped by vendors that can combine AI-ready scaling, hybrid deployment control, and trusted software supply chains in a single operating model. That is why the strongest positions are being built by companies that connect orchestration, security, and developer productivity instead of treating them as separate product layers.
Containerization Software Industry Leaders
Docker, Inc.
Red Hat, Inc.
Amazon Web Services, Inc.
Microsoft Corporation
Google LLC
- *Disclaimer: Major Players sorted in no particular order

Recent Industry Developments
- June 2026: IBM, Red Hat, and Deloitte announced a collaboration under Project Lightwell to strengthen trust in the open-source software supply chain across enterprise production environments. The collaboration leverages Deloitte's enterprise advisory reach to extend the Project Lightwell framework, backed by IBM and Red Hat's USD 5 billion commitment, into Fortune 500 adoption programs.
- June 2026: Amazon announced an additional USD 13 billion investment in India's AI and cloud infrastructure through 2030, funding the expansion of AWS data center capacity in Mumbai and Hyderabad. This commitment, Amazon's third major India investment in as many years, directly expands the hyperscaler container compute footprint serving Asia-Pacific enterprises.
- May 2026: IBM and Red Hat committed USD 5 billion to Project Lightwell, backed by a force of more than 20,000 engineers, to help enterprises secure open-source software through the full production stack from upstream development to containerized runtime environments.
- April 2026: Docker announced the general availability of Docker Offload, a fully managed cloud service that moves the container engine into Docker's secure cloud, enabling developers in managed or constrained environments to run Docker workflows without local virtualization. Roadmap additions include GPU-backed instances for AI and ML workloads, and CI/CD pipeline integration with GitHub Actions, GitLab CI, and Jenkins.


Global Containerization Software Market Report Scope
The containerization software market includes solutions that package applications and their dependencies into standardized, portable containers to ensure consistent deployment across computing environments. The scope covers container runtimes, orchestration platforms, management tools, security solutions, and related services used across on-premises, cloud, and hybrid infrastructure.
The Containerization Software Market Report is Segmented by Deployment Type (On-Premises, Public Cloud, Hybrid Cloud, and Multi-Cloud), Platform (Docker, Kubernetes, Red Hat OpenShift, Amazon Elastic Container Service, Google Kubernetes Engine, Azure Kubernetes Service, and Other Platforms), Container Type (Application Containers, System Containers, Hypervisor Containers, and Unikernels), Application (Application Development and Testing, DevOps and CI/CD Automation, Production Deployment, Cloud Migration, Microservices Management, Edge Computing and IoT, Big Data and Analytics Workloads, and AI and ML Model Deployment), End User (IT and Telecommunications, BFSI, Healthcare and Life Sciences, Retail and E-Commerce, Manufacturing and Industrial Automation, Government and Public Sector, Media and Entertainment, Energy and Utilities, Transportation and Logistics, and Other End Users), and Geography (North America, South America, Europe, Asia-Pacific, Middle East, and Africa). The Market Forecasts Are Provided in Terms of Value (USD).
| On-Premises |
| Public Cloud |
| Hybrid Cloud |
| Multi-Cloud |
| Docker |
| Kubernetes |
| Red Hat OpenShift |
| Amazon Elastic Container Service |
| Google Kubernetes Engine |
| Azure Kubernetes Service |
| Other Platforms |
| Application Containers |
| System Containers |
| Hypervisor Containers |
| Unikernels |
| Application Development and Testing |
| DevOps and CI/CD Automation |
| Production Deployment |
| Cloud Migration |
| Microservices Management |
| Edge Computing and IoT |
| Big Data and Analytics Workloads |
| AI and ML Model Deployment |
| IT and Telecommunications |
| BFSI |
| Healthcare and Life Sciences |
| Retail and E-Commerce |
| Manufacturing and Industrial Automation |
| Government and Public Sector |
| Media and Entertainment |
| Energy and Utilities |
| Transportation and Logistics |
| Other End Users |
| North America | United States |
| Canada | |
| Mexico | |
| South America | Brazil |
| Argentina | |
| Chile | |
| Rest of South America | |
| Europe | Germany |
| United Kingdom | |
| France | |
| Italy | |
| Spain | |
| Rest of Europe | |
| Asia-Pacific | China |
| Japan | |
| India | |
| South Korea | |
| Australia | |
| Rest of Asia-Pacific | |
| Middle East | United Arab Emirates |
| Saudi Arabia | |
| Qatar | |
| Rest of Middle East | |
| Africa | South Africa |
| Egypt | |
| Nigeria | |
| Rest of Africa |
| By Deployment Type | On-Premises | |
| Public Cloud | ||
| Hybrid Cloud | ||
| Multi-Cloud | ||
| By Platform | Docker | |
| Kubernetes | ||
| Red Hat OpenShift | ||
| Amazon Elastic Container Service | ||
| Google Kubernetes Engine | ||
| Azure Kubernetes Service | ||
| Other Platforms | ||
| By Container Type | Application Containers | |
| System Containers | ||
| Hypervisor Containers | ||
| Unikernels | ||
| By Application | Application Development and Testing | |
| DevOps and CI/CD Automation | ||
| Production Deployment | ||
| Cloud Migration | ||
| Microservices Management | ||
| Edge Computing and IoT | ||
| Big Data and Analytics Workloads | ||
| AI and ML Model Deployment | ||
| By End User | IT and Telecommunications | |
| BFSI | ||
| Healthcare and Life Sciences | ||
| Retail and E-Commerce | ||
| Manufacturing and Industrial Automation | ||
| Government and Public Sector | ||
| Media and Entertainment | ||
| Energy and Utilities | ||
| Transportation and Logistics | ||
| Other End Users | ||
| By Geography | North America | United States |
| Canada | ||
| Mexico | ||
| South America | Brazil | |
| Argentina | ||
| Chile | ||
| Rest of South America | ||
| Europe | Germany | |
| United Kingdom | ||
| France | ||
| Italy | ||
| Spain | ||
| Rest of Europe | ||
| Asia-Pacific | China | |
| Japan | ||
| India | ||
| South Korea | ||
| Australia | ||
| Rest of Asia-Pacific | ||
| Middle East | United Arab Emirates | |
| Saudi Arabia | ||
| Qatar | ||
| Rest of Middle East | ||
| Africa | South Africa | |
| Egypt | ||
| Nigeria | ||
| Rest of Africa | ||


Key Questions Answered in the Report
What is the current size and outlook for containerization software?
The containerization software market was valued at USD 9.67 billion in 2025, reached USD 11.05 billion in 2026, and is forecast to reach USD 24.2 billion by 2031 at a 16.97% CAGR.
Which deployment model leads to the current demand for container platforms?
Public cloud led deployment demand with a 46.83% share in 2025 because managed services reduce infrastructure overhead and support AI-ready operations at scale.
Why is Kubernetes still central to enterprise container strategies?
Kubernetes held 42.18% platform share in 2025, and CNCF reported that 82% of container users ran it in production, showing that it remains the main orchestration standard.
What is driving the fastest growth in application use cases?
AI and ML model deployment is projected to grow at a 24.88% CAGR through 2031 because enterprises need portable and reproducible environments for model inference and operations.
Which end-user segment is expanding the fastest?
Healthcare and life sciences is projected to grow at a 19.94% CAGR through 2031, supported by clinical AI adoption and stricter needs for auditable runtime environments.
Which region is likely to see the strongest future expansion?
Asia-Pacific is projected to grow at a 19.73% CAGR through 2031, supported by mature enterprise demand in Japan and newer digital infrastructure buildouts across India and Southeast Asia.
Page last updated on:


