Market Overview
| Study Period | 2020 - 2031 |
|---|---|
| Forecast Data Period | 2026 - 2031 |
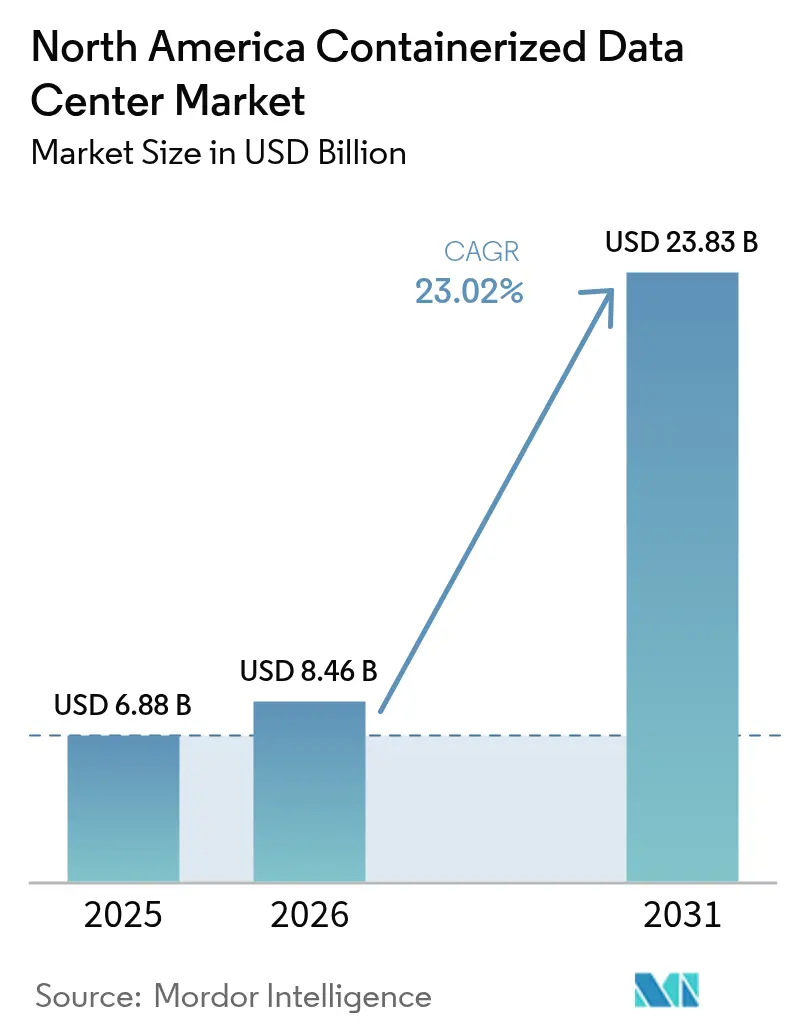
| Base Year Market Size (2025) | USD 6.88 Billion |
| Market Size (2026) | USD 8.46 Billion |
| Market Size (2031) | USD 23.83 Billion |
| Growth Rate (2026 - 2031) | 23.02% CAGR |
| Market Concentration | Medium |
Major Players *Disclaimer: Major Players sorted in no particular order Image © Mordor Intelligence. Reuse requires attribution under CC BY 4.0. | |
North America Containerized Data Center Market Analysis by Mordor Intelligence
The North America containerized data center market size was valued at USD 6.88 billion in 2025 and is estimated to grow from USD 8.46 billion in 2026 to reach USD 23.83 billion by 2031, at a CAGR of 23.02% during the forecast period (2026-2031). Demand is accelerating as utilities struggle to provide new grid connections within the timelines cloud providers promise to customers. Prefabricated modules energize in weeks and let operators match capital outlay with revenue, a financial advantage that draws private-equity capital and informs procurement policies across hyperscale, colocation, and defense verticals. Edge-computing rollouts, small modular reactors, and transformer shortages are converging to make modular power and cooling the new bottlenecks, shifting value creation toward vendors that control component supply chains.
Key Report Takeaways
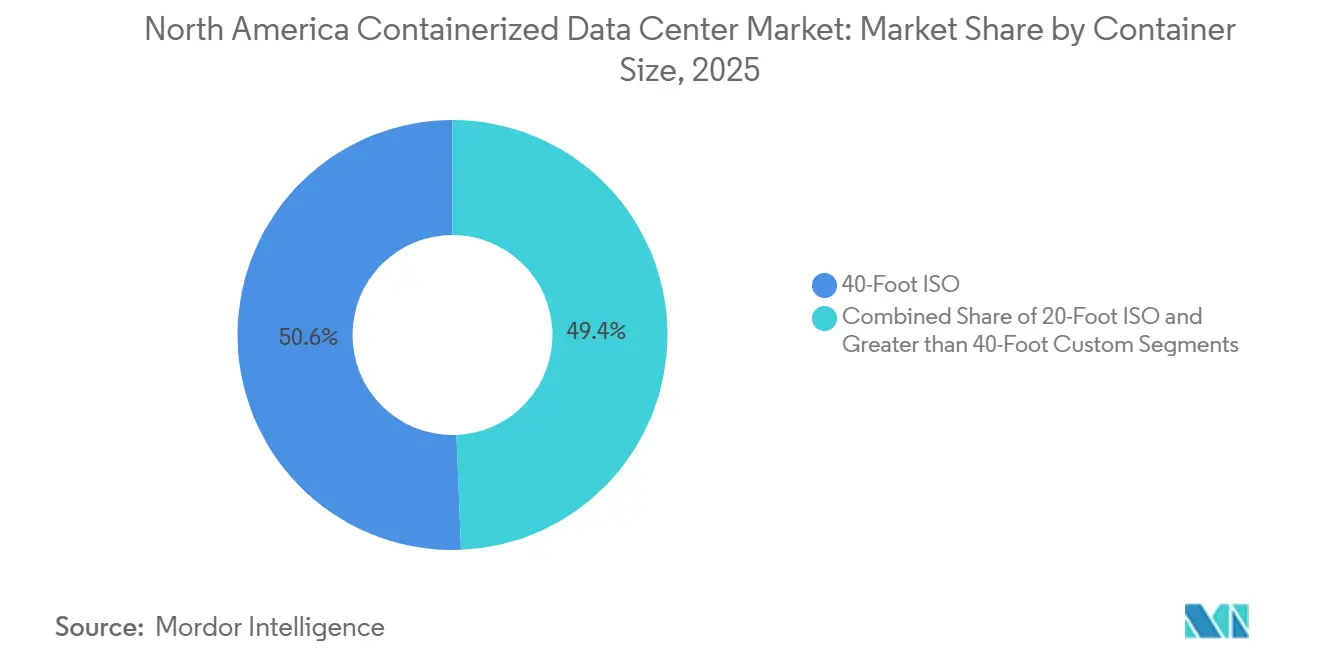
- By container size, 40-foot ISO units led with 50.63% of North America containerized data center market share in 2025, while 20-foot containers are projected to expand at a 24.53% CAGR through 2031.
- By component module, IT modules accounted for 41.67% of the North America containerized data center market size in 2025 and power modules are forecast to post the fastest growth at a 24.62% CAGR over 2026-2031.
- By tier type, tier 3 configurations represented 51.17% of market share in 2025, whereas tier 4 installations are expected to grow at a 24.71% CAGR to 2031.
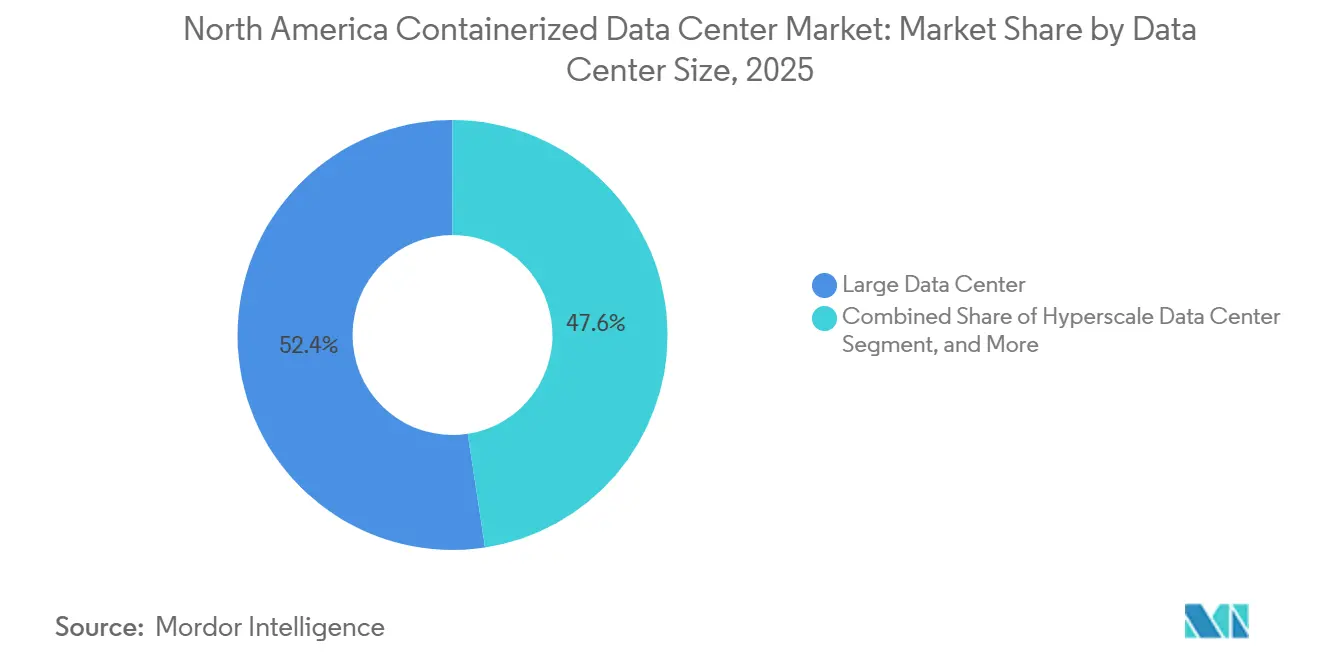
- By data center size, large facilities captured 52.42% of market share in 2025, and hyperscale campuses are advancing at a 24.35% CAGR through 2031.
- By data center type, colocation operators held 53.67% of the North America containerized data center market share in 2025, and hyperscalers and cloud service providers are projected to record the highest CAGR at 24.88% for 2026-2031.
- By country, the United States commanded 78.93% of market share in 2025, while Mexico is the fastest-growing country at a 24.49% CAGR through 2031.
Note: Market size and forecast figures in this report are generated using Mordor Intelligence’s proprietary estimation framework, updated with the latest available data and insights as of 2026.
North America Containerized Data Center Market Trends and Insights
Drivers Impact Analysis*
| Driver | (~) % Impact on CAGR Forecast | Geographic Relevance | Impact Timeline |
|---|---|---|---|
| Need for Rapid Deployment and Scalability | +4.8% | United States, Canada, Mexico | Short term (≤ 2 years) |
| Rising Demand for Energy-Efficient Data Centers | +4.2% | United States, Canada | Medium term (2-4 years) |
| Edge Computing and 5G Traffic Explosion | +3.9% | United States, Mexico | Medium term (2-4 years) |
| Hyperscaler Capacity Additions amid Power Constraints | +4.5% | United States, Canada | Short term (≤ 2 years) |
| Integration of Small Modular Reactors with Containers | +2.8% | United States | Long term (≥ 4 years) |
| Battlefield and Disaster-Relief Mobile AI Pods | +1.6% | United States | Medium term (2-4 years) |
| Source: Mordor Intelligence | |||
Need for Rapid Deployment and Scalability
Traditional builds need 18-24 months, yet procurement windows for new cloud regions rarely exceed half a year, creating a schedule mismatch that modular systems solve in 8-16 weeks. Applied Digital’s North Dakota campus illustrates the model, activating 100 MW of GPU capacity in phases while deferring the next 400 MW until contracts close. Prefabrication allows parallel civil and electrical work, minimizes stranded-asset risk, and decouples hardware refresh cycles from building life, a combination that appeals to investors tracking return-on-capital metrics. The North America containerized data center market benefits directly because faster deployment feeds hyperscaler expansion roadmaps. Scalability also enables swap-outs of IT modules without touching power infrastructure, shortening refresh windows for new processor generations.
Rising Demand for Energy-Efficient Data Centers
Sub-1.2 PUE targets are now standard, and containerized designs ship with liquid-ready manifolds and rear-door heat exchangers pre-installed, locking in efficiency before units reach the field. Vertiv’s March 2025 SmartMod refresh uses hybrid cooling that toggles between air and liquid, sustaining 1.18 PUE in temperate regions.[1]Vertiv Engineering, “SmartMod Hybrid Cooling Launch,” Vertiv, vertiv.com Delta Electronics added free-cooling economizers that cut chiller runtime by 40% in northern latitudes, saving USD 120,000 per module annually. California’s Title 24 code now mandates PUE below 1.25 for new facilities over 500 kW, a threshold containerized vendors meet through certified designs. Efficiency pressure therefore supports premium pricing for turnkey modules and expands the installed base of the North America containerized data center market.
Edge Computing and 5G Traffic Explosion
By December 2025 mid-band 5G covered 85% of the U.S. population, pushing latency-sensitive workloads to locations inside the metro loop.[2]Federal Communications Commission, “5G Coverage Update 2025,” fcc.gov Vapor IO’s Kinetic Edge platform uses 20-foot containers stationed near cell towers in 45 metros to deliver single-digit millisecond round trips. Mexican carriers deploying 5G in Monterrey, Guadalajara, and Mexico City are adopting bilingual edge platforms to serve cross-border supply chains. Compact containers clear customs as finished gear, reducing import duties and accelerating site activation. Edge rollouts therefore add volume to the North America containerized data center market while diversifying demand beyond hyperscale campuses.
Hyperscaler Capacity Additions amid Power Constraints
Interconnection queues in PJM, ERCOT, and CAISO stretch four to seven years, forcing cloud providers to pursue behind-the-meter strategies.[3]U.S. Energy Information Administration, “Interconnection Queue Analysis 2025,” eia.govGoogle positions containerized AI clusters next to Oklahoma and Texas wind farms, using batteries to buffer intermittency and exporting surplus power when loads dip. Microsoft’s Azure for Operators bundles 40-foot containers with fuel cells and flywheel UPS for telecoms seeking five-nines uptime without diesel generators. Oracle’s planned 1 GW campus will surround small modular reactors with concentric rings of containerized pods, trimming transmission losses. These moves keep hyperscaler roadmaps on track and reinforce container demand across North America.
Restraints Impact Analysis*
| Restraint | (~) % Impact on CAGR Forecast | Geographic Relevance | Impact Timeline |
|---|---|---|---|
| Limited Rack Density vs GPU Workloads | -2.1% | United States, Canada | Short term (≤ 2 years) |
| Thermal Management Challenges in Compact Form Factor | -1.8% | United States, Mexico | Medium term (2-4 years) |
| Urban Zoning, Fire-Code Hurdles for Stacked Modules | -1.3% | United States, Canada | Medium term (2-4 years) |
| Prefab Power-Module Supply-Chain Bottlenecks | -1.5% | United States, Canada, Mexico | Short term (≤ 2 years) |
| Source: Mordor Intelligence | |||
Limited Rack Density vs GPU Workloads
NVIDIA H100 and H200 accelerators drive rack loads beyond 50 kW, yet standard 40-foot containers were engineered for 20 kW, forcing operators either to depopulate racks or retrofit liquid manifolds that add USD 80,000-120,000 per module. Rear-door heat exchangers raise density limits to 35 kW but require chilled-water loops, which eat into plug-and-play value. Direct-to-chip cold plates hit 100 kW but introduce single points of failure if leaks occur. Hyperscalers are ordering bespoke “AI-optimized” containers with 480-V distribution, yet custom form factors sacrifice the economies of scale that underpin the North America containerized data center market.
Thermal Management Challenges in Compact Form Factor
Containers concentrate heat in volumes 10-15% smaller than equivalent raised-floor halls, producing 8-12 °C inlet-to-exhaust deltas at 80% load, a gradient that throttles CPU performance. Variable-speed fans and predictive airflow algorithms help, but integration with building-management systems remains uneven. Stacked configurations create chimney effects, pre-heating intake air on upper modules, and adding 15-20% to chiller capex. Arid Southwest climates stretch evaporative cooling systems, raising water-consumption concerns. These constraints temper the growth trajectory of the North America containerized data center market, especially at the edge, where water or power is scarce.
*Our forecasts treat driver/restraint impacts as directional, not additive. The impact forecasts reflect baseline growth, mix effects, and variable interactions.
Segment Analysis
By Container Size: Edge Proliferation Favors Compact Footprints
20-foot ISO containers are projected to grow at 24.53% CAGR from 2026-2031, reflecting telecom and retail preference for units that occupy a single parking space and bypass zoning reviews. In 2025, 40-foot boxes held 50.63% market share because colocation and enterprise customers still value their higher rack count, a dynamic that kept the North America containerized data center market size tilted toward larger footprints. The U.S. Department of Defense caps tactical modules at 20 feet to preserve air-lift compatibility, whereas colocation providers chain 40-foot boxes on greenfield campuses to reach megawatt-scale clusters quickly. Urban deployments in New York and Los Angeles skew smaller to satisfy aesthetic ordinances that restrict stack height. Schneider Electric reported 38% year-over-year growth in 20-foot orders during Q2 2025, citing demand from retailers rolling out point-of-sale analytics at the edge, a trend likely to widen the adoption gap between compact and full-length form factors.
Operators still rely on 40-foot units when IT density calls for 15-20 racks or when their capex models assume multi-tenant occupancy from day one. Larger footprints allow dual-power paths and chilled-water loops within the same enclosure, supporting Tier 3 uptime without auxiliary buildings. However, crane logistics and special-permit movement restrictions add cost in dense metros, nudging some providers toward fleets of 20-foot boxes networked through software-defined fabrics. As real estate scarcity turns rooftops and alleys into viable deployment surfaces, demand for sub-40-foot modules will continue rising, reinforcing the distributed edge narrative inside the North America containerized data center market.


By Component Module: Power Infrastructure Outpaces IT Gear
IT modules captured 41.67% of market share in 2025, yet power modules are set to post a 24.62% CAGR through 2031 because transformer scarcity and multi-year utility queues shift emphasis to self-contained switchgear. Integrating medium-voltage switchgear, UPS, and transformers into factory-tested skids cuts on-site electrical work from weeks to days, a value proposition amplified by project labor shortages and NFPA 70 compliance hurdles. Eaton’s April 2025 lithium-ion UPS platform offers a 15-year service life, trimming maintenance visits and total cost of ownership by up to 25%. Cooling modules, while smaller in revenue, see accelerating demand as liquid adoption grows across AI and graphics workloads. Monitoring pods that host DCIM software remain niche but are increasingly bundled to provide remote visibility, satisfying insurance and regulatory mandates.
Margins skew toward power assemblies because operators pay premium prices to avoid six-to-nine-month lead times for site-built transformer yards. Vendors able to lock steel, copper, and semiconductor supply gain an advantage, underscoring why vertical integration is becoming a moat in the North America containerized data center market. As small modular reactors connect directly to medium-voltage switchgear embedded in power pods, electrical integration will be the next frontier of product differentiation.
By Tier Type: Fault Tolerance Drives Premium Adoption
Tier 3 still held 51.17% share during 2025 because N+1 redundancy hits the sweet spot between cost and uptime. Yet Tier 4 growth at 24.71% CAGR reflects rising GPU workloads in finance and defense that cannot accept planned maintenance windows. Achieving 2N+1 redundancy inside a 40-foot envelope forces creative routing of dual bus bars and chilled-water loops, reducing useable rack space by 15-20%. Schneider Electric’s modular Galaxy VXL UPS uses hot-swappable power blocks, allowing Tier 4 sites to replace a failed module without transferring load, a design that helps meet stringent service-level agreements.
Tier 1 and Tier 2 footprints continue to decline as their single-path architectures fail to secure cyber-insurance discounts or audit approvals required in finance and healthcare. The Uptime Institute noted that 68% of containerized builds launched in 2025 specify Tier 3 or higher, compared with 52% in 2022, signaling that mission-critical workloads have migrated from core campuses to modular footprints. This trend underscores growing sophistication among buyers and highlights that reliability, not square footage, is now the key spec shaping the North America containerized data center market.
By Data Center Size: Hyperscale Economics Reshape Expansion Patterns
Large data centers retained 52.42% 2025 share, but hyperscale campuses are forecast to advance at 24.35% CAGR because they leverage containerized expansion in 1-2 MW tranches without locking capital into empty halls. Meta committed to adding 1.2 GW of capacity by 2027 via hybrid builds, with modular units filling power-constrained metros where grid certainty is low. Small and medium footprints often 0.5-20 MW serve edge and enterprise workloads and rely on North America containerized data center market economics to stay price-competitive against centralized cloud offerings.
Scaling in discrete megawatt blocks aligns revenue recognition with capex and shortens depreciation schedules for IT gear. Container fleets also let hyperscalers exploit component volume discounts, standardize designs across geographies, and automate deployment through robotic cabling or quick-connect power couplers. Wholesale colocation firms like Stack Infrastructure now standardize on container modules to shave months off lead times, highlighting the capex efficiency baked into modular trajectories.
By Data Center Type: Hyperscalers Overtake Colocation Growth Rates
Colocation captured 53.67% share in 2025 as enterprises continued to own servers but outsource space and power. Hyperscalers and cloud providers, however, exhibit the fastest expansion at 24.88% CAGR by launching containerized “local zones” that bring compute closer to end users without erecting entire regions. AWS deployed four-to-six-container clusters in 15 new cities during 2025, cementing sub-10 ms latency for gaming and industrial automation workloads. Enterprise edge nodes remain a smaller but steady segment, as companies refresh disaster-recovery strategies with ruggedized modules capable of standing up in hours.
Hybrid models are emerging where Digital Realty or Equinix bundles containerized edge nodes with low-latency cross-connects to public cloud, offering enterprises a bridge between on-prem and SaaS architectures. National data-sovereignty rules in Canada tilt some regulated workloads toward domestic colocation, balancing the otherwise rapid penetration of hyperscaler footprints. These intertwined dynamics sustain healthy demand across all customer types and deepen the revenue base of the North America containerized data center market.
Geography Analysis
The United States generated 78.93% of market share in 2025 and remains center of gravity for the North America containerized data center market thanks to hyperscale concentration, mature fiber routes, and the world’s largest enterprise IT budgets. Power moratoriums in California and Virginia reroute new capacity toward Texas, Arizona, and the Carolinas where utilities fast-track projects that embed on-site generation. Amazon’s USD 10 billion Ohio and Indiana builds, structured as container campuses adjacent to natural-gas peaker plants, reveal a site-selection pivot away from metro proximity toward inexpensive power. Urban municipalities still delay stacked modules over aesthetic concerns, extending permitting cycles by up to one year in New York and California and nudging providers toward suburban parcels.
Canada contributes a mid-single-digit share yet punches above weight in clean-energy credentials. Hydro-Quebec’s CAD 0.04 (USD 0.03) per kWh incentive and abundant hydroelectricity lure colocation builds in Montreal and Quebec City, while Toronto remains the financial hub demanding Tier 4 uptime. Fire-code rules that require three-meter clearances between containers extend site footprints, adding cost but also encouraging use of recycled industrial land in suburban areas. Indigenous communities in northern Ontario explore hosting container clusters to monetize surplus hydro and wind power, contingent on federal broadband grants that would close the middle-mile fiber gap.
Mexico is the fastest-expanding sub-region, projected at 24.49% CAGR through 2031, anchored by nearshoring of manufacturing and the need for low-latency compute to support binational supply chains. Queretaro has become the de facto data-center hub due to central location and expedited permitting, with KIO Networks, Equinix, and ODATA adopting container modules to sidestep 12-18-month construction delays typical of stick builds. Energy prices average USD 0.10 per kWh, but proximity to factories and U.S. end users offsets the tariff. Regulatory fragmentation between the Federal Electricity Commission and municipal zoning offices introduces risk, which container vendors mitigate by packaging turnkey solutions that include utility liaison services, accelerating adoption of the North America containerized data center market in Mexico.
Competitive Landscape
The North America containerized data center market remains moderately fragmented with vendors such as Schneider Electric, Vertiv, Huawei, Eaton, and others. Differentiation has moved from cabinet counts to software-defined power resilience and liquid-cooling readiness. Schneider Electric’s EcoStruxure analytics suite embeds predictive algorithms that detect thermal anomalies and optimize fan curves remotely, reducing operating expenses by up to 15% over 5 years. Vertiv’s June 2025 partnership with NVIDIA yielded a reference design that ships with pre-plumbed coolant distribution, halving deployment timelines and targeting AI clusters that exceed 50 kW per rack.
Vapor IO and EdgeMicro operate exclusively at the edge and have built software to orchestrate container fleets across dozens of metros, competing on latency rather than scale. Patent filings between 2024-2025 show Schneider Electric seeking 14 protections around modular switchgear, while Vertiv filed nine covering hybrid cooling and predictive maintenance, signaling an arms race to secure intellectual property around container integration. NFPA pre-certified designs further separate incumbents from newcomers; customers shave months off fire-marshal reviews when choosing vendors that arrive with stamped engineering packages.
Supply-chain discipline is now a strategic moat. Transformer and semiconductor constraints stretch delivery schedules by six-to-nine months for less-integrated vendors, whereas Schneider Electric and Eaton leverage global plants and pre-bought copper to guarantee ship dates. The looming integration of small modular reactors will elevate electrical engineering expertise as a buyer criterion. Vendors capable of designing DC-friendly power pods and waste-heat reuse loops will capture premium share, accelerating consolidation inside the North America containerized data center market.
North America Containerized Data Center Industry Leaders
IBM Corporation
Huawei Technologies Co. Ltd.
Hewlett Packard Enterprise Company
Cisco Systems Inc.
Schneider Electric SE
- *Disclaimer: Major Players sorted in no particular order

Recent Industry Developments
- February 2026: Schneider Electric and Switch formed a USD 1.9 billion joint venture to deploy containerized data centers in 12 U.S. metros, bundling battery storage and demand-response participation.
- January 2026: Applied Digital unveiled a USD 5 billion high-performance computing campus in North Dakota using phased 40-foot containers with direct liquid cooling.
- December 2025: Amazon Web Services activated Local Zones in 15 U.S. cities built entirely on four-to-six-container clusters for sub-10 ms latency.
- November 2025: Stack Infrastructure committed USD 800 million to containerized expansions that will add 250 MW across campuses by mid-2027.


North America Containerized Data Center Market Report Scope
A containerized data center is defined as a modular data center incorporated into standard shipping containers or similar containers. The containers are fabricated with all the data center components, including cooling, power, and racks. .
The North America Containerized Data Center Market Report is Segmented by Container Size (20-Foot ISO, 40-Foot ISO, and Greater than 40-Foot Custom), Component Module (IT Module, Power Module, Cooling Module, and Monitoring and Management Module), Tier Type (Tier 1 and 2, Tier 3, and Tier 4), Data Center Size (Small, Medium, Large, and Hyperscale), Data Center Type (Colocation, Hyperscalers/CSPs, and Enterprise and Edge), and Country (United States, Canada, Mexico). The Market Forecasts are Provided in Terms of Value (USD).
By Container Size
| 20-Foot ISO |
| 40-Foot ISO |
| Greater than 40-Foot Custom |
By Component Module
| IT Module |
| Power Module |
| Cooling Module |
| Monitoring and Management Module |
By Tier Type
| Tier 1 and 2 |
| Tier 3 |
| Tier 4 |
By Data Center Size
| Small Data Center |
| Medium Data Center |
| Large Data Center |
| Hyperscale Data Center |
By Data Center Type
| Colocation Data Center |
| Hyperscalers Data Center/CSPs |
| Enterprise and Edge Data Center |
By Country
| United States |
| Canada |
| Mexico |
| By Container Size | 20-Foot ISO |
| 40-Foot ISO | |
| Greater than 40-Foot Custom | |
| By Component Module | IT Module |
| Power Module | |
| Cooling Module | |
| Monitoring and Management Module | |
| By Tier Type | Tier 1 and 2 |
| Tier 3 | |
| Tier 4 | |
| By Data Center Size | Small Data Center |
| Medium Data Center | |
| Large Data Center | |
| Hyperscale Data Center | |
| By Data Center Type | Colocation Data Center |
| Hyperscalers Data Center/CSPs | |
| Enterprise and Edge Data Center | |
| By Country | United States |
| Canada | |
| Mexico |


Key Questions Answered in the Report
What is the projected size of the North America containerized data center market by 2031?
The market is forecast to reach USD 23.83 billion by 2031.
How quickly can a containerized data-center module be commissioned?
Factory-integrated units typically go live in 8-16 weeks, far faster than the 18-24 months common for traditional builds.
Which container size is growing the fastest?
The 20-foot ISO category is expanding at a 24.53% CAGR between 2026-2031.
Why are power modules outpacing IT modules in revenue growth?
Transformer shortages and lengthy grid-interconnection queues are pushing operators toward self-contained switchgear pods that energize independently of utility upgrades.
What is driving Mexico’s rapid adoption of modular data centers?
Nearshoring of manufacturing and the need for low-latency compute to support cross-border supply chains are propelling Mexico’s 24.49% CAGR through 2031.
How are hyperscalers addressing power constraints?
They colocate container clusters with on-site wind, natural-gas, or small modular reactors, cutting power costs to USD 0.03-0.04 per kWh and avoiding multi-year utility queues.
Page last updated on:


