Asia Pacific Container Monitoring Market Size and Share
Market Overview
| Study Period | 2020 - 2031 |
|---|---|
| Forecast Data Period | 2026 - 2031 |
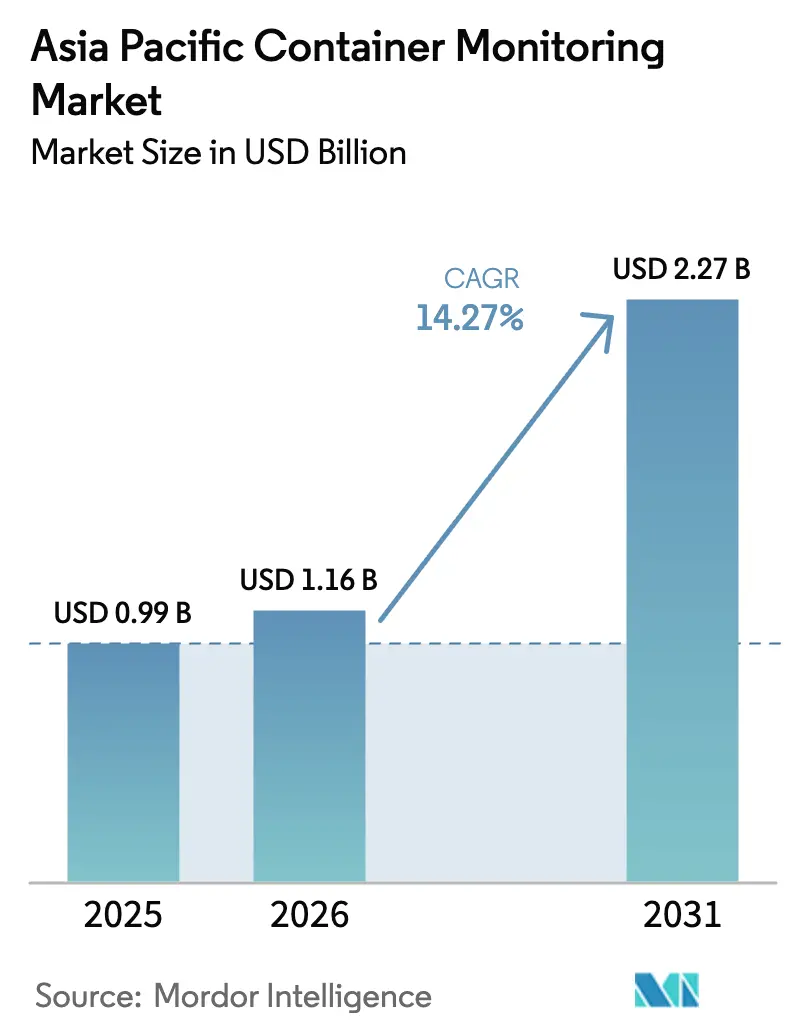
| Base Year Market Size (2025) | USD 0.99 Billion |
| Market Size (2026) | USD 1.16 Billion |
| Market Size (2031) | USD 2.27 Billion |
| Growth Rate (2026 - 2031) | 14.27% CAGR |
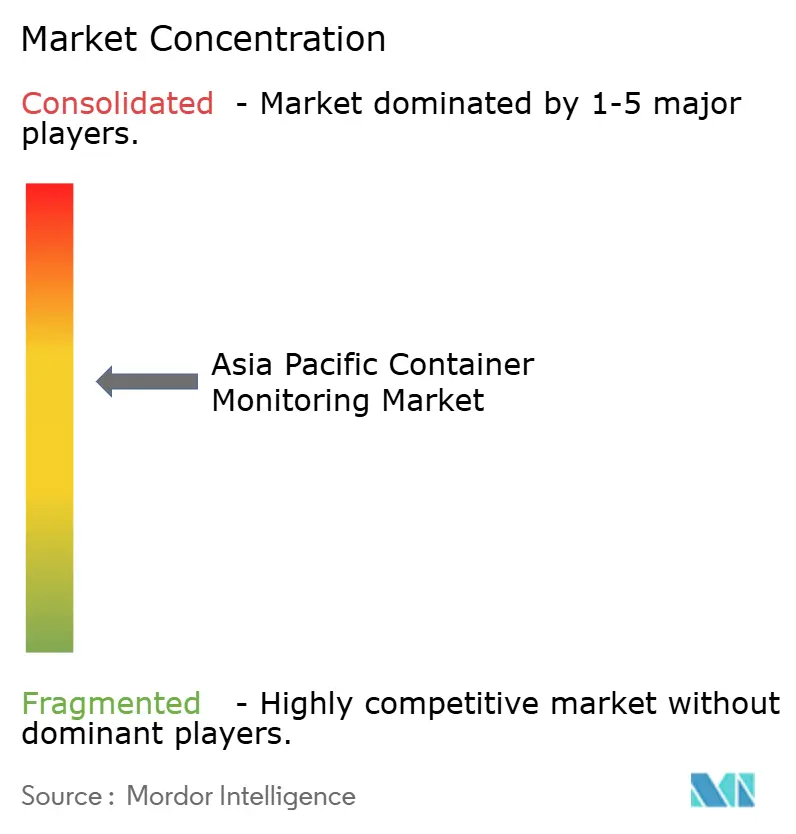
| Market Concentration | Medium |
Major Players *Disclaimer: Major Players sorted in no particular order Image © Mordor Intelligence. Reuse requires attribution under CC BY 4.0. | |
Asia Pacific Container Monitoring Market Analysis by Mordor Intelligence
The Asia Pacific Container Monitoring Market size is projected to be USD 0.99 billion in 2025, USD 1.16 billion in 2026, and reach USD 2.27 billion by 2031, growing at a CAGR of 14.27% from 2026 to 2031.
This growth mirrors sustained investment in digital port infrastructure, surging intra-regional trade, and tightening cold-chain regulations that elevate real-time cargo visibility from a value-added service to an operational necessity across the region’s shipping corridors. Hardware continued to anchor revenue in 2025, yet stronger margin profiles for analytics subscriptions and predictive maintenance contracts are steering new spending toward managed services. Demand is spreading beyond coastal hubs into inland depots, prompting rapid adoption of low-power wide-area and hybrid satellite connectivity that fills cellular blind spots on feeder routes. Real-time geofencing now underpins dynamic re-routing decisions whenever congestion or weather disrupts planned schedules, reducing dwell time and fuel burn. Regulatory momentum ranging from WHO Good Distribution Practice mandates to emerging green-corridor requirements further embeds connected containers in compliance roadmaps for pharmaceuticals, perishables, and hazardous cargo alike.
Key Report Takeaways
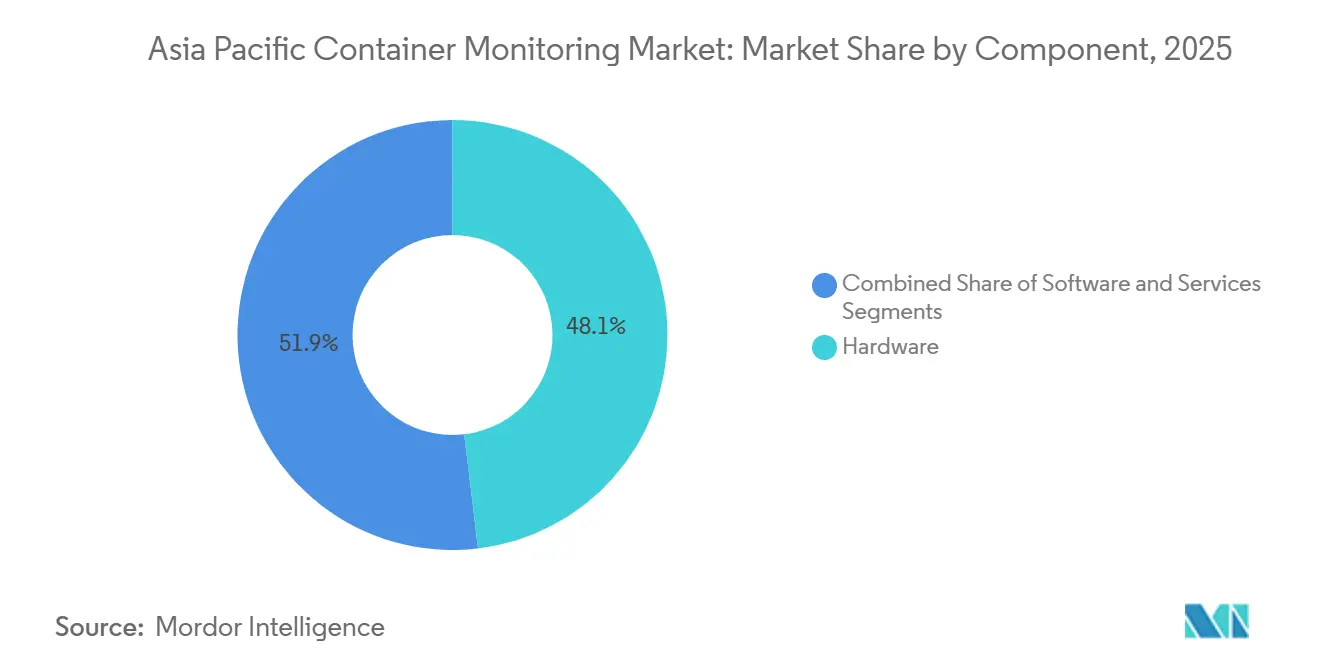
- By component, hardware led with 48.11% of the Asia Pacific container monitoring market share in 2025 while services are set to expand at a 15.02% CAGR through 2031.
- By container type, reefer units accounted for 37.29% of 2025 revenue whereas specialty containers are forecast to grow at a 14.85% CAGR to 2031.
- By connectivity, cellular held 51.06% share in 2025, yet LPWAN is expected to record the fastest CAGR of 14.85% over the outlook period.
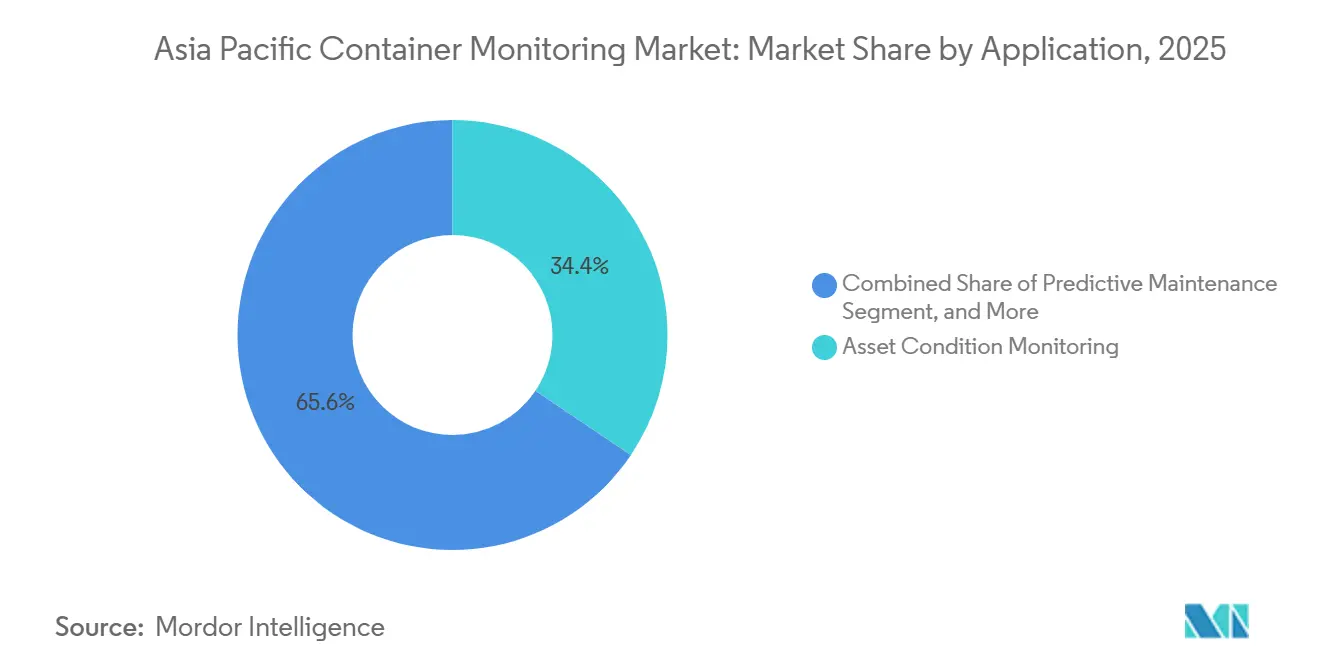
- By application, asset condition monitoring captured 34.42% of demand in 2025 while predictive maintenance is poised for a 15.30% CAGR through 2031.
- By end-user, shipping lines controlled 42.71% of 2025 revenue, but pharmaceutical and healthcare logistics providers are projected to advance at a 15.57% CAGR through 2031.
- By geography, China commanded 46.57% of 2025 revenue, whereas India is anticipated to post a 15.41% CAGR to 2031.
Note: Market size and forecast figures in this report are generated using Mordor Intelligence’s proprietary estimation framework, updated with the latest available data and insights as of January 2026.
Worldwide, activity is shaped by contributions from multiple regions, with Asia representing one of the more structurally developed among them. The global report on container monitoring market by Mordor Intelligence reflects how these regional layers combine into a single system.
Asia Pacific Container Monitoring Market Trends and Insights
Drivers Impact Analysis*
| Driver | (~) % Impact on CAGR Forecast | Geographic Relevance | Impact Timeline |
|---|---|---|---|
| Surge in Advanced Containment Materials and Structural Innovations | +2.10% | China, Japan, South Korea with spillover to ASEAN manufacturing hubs | Medium term (2-4 years) |
| Increase in Seaborne Trade | +2.80% | Global, with concentration in China, Southeast Asia, India | Long term (≥ 4 years) |
| Demand to Enhance Supply Chain Efficiency | +2.50% | Asia Pacific core markets, particularly China, India, Singapore, Australia | Medium term (2-4 years) |
| Growing Adoption of Cold Chain Pharmaceuticals Requiring Real-Time Reefer Visibility | +1.90% | India, China, Southeast Asia with emerging demand in Australia and New Zealand | Short term (≤ 2 years) |
| Rising Regional Green Shipping Corridors Accelerating Smart Container Investment | +1.60% | Singapore, South Korea, Australia, Japan with pilot routes to China | Medium term (2-4 years) |
| Proliferation of Government-Sponsored Digital Port Initiatives in Emerging ASEAN Countries | +1.40% | ASEAN member states, particularly Vietnam, Thailand, Indonesia, Philippines | Long term (≥ 4 years) |
| Source: Mordor Intelligence | |||
Surge in Advanced Containment Materials and Structural Innovations
Composite shells and corrosion-resistant alloys now extend container lifespans beyond the traditional 12-year cycle, encouraging hybrid retrofit strategies that pair external battery trackers with factory-integrated sensors on new builds.[1]A.P. Moller-Maersk, “Fleet Connectivity Upgrade,” maersk.com Maersk’s 2026 fleet upgrade illustrates how a single 4G gateway can aggregate Bluetooth sensor data from multiple units within a 100-meter radius, slashing modem counts while boosting coverage. Japan’s Society 5.0 agenda accelerates trials of carbon-fiber containers embedding strain gauges that detect micro-cracks before failure, protecting high-value electronics cargoes.[2]Cabinet Office Government of Japan, “Society 5.0 Details,” cao.go.jp South Korea’s K-Port 2030 program will require factory-installed ISO 1496-compliant sensors on new reefers delivered to Busan from 2027, cementing a captive base for certified hardware suppliers.[3]Ministry of Oceans and Fisheries South Korea, “K-Port 2030 Strategy,” mof.go.kr
Increase in Seaborne Trade
Asia Pacific handles roughly 60% of global container throughput, and intra-regional lanes such as China-Southeast Asia are expanding faster than trans-Pacific routes, shortening voyage windows and leaving less time for manual intervention. Singapore’s digitalPORT@SG platform merges vessel traffic and container data to cut berth waiting times by 15%, yielding direct fuel savings for liner operators. The China-Europe Railway Express, with more than 17,000 trains in 2023, adds intermodal visibility gaps that hybrid satellite-cellular trackers must bridge. E-commerce volumes compound complexity: Alibaba’s Cainiao network now tags parcels inside containers, pushing demand for low-cost RFID and Bluetooth beacons that support carton-level data granularity.
Demand to Enhance Supply Chain Efficiency
Just-in-time factories can no longer tolerate 48-hour data lags. Real-time geofencing lets operators divert containers to alternate ports when congestion breaches thresholds, a tactic proven during the 2024 Red Sea disruptions. Hapag-Lloyd’s Live Position service blends device data from Nexxiot and ORBCOMM with geospatial analytics to lower inland depot dwell time by 20% through chassis pre-positioning. India’s National Logistics Policy targets trimming logistics costs below 10% of GDP by 2030, and container visibility is singled out as a key lever because opaque hand-offs add up to five days on door-to-door transits. At Port of Melbourne, AI yard optimization uses sensor feeds to predict discharge order a day ahead, cutting vessel turns by 12%.
Growing Adoption of Cold Chain Pharmaceuticals Requiring Real-Time Reefer Visibility
WHO estimates put annual cold-chain product losses above USD 35 billion, spotlighting the cost of undetected temperature excursions. Continuous logging is now mandatory under WHO GDP and FDA 21 CFR Part 11, driving validated sensor rollouts on reefer containers. MSC’s iReefer platform pairs vibration and pressure analytics to forecast failures 72 hours in advance, cutting spoilage on Asia-Europe lanes by 28%. India’s USD 25 billion pharmaceutical export sector is rapidly installing compliant monitoring to preserve biologic integrity en route to the European Union.
Restraints Impact Analysis*
| Restraint | (~) % Impact on CAGR Forecast | Geographic Relevance | Impact Timeline |
|---|---|---|---|
| Increasing Costs Associated with Complexity | -1.50% | Asia Pacific core markets, particularly affecting small and mid-sized freight forwarders | Short term (≤ 2 years) |
| Data Privacy and Security Concerns | -1.20% | China, Singapore, Japan, South Korea, Australia with cross-border data flow restrictions | Medium term (2-4 years) |
| Fragmented Regional Logistics Standards Hindering Interoperability | -0.90% | ASEAN member states, with spillover to India-ASEAN and China-ASEAN trade lanes | Long term (≥ 4 years) |
| Limited Satellite Coverage in High-Latitude Asian Trade Routes | -0.70% | Japan-Russia, South Korea-Alaska, China-Northern Europe routes above 50°N latitude | Medium term (2-4 years) |
| Source: Mordor Intelligence | |||
Increasing Costs Associated with Complexity
Total cost of ownership now includes data subscriptions, cloud storage, software licenses, integration, and battery-swap labour. Smaller forwarders operating on margins below 5% struggle to negotiate low data rates, while large liner fleets achieve sub-USD 2 monthly connectivity costs through scale purchasing. Lithium-thionyl chloride batteries degrade quickly in tropical ports, prompting mid-life replacements that inflate budgets. Parallel platforms remain common because proprietary carrier APIs force operators to maintain multiple dashboards, amplifying training and maintenance spend. Cybersecurity audits tied to IMO Resolution MSC.428 add five-figure annual costs for mid-size fleets, squeezing capital available for new sensors.
Data Privacy and Security Concerns
Container location data reveals sensitive trade flows. China’s Personal Information Protection Law restricts cross-border data transfers unless security reviews and government approvals are secured, complicating cloud analytics for global shippers. Singapore and Japan impose their own consent and notification rules, driving fragmented user experiences. Maritime ransomware incidents demonstrate how outdated OT firmware can be entry vectors; a 2024 attack on a Southeast Asian terminal shut cargo operations for three days, underscoring the stakes. Unencrypted satellite links expose additional attack surfaces that adversaries can exploit to inject false position data; EU cybersecurity guidelines issued in 2025 call for end-to-end encryption on maritime VSAT connections.
*Our forecasts treat driver/restraint impacts as directional, not additive. The impact forecasts reflect baseline growth, mix effects, and variable interactions.
Segment Analysis
By Component: Services Extend Growth Beyond Hardware
Services revenue is set to expand at a 15.02% CAGR, overtaking the hardware dominance that yielded 48.11% share in 2025. The Asia Pacific container monitoring market increasingly rewards subscription contracts bundling sensors, connectivity, analytics, and compliance documentation into predictable monthly fees. Roambee’s integration with Transporeon allows shippers to embed real-time visibility directly into procurement workflows, demonstrating how software unlocks network effects unreachable through standalone devices. Regulatory audits for pharmaceuticals and dangerous goods now require continuous validation, motivating operators to offload calibration and reporting to service providers. Hardware remains critical yet commoditizes quickly as sub-USD 50 trackers from Chinese OEMs saturate entry-level demand. Managed offerings that guarantee uptime and data integrity command premiums equivalent to 20-30% of device value.
Recurring revenues reduce budget unpredictability for shipping lines juggling fluctuating charter volumes. Predictive maintenance sub-contracts account for a growing slice of service fees, shifting the performance risk to vendors who leverage fleet-wide data to refine failure models. API-first platforms ease integration with transport management systems, lowering IT overhead for end users. The Asia Pacific container monitoring market size generated by services is therefore expected to close the gap with hardware before the forecast window ends. Market entrants differentiate through domain-specific algorithms, multilingual dashboards, and local data-hosting options that address sovereignty concerns in China, Japan, and India.


By Container Type: Specialty Units Move from Niche to Necessity
Reefer containers captured 37.29% of 2025 revenue, yet specialty containers, primarily tank and open-top variants, are projected to post a 14.85% CAGR to 2031 on the strength of hazardous-cargo regulations. Operators now retrofit tank containers with pressure, leak, and temperature sensors that feed real-time alerts required under the International Maritime Dangerous Goods Code. Dry containers remain the largest absolute contributor due to volume but monitoring solutions for them increasingly target low-cost geofencing rather than advanced condition sensing.
The Asia Pacific container monitoring market size for specialty units is benefitting from LNG and chemical trade growth, with ISO 1496-3 revisions expected to hard-code electronic monitoring into certification. Open-top and flat-rack containers used in project logistics adopt tilt and shock sensors that timestamp handling impacts, reducing insurance disputes. Cold-chain technologies perfected for vaccines are migrating to high-value food exports like Australian beef, further diversifying demand. Market vendors able to certify sensors under multiple hazardous-goods frameworks gain a pricing edge as compliance deadlines loom.
By Connectivity Technology: LPWAN Extends Reach Where Cellular Falls Short
Cellular networks delivered 51.06% of 2025 revenue because 4G and 5G blanket major port clusters, but LPWAN is forecast to pace the segment with a 14.85% CAGR. An IEEE coastal testbed proved LoRaWAN can reach 10–15 km across water, enabling single-gateway coverage of entire terminals without recurring SIM fees. Hybrid devices automatically switch among LPWAN, cellular, and satellite, balancing cost, latency, and coverage.
Satellite remains indispensable on high-latitude lanes yet faces latency averaging 135 minutes and monthly costs of USD 23.76, versus USD 4.90 for terrestrial cellular. NB-IoT achieves 84% coverage inside China thanks to state mandates, while LTE-M holds only 32% outside China, reinforcing demand for multimode radios. As inland depots digitize, LPWAN nodes promise multi-year battery life and sub-USD 1 monthly connectivity, a compelling proposition for low-value or repositioning containers. The Asia Pacific container monitoring market now regards hybrid connectivity as table stakes rather than an emerging feature.
By Application: Predictive Maintenance Becomes a Margin Lever
Asset condition monitoring represented 34.42% of 2025 demand, but predictive maintenance is slated to expand at a 15.30% CAGR as algorithms mature. Machine-learning models analyze vibration, temperature, and humidity streams to forecast reefer compressor failure 48–72 hours ahead, cutting unplanned maintenance by up to 25%. Location tracking, once the core value proposition, is now commoditized through sub-USD 5 GNSS chipsets.
Logistics optimization layers real-time container telemetry onto vessel scheduling and yard allocation engines; DP World’s Cargospeed dynamically assigns berth slots based on sensor data, trimming turnaround times. Security applications use accelerometers and door sensors to detect tampering on high-value electronics loads. The Asia Pacific container monitoring market size attached to predictive maintenance is expected to climb steadily as ISO 55000 asset-management standards incentivize condition-based servicing.
By End-User Industry: Pharma and Healthcare Leapfrog Traditional Buyers
Shipping lines still held 42.71% of 2025 revenue, but pharmaceutical and healthcare logistics are projected to clock a 15.57% CAGR on the back of stringent cold-chain mandates. WHO GDP and IATA temperature-control rules require real-time data, pushing logistics providers to adopt validated solutions that produce tamper-proof audit trails. Freight forwarders leverage visibility dashboards to reduce customer inquiries by 40%, monetizing data transparency as a premium service.
Port operators integrate monitoring to automate gate flows; Singapore’s Tuas Megaport embeds sensors as a foundation for autonomous yard cranes. E-commerce giants like Alibaba demand parcel-level tracking, cascading visibility expectations upstream to ocean freight. Food exporters adopt reefer monitoring to secure insurance discounts of 10–15%. Chemicals and hazardous-goods shippers face IMDG Code mandates, making real-time pressure and temperature reporting non-negotiable. As mandates proliferate, the Asia Pacific container monitoring market continues to diversify its end-user base.
Geography Analysis
China generated 46.57% of 2025 revenue as the Belt and Road Initiative turbocharged digital port upgrades at Shanghai, Ningbo-Zhoushan, and Qingdao. The Port of Shanghai processed 47.3 million TEU in 2023 and pairs IoT yard systems with automated stacking cranes to cut dwell time by 18%. Smart-port concepts now extend to Gwadar under the China-Pakistan Economic Corridor, embedding container tracking from inception.
India is projected to expand at a 15.41% CAGR through 2031, propelled by the Sagarmala Programme’s INR 6 trillion (USD 72 billion) budget across 574 projects. Jawaharlal Nehru Port’s blockchain pilot reduced customs clearance times by 40%, signaling the shift toward distributed-ledger workflows. Cold-chain exporters of biologics and seafood amplify visibility demand as they seek European Medicines Agency certification.
Japan and South Korea command premium pricing on monitoring solutions, driven by just-in-time automotive and electronics exports that require sub-hour updates. Busan’s K-Port 2030 roadmap mandates factory-installed sensors on new reefers from 2027. Australia and New Zealand rely on monitoring to safeguard perishables; Port of Melbourne’s AI yard pilot trimmed vessel turnaround 12%, freeing berth capacity. Southeast Asia is catching up under the ASEAN Smart Logistics Network, though data-localization rules vary by member state, complicating cross-border analytics. High-latitude routes above 50° N such as Japan-Russia still face satellite blind spots that hybrid systems must bridge.
Competitive Landscape
The Asia Pacific container monitoring market is moderately fragmented, with no vendor exceeding 15% revenue share. ORBCOMM and Nexxiot led installed bases at around 1.6 million and 1.0 million units, respectively, but liner operators deliberately multi-source to avoid lock-in. Strategy centers on vertical integration: Maersk, Hapag-Lloyd, and CMA CGM develop proprietary analytics platforms while sourcing hardware from multiple suppliers to commoditize sensors and retain software margin.
Predictive-analytics capability has become the new battleground. Vendors able to forecast reefer failures three days ahead command price premiums of 20–30%. Nexxiot’s 2024 patent filings on energy-harvesting extend battery life beyond 10 years by scavenging vibration and thermal gradients, potentially eliminating costly battery swaps. Roambee and OnAsset Intelligence gain traction with hybrid devices that support air, ocean, and road freight under a single SKU, appealing to forwarders managing complex multimodal chains.
Standards engagement is another differentiator. ORBCOMM participates in ISO 18186 RFID working groups, influencing specifications that could embed proprietary know-how into global norms. Compliance proficiency with China’s PIPL and Singapore’s PDPA is now a threshold requirement rather than a value add, yet vendors offering local data hosting within each jurisdiction win favour among multinational shippers navigating divergent sovereignty rules. As green shipping corridors mature, partnerships with cloud-based emissions calculators are emerging, linking container telemetry to greenhouse-gas dashboards that help carriers evidence decarbonization progress.
Asia Pacific Container Monitoring Industry Leaders
ORBCOMM Inc.
Geoforce, Inc.
Globe Tracker, ApS.
Emerson Electric Co.
Phillips Connect Technologies, LLC
- *Disclaimer: Major Players sorted in no particular order

Recent Industry Developments
- January 2026: Maersk completed a fleet-wide IoT upgrade on 450 vessels, shifting from 2G to 4G and enabling predictive compressor-failure alerts 48–72 hours in advance.
- October 2025: Hong Kong Polytechnic University released latency and cost benchmarks for low-earth-orbit satellite IoT, finding average message delays of 135 minutes and monthly fees of USD 23.76.
- May 2025: Maersk detailed progress on its vessel connectivity overhaul in partnership with Onomondo, Nokia, 42com Sat, Complea, and Zededa, targeting full completion in Q1 2026.
- April 2025: IEEE published LoRaWAN maritime test results demonstrating 10–15 km range across coastal waters with a single gateway.


Asia Pacific Container Monitoring Market Report Scope
The Asia Pacific Container Monitoring Market Report is Segmented by Component (Hardware, Software, Services), Container Type (Dry, Reefer, Tank, Specialty, Other), Connectivity Technology (Cellular, Satellite, LPWAN, Bluetooth and RFID, Hybrid), Application (Asset Condition Monitoring, Location Tracking, Logistics and Supply Chain, Security and Safety, Predictive Maintenance), End-User Industry (Shipping Lines, Freight Forwarders, Port Operators, E-commerce and Retail, Pharmaceutical and Healthcare, Food and Beverage, Chemical and Hazardous Goods, Other), and Geography (China, Japan, South Korea, India, Australia and New Zealand, Rest of Southeast Asia, Rest of Asia Pacific). The Market Forecasts are Provided in Terms of Value (USD).
| Hardware |
| Software |
| Services |
| Dry Containers |
| Reefer Containers |
| Tank Containers |
| Specialty Containers |
| Other Container Types |
| Cellular |
| Satellite |
| LPWAN |
| Bluetooth and RFID |
| Hybrid Connectivity |
| Asset Condition Monitoring |
| Location Tracking |
| Logistics and Supply Chain |
| Security and Safety |
| Predictive Maintenance |
| Shipping Lines |
| Freight Forwarders |
| Port Operators |
| E-commerce and Retail |
| Pharmaceutical and Healthcare |
| Food and Beverage |
| Chemical and Hazardous Goods |
| Other End-User Industries |
| China |
| Japan |
| South Korea |
| India |
| Australia and New Zealand |
| Rest of Southeast Asia |
| Rest of Asia Pacific |
| Segmentation by Component | Hardware |
| Software | |
| Services | |
| Segmentation by Container Type | Dry Containers |
| Reefer Containers | |
| Tank Containers | |
| Specialty Containers | |
| Other Container Types | |
| Segmentation by Connectivity Technology | Cellular |
| Satellite | |
| LPWAN | |
| Bluetooth and RFID | |
| Hybrid Connectivity | |
| Segmentation by Application | Asset Condition Monitoring |
| Location Tracking | |
| Logistics and Supply Chain | |
| Security and Safety | |
| Predictive Maintenance | |
| Segmentation by End-User Industry | Shipping Lines |
| Freight Forwarders | |
| Port Operators | |
| E-commerce and Retail | |
| Pharmaceutical and Healthcare | |
| Food and Beverage | |
| Chemical and Hazardous Goods | |
| Other End-User Industries | |
| Segmentation by Geography | China |
| Japan | |
| South Korea | |
| India | |
| Australia and New Zealand | |
| Rest of Southeast Asia | |
| Rest of Asia Pacific |


Key Questions Answered in the Report
How fast is the Asia Pacific container monitoring market expected to grow?
The market is forecast to expand at a 14.27% CAGR, rising from USD 1.16 billion in 2026 to USD 2.27 billion by 2031.
Which segment is expanding more quickly, hardware or services?
Services are projected to grow at 15.02% CAGR, outpacing hardware as shipping lines shift toward subscription models that bundle analytics and compliance support.
Why is India viewed as a high-growth geography for container monitoring?
India’s Sagarmala Programme and blockchain pilots at Jawaharlal Nehru Port are modernizing port and hinterland links, supporting a 15.41% forecast CAGR through 2031.
What connectivity option is gaining traction outside primary port corridors?
Low-power wide-area networks such as LoRaWAN are growing quickly because a single gateway can cover an entire terminal without recurring SIM fees.
How do cold-chain regulations influence adoption?
WHO GDP and IATA rules mandate continuous temperature logging, pushing pharmaceutical shippers to install validated sensors that reduce spoilage and ensure compliance.
What competitive advantage do hybrid devices offer?
Hybrid units that switch among cellular, LPWAN, and satellite maintain visibility across diverse trade lanes, minimizing blind spots and lowering total connectivity cost.
Page last updated on:


