Market Overview
| Study Period | 2021 - 2031 |
|---|---|
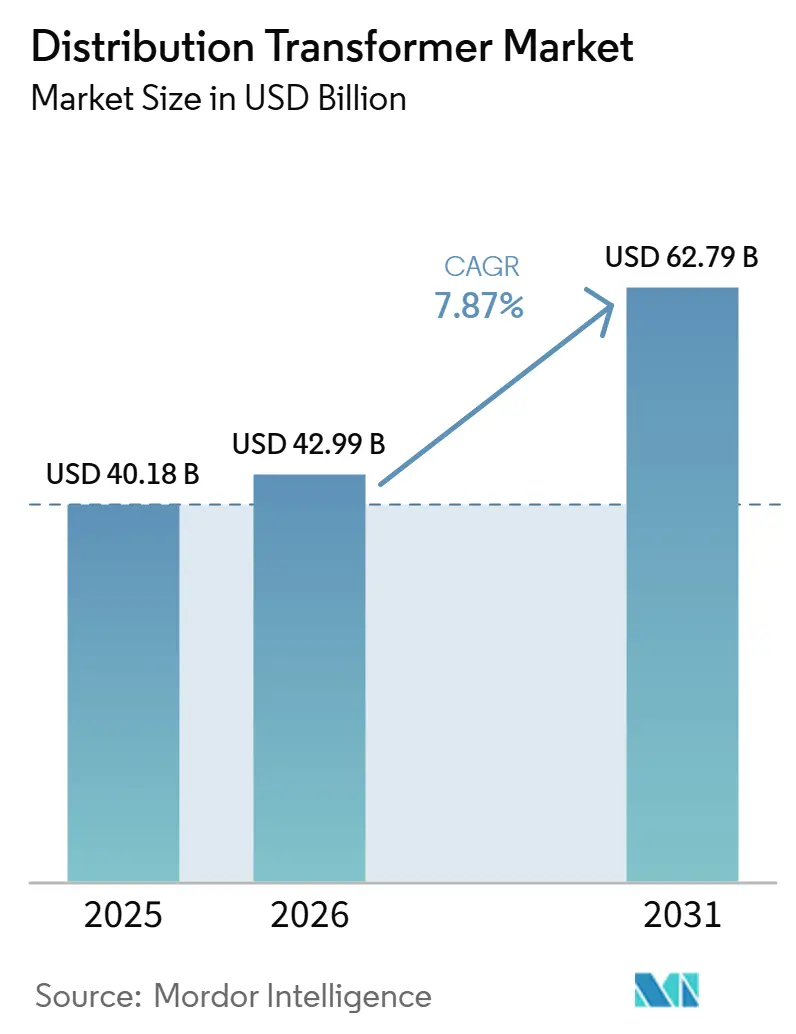
| Market Size (2026) | USD 42.99 Billion |
| Market Size (2031) | USD 62.79 Billion |
| Growth Rate (2026 - 2031) | 7.87% CAGR |
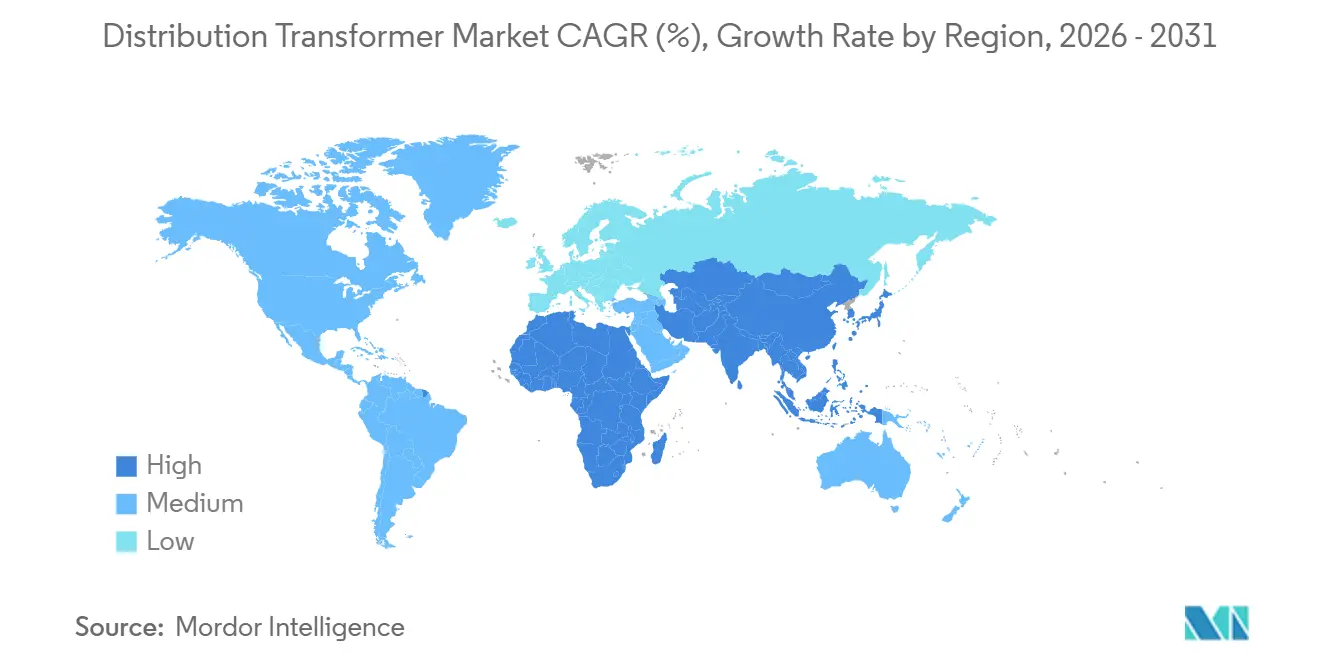
| Fastest Growing Market | Asia-Pacific |
| Largest Market | Asia-Pacific |
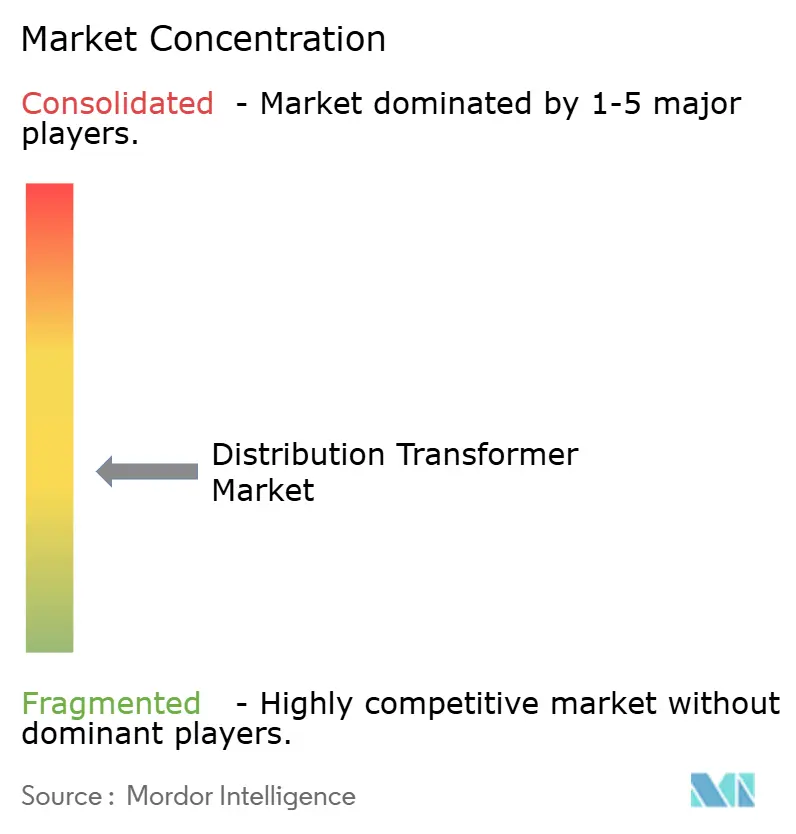
| Market Concentration | Medium |
Major Players *Disclaimer: Major Players sorted in no particular order Image © Mordor Intelligence. Reuse requires attribution under CC BY 4.0. | |
Distribution Transformer Market Analysis by Mordor Intelligence
The Distribution Transformer Market size is expected to grow from USD 40.18 billion in 2025 to USD 42.99 billion in 2026 and is forecast to reach USD 62.79 billion by 2031 at 7.87% CAGR over 2026-2031.
Accelerated replacement of assets installed during the 1970s-1990s, surging renewable-energy interconnections, and load growth from data-center clusters and electric-vehicle charging corridors underpin near-term demand. Asia-Pacific utilities continue to award large multiyear tenders, while North American and European grid operators redirect capital toward neighborhood-level capacity upgrades that favor modular pad-mounted units. Fire-safety regulations and eco-design rules encourage a progressive shift from mineral oil to ester fluid or dry-type platforms, even as oil-immersed designs remain cost-competitive for rural and industrial settings. Competitive intensity stays moderate because winding expertise, insulation-paper supply, and grain-oriented electrical steel contracts act as barriers to entry. Volatile copper prices, lead-time elongation, and skilled-labor shortages temper capacity expansion but do not derail the distribution transformer market’s structural growth trajectory.
Key Report Takeaways
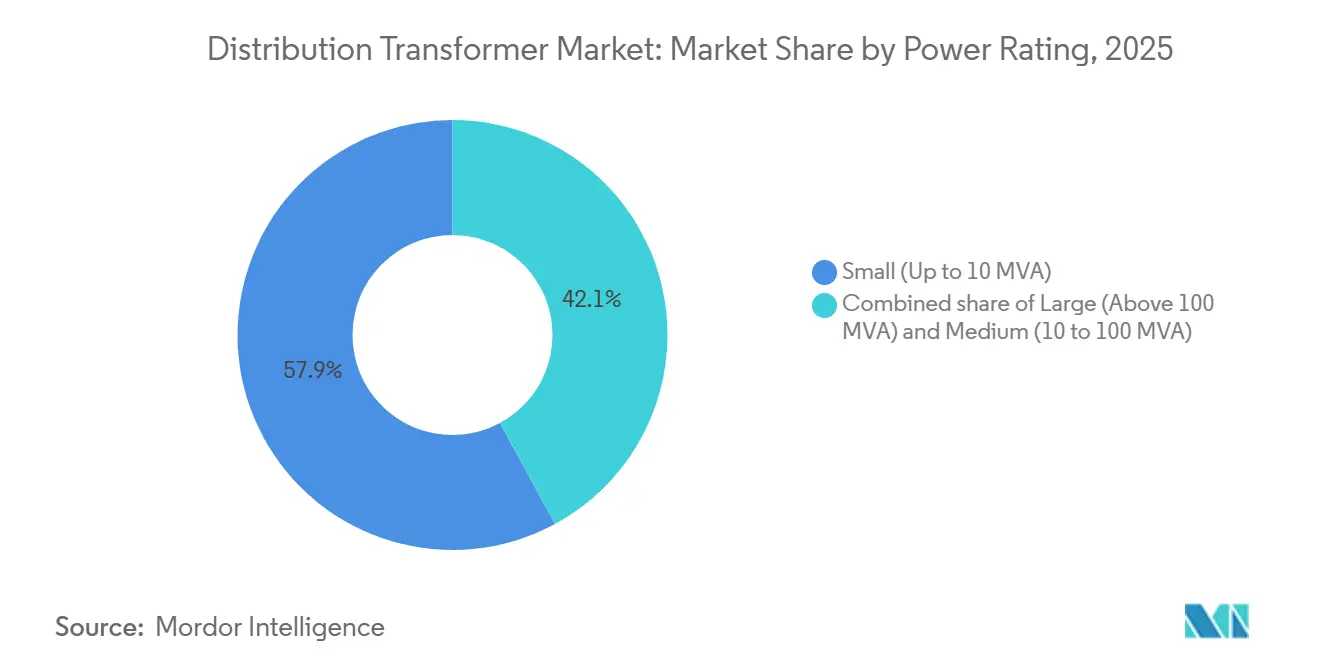
- By power rating, small units up to 10 MVA led with 57.9% revenue share in 2025, whereas medium units between 10 MVA and 100 MVA are advancing at an 8.6% CAGR through 2031.
- By cooling type, oil-cooled designs held 64.3% of 2025 revenue; air-cooled counterparts are the fastest-growing at an 8.9% CAGR through 2031.
- By phase, three-phase configurations accounted for 71.6% volume in 2025, while single-phase units recorded an 8.8% CAGR over 2026-2031.
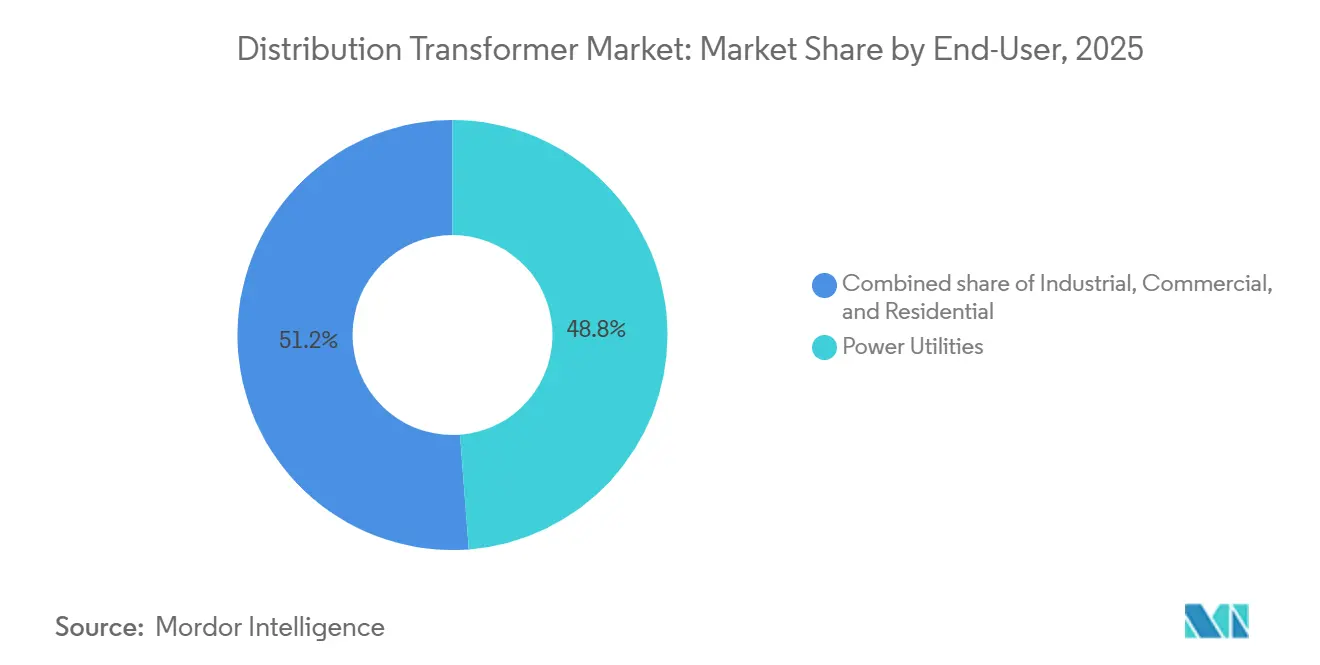
- By end-user, power utilities represented 48.8% demand in 2025; residential applications exhibit the highest growth at a 9.1% CAGR to 2031.
- By geography, Asia-Pacific captured a 42.5% distribution transformer market share in 2025 and is set to register an 8.4% CAGR through 2031.
- Large manufacturers collectively supplied approximately 52% of global revenue in 2025; the top five firms therefore hold a moderate position within the distribution transformer market size hierarchy.
Note: Market size and forecast figures in this report are generated using Mordor Intelligence’s proprietary estimation framework, updated with the latest available data and insights as of 2026.
Global Distribution Transformer Market Trends and Insights
Drivers Impact Analysis*
| Driver | (~) % Impact on CAGR Forecast | Geographic Relevance | Impact Timeline |
|---|---|---|---|
| Accelerated grid-modernization & aging-asset replacement | +1.8% | North America, Europe, global spillover | Medium term (2-4 years) |
| Rapid renewable-energy grid interconnection | +1.5% | APAC, Europe, selected U.S. states | Short term (≤ 2 years) |
| Government electrification & rural-access programs | +1.2% | India, Southeast Asia, sub-Saharan Africa, South America | Long term (≥ 4 years) |
| Surge in data-center & EV-charging load pockets | +1.4% | North America, Europe, China, Singapore | Short term (≤ 2 years) |
| Price-spike driven ROI boost for new OEM capacity | +0.6% | China, India, Mexico hubs | Medium term (2-4 years) |
| EU Tier-3 eco-design shift to ester fluids | +0.7% | Europe, ANZ, limited North American jurisdictions | Medium term (2-4 years) |
| Source: Mordor Intelligence | |||
Accelerated Grid-Modernization and Replacement of Aging Assets
Transformer fleets across the United States and Western Europe now average 35-40 years in service, well beyond their 25-year notional design life. Failure risk rises exponentially after three decades of operation due to insulation breakdown and moisture ingress, prompting asset-management plans that prioritize proactive replacement over ad-hoc repair. Germany earmarked EUR 12 billion (USD 13 billion) between 2024 and 2028 for low-voltage upgrades supporting bidirectional rooftop-solar and offshore-wind flows.[1]Bundesnetzagentur, “Grid Development Plan 2024-2028,” bundesnetzagentur.de Such initiatives guarantee multi-year order visibility for OEMs but intensify raw-material and labor bottlenecks. Utilities increasingly specify on-load tap changers and digital monitoring, elevating average selling prices by 8% yet trimming unplanned-outage costs.
Rapid Renewable-Energy Grid Interconnection Needs
Global wind and solar additions reached 510 GW in 2025, but interconnection queues in the United States alone exceeded 2,600 GW because transformer-based substation upgrades lag generation growth.[2]Lawrence Berkeley National Laboratory, “Queued-Up Interconnection Study,” emp.lbl.gov Variable-output plants demand step-up transformers with fast tap-changing and harmonic-filter capability to stabilize voltages during cloud cover or wind lulls. India now mandates dedicated 33/220 kV transformers for solar parks above 50 MW, accelerating medium-rating procurement cycles.[3]Ministry of Power India, “Revamped Distribution Sector Scheme,” powermin.gov.in Offshore wind arrays in the North Sea deploy subsea 66/220 kV units with corrosion-resistant tanks, a double-digit-growth niche as projects advance beyond 40 km from shore.
Government Electrification & Rural Energy-Access Programs
India’s Saubhagya Phase II targets 15 million additional rural connections by 2028, necessitating about 180,000 distribution transformers rated 25-100 kVA. Similar efforts across sub-Saharan Africa and Brazil’s Luz para Todos initiative generate high-volume orders for standardized, low-cost single-phase models. Newly electrified households experience five-fold load growth within five years, driving periodic uprating of initially installed transformers.
Surge in Data-Center & EV-Charging Load Pockets
Hyperscale data facilities consumed 460 TWh in 2025, and AI-training clusters add 30% annual load growth. A single campus in Northern Virginia draws 150 MW, requiring multiple 100 MVA transformers with N+1 redundancy. Public fast chargers rated 350 kW create 15-minute demand spikes that overwhelm legacy pole-mounted units, compelling California utilities to deploy 12,000 dedicated transformers along Interstate 5 and Highway 101.
Restraints Impact Analysis*
| Restraint | (~) % Impact on CAGR Forecast | Geographic Relevance | Impact Timeline |
|---|---|---|---|
| Raw-material price volatility (copper, GO steel) | -0.9% | Global, import-dependent markets | Short term (≤ 2 years) |
| Long lead-times & skilled-labor shortages | -1.1% | North America, Europe, Australia | Medium term (2-4 years) |
| Rising insurance premiums for fire-risk designs | -0.4% | Major urban centers | Medium term (2-4 years) |
| Emerging solid-state transformer substitution | -0.3% | Pilot sites in U.S., Europe, Japan | Long term (≥ 4 years) |
| Source: Mordor Intelligence | |||
Raw-Material Price Volatility (Copper, GO Steel)
Copper traded between USD 8,200-10,400/t in 2025, while grain-oriented steel supply tightened as mills favored automotive grades. Transformer makers face 200-300 basis-point margin compression when fixed-price tenders collide with raw-material spikes. CG Power reported INR 420 crore (USD 50 million) additional cost of goods in fiscal 2025, forcing renegotiation of 18% of its backlog. Smaller firms lacking hedging programs risk exit or consolidation.
Long Lead-Times & Skilled-Labor Shortages
Standard distribution transformer lead time stretched to 28 weeks in 2025, and custom large units required 52 weeks, up more than 50% versus 2019. Workforce-age attrition and low enrollment in coil-winding apprenticeships limit throughput; Siemens Energy’s Nuremberg plant operated at 78% of capacity due to a lack of insulation-layer technicians. Utilities respond by carrying larger spares and extending the life of aging assets, deferring fresh demand.
*Our updated forecasts treat driver/restraint impacts as directional, not additive. The revised impact forecasts reflect baseline growth, mix effects, and variable interactions.
Segment Analysis
By Power Rating: Medium Units Gain Industrial Traction
Medium transformers (10-100 MVA) are forecast to advance at an 8.6% CAGR and capture incremental distribution transformer market size as industrial campuses, data-center substations, and captive-power plants seek higher redundancy. Small units up to 10 MVA retained a commanding 57.9% distribution transformer market share in 2025, reflecting widespread deployment at residential and commercial feeders. Large transformers above 100 MVA remain a bespoke niche bound by site engineering timelines. Dual-secondary medium units isolate sensitive semiconductor or pharmaceutical loads, adding 12% cost but avoiding downtime valued at USD 50,000 per hour.[4]IEEE Industry Applications Society, “Industrial Power Systems Handbook,” ias.ieee.org
Load-profiling software indicates utilities are shifting away from single large stations toward dispersed clusters of small and medium units, improving fault isolation and expediting service restoration. Prefabricated skid-mounted packages cut site work from eight weeks to three, aligning with labor constraints and just-in-time construction models.
Note: Segment shares of all individual segments available upon report purchase
Get Detailed Market Forecasts at the Most Granular Levels
Download PDF
By Cooling Type: Air-Cooled Designs Capture Urban Niches
Oil-immersed products dominated 64.3% revenue in 2025, leveraging lower cost per kVA for rural and utility-scale sites. Fire-safety mandates and upcoming EU Tier-3 efficiency rules propel air-cooled and ester-fluid variants at an 8.9% CAGR, especially inside high-rise service rooms and metro stations. Insurance premiums on mineral-oil units in dense cities rose 15-20%, tilting total-cost-of-ownership economics toward dry-type formats, despite a 25% initial-cost premium. Schneider Electric’s EcoDesign dry-type portfolio captured 22% of European retrofit volume in 2025, up from 14% in 2023.
Hybrid cooling that marries oil-immersed cores with external air-blast radiators gains traction in tropical regions where ambient temperatures exceed 40 °C. This architecture maintains thermal headroom without incurring full dry-type cost.
By Phase: Single-Phase Growth Tracks Residential Electrification
Three-phase equipment represented 71.6% of shipments in 2025, indispensable for industrial motors and balanced commercial loads. Single-phase units register an 8.8% CAGR as heat-pump adoption, rooftop solar backfeed, and Level-2 EV charging elevate suburban household demand from 10 kVA to more than 30 kVA. Utilities uprate pole-mounted assets from 25 kVA to 50-75 kVA and prefer models with automatic voltage regulation to prevent flicker during cloud transients.
In sparsely populated territories across Africa and South Asia, single-phase distribution allows long feeders at lower capital outlay, while aluminum windings and non-oriented silicon steel lower bill-of-materials costs by 40% relative to three-phase equivalents.
By End-User: Residential Segment Leads Growth Trajectory
Power utilities absorbed 48.8% of 2025 revenue as they modernized feeders and built renewable-energy tie-ins. Residential applications are the fastest mover at a 9.1% CAGR, reflecting mandates that new homes integrate solar-plus-storage and EV-ready wiring. Smart pad-mounted units rated 500-2,500 kVA with remote disconnect gain favor in North American subdivisions. Industrial customers continue to invest in premium-spec units featuring ferroresonant voltage control that keep semiconductor lines within ±2% tolerances, avoiding million-dollar downtime incidents.
Note: Segment shares of all individual segments available upon report purchase
Get Detailed Market Forecasts at the Most Granular Levels
Download PDF
Geography Analysis
Asia-Pacific held a 42.5% distribution transformer market share in 2025 and is projected to grow at an 8.4% CAGR. India’s Revamped Distribution Sector Scheme budgets INR 3.03 trillion (USD 36 billion) for 1.2 million transformer procurements by 2028. Chinese OEMs such as TBEA integrated grain-oriented steel and automated winding, lowering labor cost 35% and defending domestic share even as Southeast Asian developers import mid-sized units for solar and wind interconnects. Australia and New Zealand focus on bushfire-resistant ester-fluid units to replace 1970s-era rural equipment.
North America and Europe collectively account for 38% of the distribution transformer market size. The U.S. Infrastructure Investment and Jobs Act channels USD 65 billion to grid resilience, funding upgrades at 4,200 substations. Europe’s Energiewende requires 12,000 dynamic-voltage transformers by 2030, with German, Spanish, and Italian operators prioritizing eco-design compliance. Canadian utilities in Arctic regions specify -50 °C operational tolerance, driving specialized orders with synthetic fluids and external heaters.
South America, the Middle East, and Africa share roughly 19.5% of 2025 revenue. Brazil’s post-privatization grid overhaul addresses urban outage rates that reached 14 hours per customer in São Paulo. Saudi Arabia’s solar build-out mandates desert-rated 132/33 kV transformers with sand-ingress protection, while African mini-grid developers purchase containerized 50-500 kVA units bundled with batteries and diesel-genset backups for 24-hour supply.
Get Analysis on Important Geographic Markets
Download PDF
Competitive Landscape
The top ten suppliers commanded about 52% of global revenue in 2025, giving the distribution transformer market a moderately concentrated profile. Hitachi Energy’s control of insulation-paper factories and ABB’s TXpert digital-sensor ecosystem exemplify vertical integration and technology differentiation. Siemens Energy partnered with Nippon Steel to commercialize amorphous-core alloys that cut no-load losses 70% relative to standard silicon steel, aligning with EU efficiency mandates. Schneider Electric opened a 1.2-million-unit plant in Pune in 2025, underscoring a capacity shift toward demand centers in India and Southeast Asia. Eaton’s USD 180 million Monterrey expansion answers near-shoring requirements of U.S. data-center and automotive clients.
Price-oriented challengers in China and India underbid by 20-25% through aluminum windings and simplified designs, but face hurdles in meeting emerging cybersecurity and eco-design specifications. Pilot solid-state transformer programs funded by utility consortia demonstrate bidirectional power flow and harmonic filtering yet remain pre-commercial beyond 2030. Overall, supply-side participants balance capacity additions with raw-material and labor constraints, sustaining moderate margins while responding to geographically diverse demand signals.
Distribution Transformer Industry Leaders
Eaton Corporation PLC
Schneider Electric SE
General Electric Company
Siemens AG
Hitachi Energy Ltd.
- *Disclaimer: Major Players sorted in no particular order
Need More Details on Market Players and Competitors?
Download PDF
Recent Industry Developments
- January 2026: RESA Power expanded its transformer distribution solutions portfolio by acquiring 3MD Power Services LLC. This acquisition adds high-voltage testing, repair, and dielectric fluid processing capabilities to its offerings. It also strengthens RESA Power's regional service presence and technical expertise in large power transformer maintenance and distribution equipment services, aligning with its strategic growth objectives.
- January 2026: Lucy Group completed the acquisition of Blakley Electrics Ltd in January 2026. This acquisition strengthens Lucy Group's capabilities in power distribution systems, protection products, and transformer manufacturing. It broadens the company's offerings in low-voltage distribution, protection, and transformer distribution products, reinforcing its position in the electrical distribution market.
- June 2025: Hitachi Energy introduced its Compact Line Voltage Regulator (C-LVR) at CIRED 2025. This product integrates voltage regulation with a distribution transformer into a single compact unit. Designed to meet the needs of evolving grids with distributed energy resources, the C-LVR enhances voltage stability, reduces infrastructure requirements, and supports smarter distribution grid control alongside traditional transformer distribution solutions.
- April 2025: Shell expanded its transformer insulating liquids portfolio with the global launch of the Shell MIDEL range in April 2025. By combining MIDEL ester-based fluids with its existing transformer oils, Shell aims to enhance efficiency, reliability, environmental performance, and safety for power and distribution transformer applications in modern energy networks.
Global Distribution Transformer Market Report Scope
A distribution transformer is also referred to as an isolation transformer. The main function of a distribution transformer is to convert the high voltage into normal voltage, like 240/120 V, for power distribution. The distribution system has different types of transformers, such as single-phase, 3-phase, underground, pad-mounted, and pole-mounted transformers.
The distribution transformer market is segmented by power rating (large (above 100 MVA), medium (10 to 100 MVA), and small (Up to 10 MVA)), cooling type (air-cooled and oil-cooled), phase (single-phase and three-phase), end-user (power utilities(includes renewables, non-renewables, and T&D), industrial, commercial, and residential), and geography (North America, Europe, Asia-Pacific, South America, and the Middle East and Africa). The report also covers the market size and forecasts for the distribution transformer market across the major countries in the region. For each segment, the market size and forecasts have been done based on revenue (USD billion).
By Power Rating
| Large (Above 100 MVA) |
| Medium (10 to 100 MVA) |
| Small (Up to 10 MVA) |
By Cooling Type
| Air-cooled |
| Oil-cooled |
By Phase
| Single-Phase |
| Three-Phase |
By End-User
| Power Utilities (includes, Renewables, Non-renewables, and T&D) |
| Industrial |
| Commercial |
| Residential |
By Geography
| North America | United States |
| Canada | |
| Mexico | |
| Europe | Germany |
| United Kingdom | |
| France | |
| Italy | |
| Spain | |
| Russia | |
| Rest of Europe | |
| Asia-Pacific | China |
| India | |
| Japan | |
| South Korea | |
| ASEAN Countries | |
| Australia and New Zealand | |
| Rest of Asia Pacific | |
| South America | Brazil |
| Argentina | |
| Chile | |
| Rest of South America | |
| Middle East and Africa | Saudi Arabia |
| United Arab Emirates | |
| South Africa | |
| Egypt | |
| Rest of Middle East and Africa |
| By Power Rating | Large (Above 100 MVA) | |
| Medium (10 to 100 MVA) | ||
| Small (Up to 10 MVA) | ||
| By Cooling Type | Air-cooled | |
| Oil-cooled | ||
| By Phase | Single-Phase | |
| Three-Phase | ||
| By End-User | Power Utilities (includes, Renewables, Non-renewables, and T&D) | |
| Industrial | ||
| Commercial | ||
| Residential | ||
| By Geography | North America | United States |
| Canada | ||
| Mexico | ||
| Europe | Germany | |
| United Kingdom | ||
| France | ||
| Italy | ||
| Spain | ||
| Russia | ||
| Rest of Europe | ||
| Asia-Pacific | China | |
| India | ||
| Japan | ||
| South Korea | ||
| ASEAN Countries | ||
| Australia and New Zealand | ||
| Rest of Asia Pacific | ||
| South America | Brazil | |
| Argentina | ||
| Chile | ||
| Rest of South America | ||
| Middle East and Africa | Saudi Arabia | |
| United Arab Emirates | ||
| South Africa | ||
| Egypt | ||
| Rest of Middle East and Africa | ||
Need A Different Region or Segment?
Customize Now
Key Questions Answered in the Report
How large is the global distribution transformer market in 2026?
The distribution transformer market size stands at USD 42.99 billion in 2026.
What CAGR is projected for distribution transformers between 2026 and 2031?
Global demand is forecast to expand at a 7.87% CAGR over the 2026-2031 period.
Which region contributes the largest share of revenue?
Asia-Pacific led with 42.5% of global revenue in 2025 and maintains the fastest regional growth through 2031.
Which cooling technology is growing fastest?
Air-cooled and ester-fluid dry-type designs are advancing at an 8.9% CAGR, outpacing oil-immersed units due to urban fire-safety rules.
Why are single-phase transformers gaining traction?
Residential electrification, rooftop solar backfeed, and EV charging push household peak demand beyond legacy capacity, driving an 8.8% CAGR for single-phase units.
What key factor restricts short-term supply?
Extended lead times caused by skilled-labor shortages and raw-material price volatility limit near-term manufacturing throughput.


