Market Overview
| Study Period | 2020 - 2030 |
|---|---|
| Forecast Data Period | 2025 - 2030 |
| Historical Data Period | 2020 - 2023 |
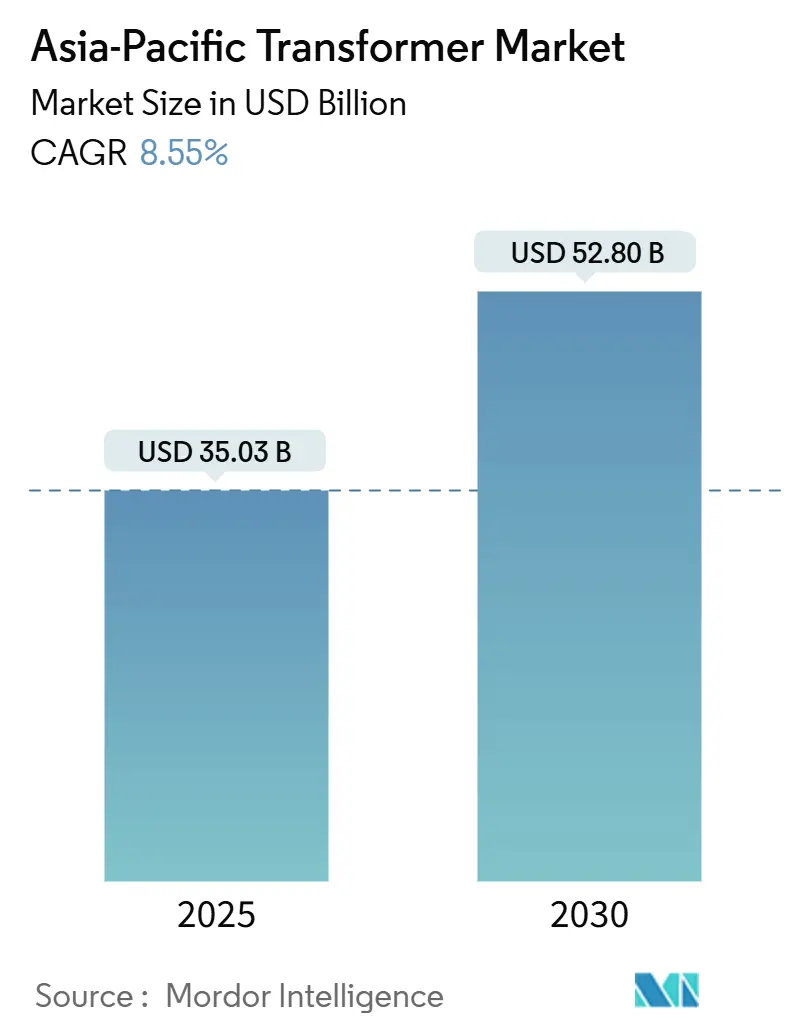
| Market Size (2025) | USD 35.03 Billion |
| Market Size (2030) | USD 52.80 Billion |
| Growth Rate (2025 - 2030) | 8.55% CAGR |
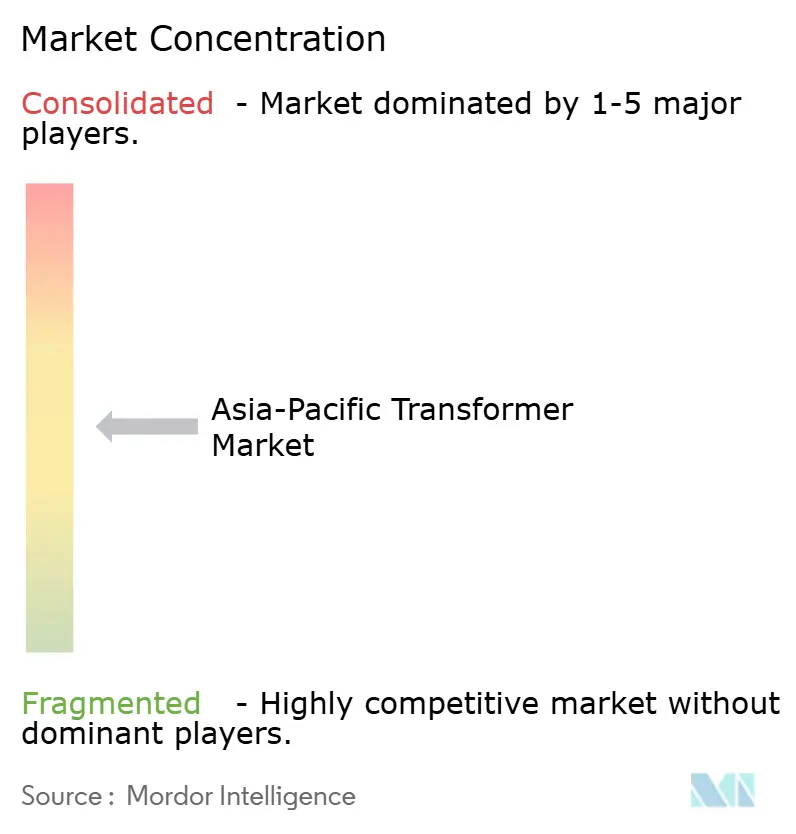
| Market Concentration | Medium |
Major Players *Disclaimer: Major Players sorted in no particular order Image © Mordor Intelligence. Reuse requires attribution under CC BY 4.0. | |
Asia-Pacific Transformer Market Analysis by Mordor Intelligence
The Asia-Pacific Transformer Market size is estimated at USD 35.03 billion in 2025, and is expected to reach USD 52.80 billion by 2030, at a CAGR of 8.55% during the forecast period (2025-2030).
Grid modernization spending, ambitious renewable energy integration mandates, and the retirement of aging substation assets collectively anchor this growth trajectory. China’s State Grid alone has earmarked CNY 650 billion (USD 92.9 billion) for 2025 transmission upgrades, while India’s Revamped Distribution Sector Scheme (RDSS) allocates INR 2.77 lakh crore (USD 33.4 billion) to smart metering and loss‐reduction programs.[1]National Development and Reform Commission, “Notice on Accelerating Power Grid Modernization,” ndrc.gov.cn These investments shift the regional focus from reactive maintenance toward proactive digitalization, positioning transformers as active enablers of energy transition. Medium-rating (10-100 MVA) units, dry-type designs for urban installations, and power transformers required for high-voltage transmission are all seeing above-trend demand. Meanwhile, supply constraints—medium transformer backlogs stretch to 130 weeks and large units can require four-year lead times—create both margin upside and schedule risks, intensifying competitive dynamics.
Key Report Takeaways
- By power rating, medium transformers commanded 54.7% of 2024 revenue; large-rating units are projected to post the quickest 9.0% CAGR through 2030.
- By cooling type, oil-immersed designs accounted for a 71.3% share in 2024, whereas dry-type alternatives are set to expand at an 8.8% CAGR to 2030.
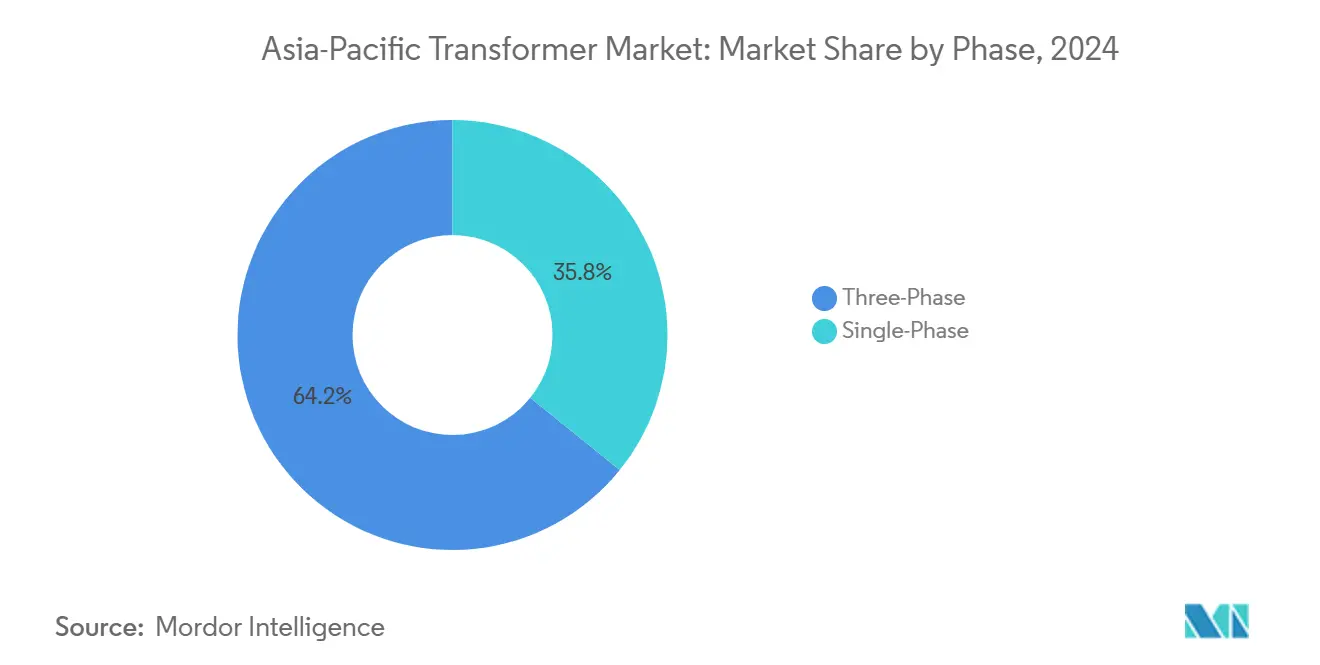
- By phase, three-phase systems led with 64.2% revenue share in 2024 and are advancing at an 8.7% CAGR through 2030.
- By transformer type, distribution units held a 59.9% share of the Asia-Pacific transformers market in 2024, while power transformers are expected to grow at a 9.6% CAGR through 2030.
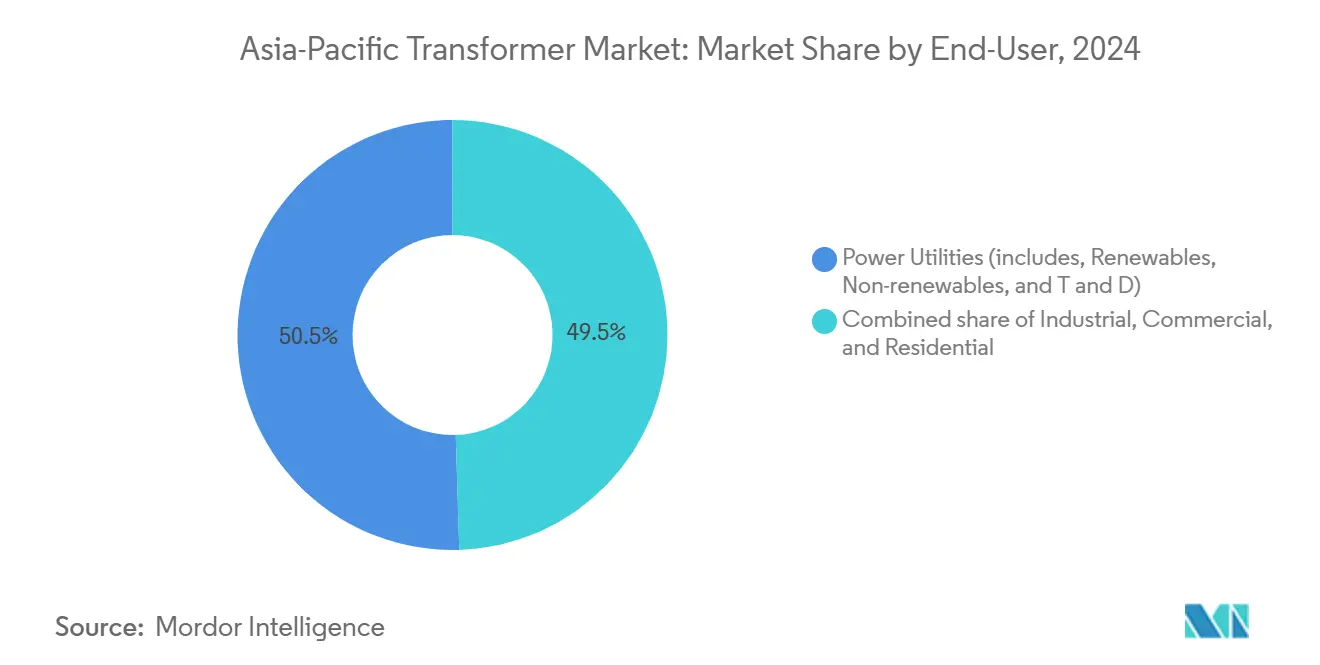
- By end-user, power utilities represented a 50.5% share in 2024; however, residential applications are forecasted to rise at a 9.3% CAGR through 2030.
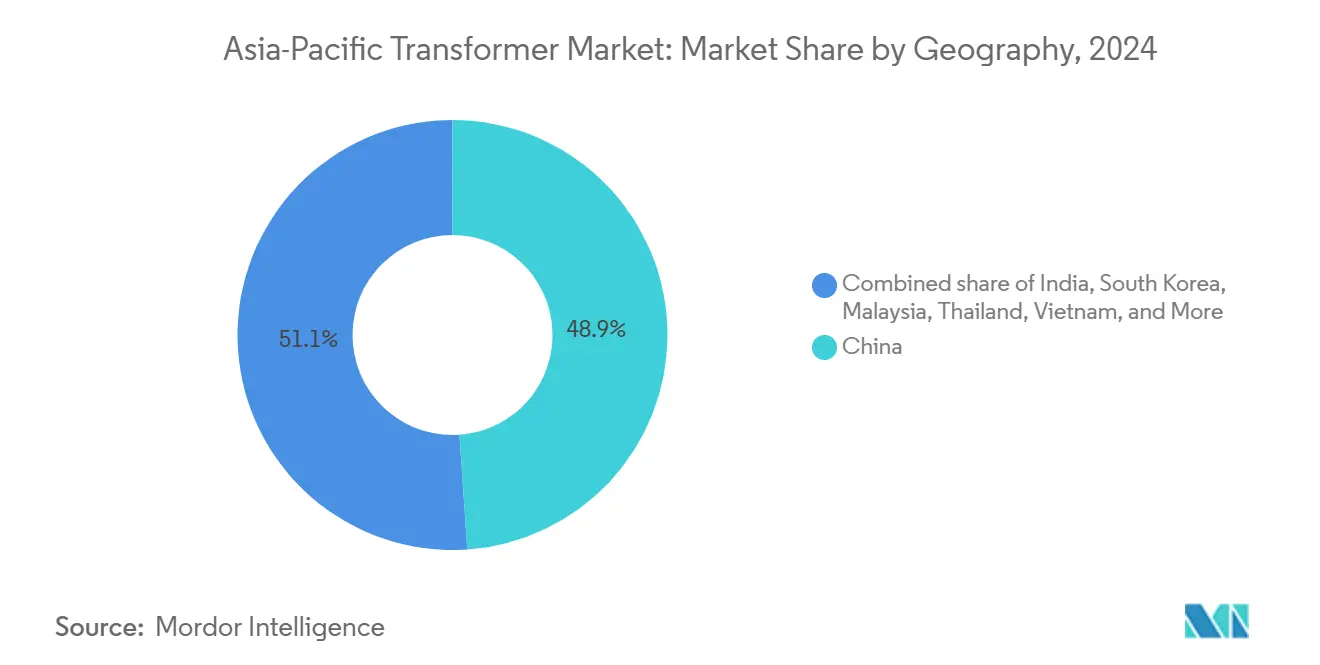
- By geography, China captured 48.9% of 2024 revenue and is expected to register a 9.4% CAGR through 2030, driven by the mandated retirement of S7/S8 units and 500 GW distributed-generation targets.
Asia-Pacific Transformer Market Trends and Insights
Drivers Impact Analysis*
| Driver | (~) % Impact on CAGR Forecast | Geographic Relevance | Impact Timeline |
|---|---|---|---|
| Rising electricity demand from rapid urbanisation & industrialisation | +2.1% | China, India, Southeast Asia core markets | Medium term (2-4 years) |
| Large-scale grid integration of utility-scale renewables | +1.8% | China, Japan, South Korea, with spillover to ASEAN | Long term (≥ 4 years) |
| Government-funded T&D modernisation programmes | +1.6% | China, India, Japan primary; Thailand, Vietnam secondary | Short term (≤ 2 years) |
| Replacement of ageing substation fleet in Tier-1 APAC cities | +1.4% | China Tier-1 cities, Japan, South Korea urban centers | Medium term (2-4 years) |
| Data-centre proliferation requiring high-efficiency distribution transformers | +1.0% | Singapore, Hong Kong, Japan, South Korea data hub markets | Short term (≤ 2 years) |
| Offshore wind build-out driving subsea step-up transformers | +0.8% | China, Taiwan, Japan, South Korea offshore development zones | Long term (≥ 4 years) |
| Source: Mordor Intelligence | |||
Rising Electricity Demand from Rapid Urbanization & Industrialization
Asia-Pacific cities are adding population and manufacturing capacity at a pace that strains legacy distribution networks. China’s plan to support 500 GW of distributed generation and install 12 million electric-vehicle chargers by 2025 necessitates bidirectional transformers capable of managing variable loading and reverse power flows. Regional data-center construction and AI hardware clusters require ultra-high-capacity units above 10,000 kVA, evidenced by Korean export volumes rising 40% to USD 670 million in 2024. Southeast Asian manufacturing hubs in Vietnam and Thailand rely on voltage-regulation transformers to stabilize grids that remain susceptible to intermittent power outages.[2]Reinhausen Group, “Voltage Regulation in Emerging Asian Grids,” reinhausen.com Utilities therefore oversize installations to hedge peak loads, lifting transformer demand beyond baseline projections and reinforcing the positive volume outlook for the Asia-Pacific transformers market.
Large-Scale Grid Integration of Utility-Scale Renewables
Japan’s 7th Strategic Energy Plan aims for a 40-50% share of renewables by 2040, necessitating transformers that can withstand rapid voltage swings and harmonics from inverter-based resources. Offshore wind build-outs spur niche demand for subsea step-up and dry-type units such as the 69 kV HiDry transformers deployed at China’s North-L wind farm.[3]Gulf Oil & Gas, “North-L Offshore Wind Project Installs HiDry Transformers,” gulfoilandgas.com ASEAN’s Power Grid roadmap entails USD 764 billion of cross-border links where HVDC converter transformers connect AC and DC systems, opening a high-value segment for specialized suppliers.[4]Cafebiz, “ASEAN Cross-Border Power Grid Investment Roadmap,” cafebiz.vn Enhanced cycling duty, power reversal, and voltage-support requirements shorten replacement cycles, bringing forward new sales well ahead of traditional depreciation schedules.
Government-Funded T&D Modernization Programs
State-backed spending drives predictable procurement. India’s National Electricity Plan allocates INR 9.12 lakh crore (USD 107.9 billion) for transmission to 2032, including 1,274 GVA of new transformation capacity that must meet high-efficiency and smart-grid specifications. Japan’s Green Transformation Plan sets aside JPY 150 trillion (USD 1 trillion) for grid upgrades with an emphasis on digital monitoring and DER accommodation. China’s National Development and Reform Commission mandates “flexible, intelligent, and digital” distribution networks, accelerating the uptake of IoT-enabled transformers equipped with real-time condition monitoring. Such programs harmonize specifications, creating economies of scale for vendors and compressing deployment timelines.
Replacement of Ageing Substation Fleet in Tier-1 APAC Cities
Transformers installed during the 1980s and 1990s are nearing the end of their life just as urban load profiles are accelerating. China’s compulsory phase-out of S7 and S8 models by 2025 affects thousands of units requiring compact, high-efficiency substitutes that often necessitate full substation redesign. Japanese utilities face similar timelines, as four-decade-old assets must also incorporate seismic resilience following the 2011 earthquake. South Korea’s municipal utilities prioritize underground vault installations to reduce visual impact, demanding bespoke cooling and monitoring solutions. Each replacement often triggers upgrades to upstream and downstream equipment, multiplying the revenue impact across the Asia-Pacific transformers market.
Restraints Impact Analysis*
| Restraint | (~) % Impact on CAGR Forecast | Geographic Relevance | Impact Timeline |
|---|---|---|---|
| Volatile copper & electrical-steel prices | -1.2% | Global, with acute impact on cost-sensitive ASEAN markets | Short term (≤ 2 years) |
| Intense price competition from low-cost regional OEMs | -0.8% | Southeast Asia, India price-sensitive segments | Medium term (2-4 years) |
| Emerging solid-state transformers threatening long-term demand | -0.5% | Japan, South Korea advanced technology adoption markets | Long term (≥ 4 years) |
| ESG-driven shift to aluminium windings raising redesign costs | -0.3% | China, Japan, South Korea environmental compliance focus | Medium term (2-4 years) |
| Source: Mordor Intelligence | |||
Volatile Copper & Electrical-Steel Prices
Copper and grain-oriented electrical steel account for the majority of transformer material costs, making price fluctuations a significant planning hurdle. Disruptions in Asian steel mills shifting to low-carbon production are raising input costs, even as utilities remain under tariff pressure. Copper volatility is especially detrimental for distribution units where winding metal dominates the bill of materials, forcing manufacturers to carry larger working capital buffers and employ hedging tactics that ultimately raise end-user prices. The growing use of aluminum windings offers a partial hedge, but it requires recalibration of network protection and retraining of contractors, adding indirect costs.
Intense Price Competition from Low-Cost Regional OEMs
Emerging suppliers in China, Vietnam, and Indonesia utilize lower labor rates and state incentives to undercut global incumbents, particularly in the standardized distribution transformer market. Local‐content rules amplify this dynamic by steering orders toward domestically assembled equipment. During downturns, price wars intensify as utilities defer non-critical replacements, shifting demand to urgent power‐restoration orders where delivery speed outweighs initial cost. Established players must therefore differentiate through digital technology, lifecycle support, and premium efficiency to defend margins within the Asia-Pacific transformers market.
*Our forecasts treat driver/restraint impacts as directional, not additive. The impact forecasts reflect baseline growth, mix effects, and variable interactions.
Segment Analysis
By Power Rating: Mid-Range Versatility Sustains Leadership
Medium-rating transformers (10-100 MVA) accounted for 54.7% of 2024 revenue, reflecting a central role in industrial complexes and utility substations. Their 9.0% CAGR to 2030 outpaces small and large categories as grid operators favor standardized modules adaptable to multiple voltage tiers. The Asia-Pacific transformers market size for medium units is forecast to exceed USD 28 billion by 2030, boosted by China’s substation retrofits and Southeast Asia’s factory buildouts. Large transformers above 100 MVA are riding the renewable-integration wave, especially for offshore wind and HVDC hubs, whereas small units (<10 MVA) retain relevance in rural electrification.
Beyond versatility, mid-range products now incorporate on-load tap changers, fiber-optic temperature sensing, and dissolved-gas monitoring to satisfy utility digitalization mandates. Korean suppliers, capitalizing on their design expertise in ultra-high-capacity variants exceeding 10,000 kVA, recorded a 40% export growth in 2024, demonstrating that technical capability, rather than price alone, drives share gains.


By Cooling Type: Oil Remains Dominant Amid Urban Shift
Oil-immersed units accounted for 71.3% of 2024 sales, primarily due to their superior heat dissipation and cost efficiency in bulk-power applications. Nonetheless, environmental and fire-safety concerns—especially in densely populated cities and offshore platforms—have accelerated the adoption of dry-type systems. The dry segment is projected to surpass USD 16 billion globally by 2030, with the Asia-Pacific region outpacing the average as infrastructure densifies. Regulators are tightening leak-prevention rules, incentivizing utilities to specify synthetic ester fluids or air-cooled alternatives despite higher upfront costs. Thus, oil remains indispensable for high-capacity substations even as dry-type penetration widens in specialty niches.
Project selection criteria now weigh lifecycle emissions and total cost of ownership alongside purchase price. Offshore wind developers, for instance, select epoxy-cast dry units to mitigate marine pollution risk, trading higher capital expense for regulatory certainty and lower insurance premiums. In many urban renewal programs, footprint constraints favor compact dry designs that eliminate oil containment pits, advancing a gradual shift in Asia-Pacific transformer market preferences.
By Phase: Three-Phase Technology Underpins Network Efficiency
Three-phase systems accounted for 64.2% of 2024 revenue and are expected to grow at an 8.7% CAGR through 2030, as utilities standardize around balanced load delivery. Their efficiency in bulk power transfer, combined with reduced conductor requirements, results in lower overall system losses. Single-phase products, prevalent in sparsely populated zones, continue to serve rooftop solar and rural microgrids; however, burgeoning electrification in peri-urban expanses is tipping procurement toward three-phase layouts to future-proof networks.
Utilities increasingly mandate modular three-phase assets with plug-and-play sensor packages. China’s State Grid, for example, employs unified technical specifications across provincial subsidiaries to curtail spare-parts inventories and streamline workforce training. The trend enhances volume leverage for suppliers while embedding digital monitoring as a baseline feature in the Asia-Pacific transformers market.
By Transformer Type: Power Units Gain Renewables Tailwind
Distribution transformers captured 59.9% of 2024 turnover yet face slower 8.1% growth, whereas power transformers booked a brisk 9.6% CAGR outlook as high-voltage interconnections multiply. The Asia-Pacific transformers market share tilt reflects the increased demand for renewable clusters requiring 400–800 kV step-up capability. HVDC converter transformers and 500 kV AC units dominate tender pipelines for the ASEAN Power Grid and China’s coastal offshore wind bases.
Even so, distribution units remain vital for last-mile delivery and are evolving via digital load-tap controllers and cybersecure communication modules. Power units, in contrast, compete primarily on insulation longevity, short-circuit withstand strength, and innovative active cooling. Suppliers able to certify under multiple national standards, such as IEC 60076 and China’s GB/T 6451, stand to capture cross-border procurement synergies.
By End-User: Residential Electrification Accelerates
Power utilities accounted for 50.5% of end-user demand in 2024, primarily through grid modernization and renewable interconnection projects. Industrial customers, including semiconductor fabs and EV battery plants, rank second, valuing high reliability and harmonic mitigation. The residential segment, though smaller, records a 9.3% CAGR as electrification programs in Vietnam, Indonesia, and rural China extend grid access to millions of households. Advanced metering and the proliferation of rooftop PV also drive the addition of low-capacity transformers within distribution feeders.
IoT-enabled residential transformers enable utilities to remotely detect overloading and phase imbalance, improving outage response times. Pilot deployments in India have demonstrated a 30% improvement in fault-detection accuracy using edge analytics sensor kits. Commercial sites—such as data centers, shopping complexes, and EV-charging depots—add demand for special-duty transformers equipped with K-factor ratings to handle non-linear loads.
Geography Analysis
China commands nearly half of regional revenue, combining unmatched scale with rapid technology turnover. State Grid’s annual spending surpassed CNY 600 billion for the first time in 2025 and is deploying flexible HVDC lines that utilize converter transformers with ratings exceeding 8,000 MVA. The mandatory retirement of legacy S7/S8 units and the requirement to accommodate 500 GW of distributed sources magnify replacement volumes beyond organic load growth.
India follows with robust policy support. The RDSS and National Electricity Plan together unlock over USD 140 billion of grid capital expenditure through 2032, driving the procurement of energy-efficient transformers equipped with smart monitoring features. Renewable-heavy states, such as Rajasthan and Gujarat, tender large 400 kV step-up units for solar and wind parks, while rural electrification programs sustain steady demand for 11–33 kV distribution units. Domestic manufacturing incentives under the Production Linked Incentive (PLI) scheme encourage international vendors to localize assembly lines, intensifying competition.
Mature markets, such as Japan and South Korea, focus on resilience and digital integration. Japan’s 2030 carbon-neutral roadmap funds transformer retrofits with seismic dampening and remote diagnostics. South Korean OEMs, such as HD Hyundai Electric and Hyosung Heavy Industries, leverage their technological leadership to export ultra-high-capacity products, holding order backlogs exceeding USD 5 billion and sustaining operating margins above 14%.
Southeast Asia supplies the fastest percentage growth, albeit from a smaller base. Vietnam, Thailand, and Indonesia are expanding their manufacturing footprints and urban transit systems, prompting utilities to upgrade 22 kV feeders to 35 kV and roll out compact substation transformers. The ASEAN cross-border grid plan schedules multiple 500 kV corridors, each necessitating converter and power transformers that broaden supplier addressable markets.
Competitive Landscape
The Asia-Pacific transformers market balances technological depth from global majors with cost agility from regional contenders. Multinationals such as Hitachi Energy, Siemens Energy, and ABB differentiate via IoT-enabled products and turnkey service portfolios, commanding higher price points among utilities seeking life-cycle support. Regional firms, including TBEA, CG Power, and Korean champions, capitalize on proximity, government incentives, and production flexibility to fulfill time-sensitive orders during global supply chain bottlenecks.
Supply constraints tilt bargaining power toward manufacturers. Medium-rating delivery times now run up to 130 weeks, encouraging utilities to place multi-year blanket orders. Korean suppliers exploit this dynamic; HD Hyundai Electric’s selective tendering pushed operating margins past 20% in 2024, while Hyosung Heavy Industries reached 14% by focusing on specialized high-voltage applications.
Digitalization constitutes the next battleground. Hitachi Energy’s USD 250 million program focuses on integrating fiber-optic sensors and edge analytics, promising predictive maintenance that mitigates unplanned outages. Asian OEMs respond with locally developed monitoring modules that adhere to IEC 62443 cybersecurity norms, aiming to close the feature gap at a lower cost. Niche opportunities persist in subsea, mobile, and voltage-regulation transformers, areas where bespoke engineering outweighs economies of scale.
Asia-Pacific Transformer Industry Leaders
Siemens AG
ABB Ltd.
Mitsubishi Electric Corporation
Hitachi Energy Ltd.
Toshiba Corp.
- *Disclaimer: Major Players sorted in no particular order

Recent Industry Developments
- September 2025: Waaree Energies purchased a 64% stake in Kotsons, integrating transformer production into its solar EPC value chain.
- March 2025: Hitachi Energy unveiled an additional USD 250 million investment in IoT‐enabled transformer digitalization.
- June 2024: China Southern Power Grid has finalized a CNY 173 billion investment package, which includes a significant procurement of UHV transformers.
- April 2024: Hitachi Energy committed USD 1.5 billion to expand global transformer capacity, adding new Asia-Pacific plants to shorten lead times.


Asia-Pacific Transformer Market Report Scope
A transformer is an electrical energy transfer device that either steps up or down the voltage from one alternating-current circuit to one or more other circuits.
The Asia-Pacific Transformer Market is segmented by power rating, cooling type, transformer type, and geography. By power rating, the market is segmented into small, medium, and large. By cooling type, the market is segmented into air-cooled and oil-cooled. By transformer type, the market is segmented into power transformers and distribution transformers. The report also covers the market size and forecasts for the transformer market across the major countries. For each segment, the market sizing and forecasts are based on the revenue (USD Billion).
By Power Rating
| Large (Above 100 MVA) |
| Medium (10 to 100 MVA) |
| Small (Up to 10 MVA) |
By Cooling Type
| Air-cooled |
| Oil-cooled |
By Phase
| Single-Phase |
| Three-Phase |
By Transformer Type
| Power |
| Distribution |
By End-User
| Power Utilities (includes, Renewables, Non-renewables, and T&D) |
| Industrial |
| Commercial |
| Residential |
By Geography
| China |
| India |
| Japan |
| South Korea |
| Malaysia |
| Thailand |
| Indonesia |
| Vietnam |
| Rest of Asia-Pacific |
| By Power Rating | Large (Above 100 MVA) |
| Medium (10 to 100 MVA) | |
| Small (Up to 10 MVA) | |
| By Cooling Type | Air-cooled |
| Oil-cooled | |
| By Phase | Single-Phase |
| Three-Phase | |
| By Transformer Type | Power |
| Distribution | |
| By End-User | Power Utilities (includes, Renewables, Non-renewables, and T&D) |
| Industrial | |
| Commercial | |
| Residential | |
| By Geography | China |
| India | |
| Japan | |
| South Korea | |
| Malaysia | |
| Thailand | |
| Indonesia | |
| Vietnam | |
| Rest of Asia-Pacific |


Key Questions Answered in the Report
What is the current value of the Asia-Pacific transformers market?
The market was valued at USD 35.03 billion in 2025 and is forecast to reach USD 52.80 billion by 2030.
Which power-rating segment is growing fastest?
Large-rating transformers above 100 MVA are projected to advance at a 9.0% CAGR to 2030 due to high-voltage renewable interconnections.
Why are dry-type transformers gaining traction in Asia-Pacific?
Urban density and offshore wind projects favor dry-type units that mitigate oil-leak and fire-safety risks, despite higher upfront costs.
How do supply-chain constraints affect transformer delivery?
Medium-rating lead times extend to 130 weeks and large units can take up to four years, encouraging multi-year procurement agreements.
Which country dominates regional demand?
China holds 48.9% of 2024 revenue, driven by massive grid-modernization spending and mandatory replacement of legacy transformers.
Page last updated on:


