
Market Overview
| Study Period | 2021 - 2031 |
|---|---|
| Forecast Data Period | 2026 - 2031 |
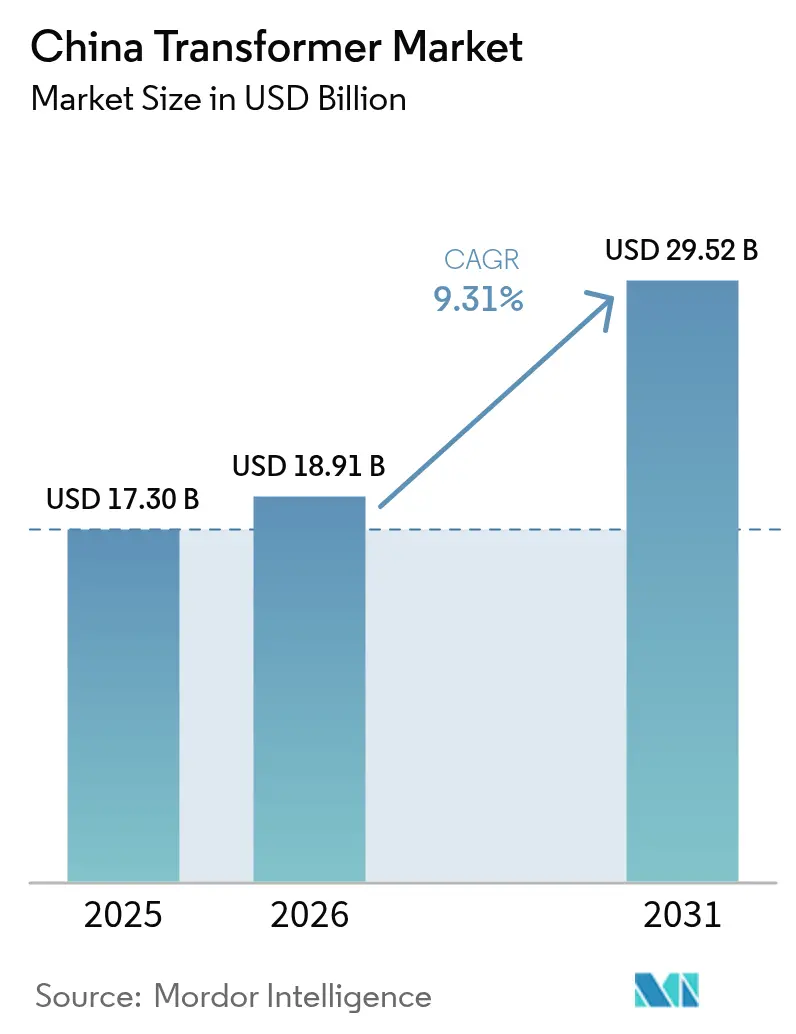
| Base Year Market Size (2025) | USD 17.30 Billion |
| Market Size (2026) | USD 18.91 Billion |
| Market Size (2031) | USD 29.52 Billion |
| Growth Rate (2026 - 2031) | 9.31 % |
| Market Concentration | Medium |
Major Players *Disclaimer: Major Players sorted in no particular order Image © Mordor Intelligence. Reuse requires attribution under CC BY 4.0. | |
China Transformer Market Analysis by Mordor Intelligence
China Transformer Market size market size in 2026 is estimated at USD 18.91 billion, growing from 2025 value of USD 17.30 billion with 2031 projections showing USD 29.52 billion, growing at 9.31% CAGR over 2026-2031.
The surge is anchored by State Grid Corporation’s record USD 88.7 billion capital program for 2025, a springboard for ultra-high-voltage (UHV) corridors, smart-grid upgrades, and digital monitoring projects. Medium-voltage demand escalates as artificial-intelligence data-centers migrate westward to renewable-rich provinces, while mandatory S11/S13 efficiency upgrades accelerate retrofit cycles across industrial hubs. Domestic producers strengthen technological sovereignty in UHV converter designs, and multinational peers intensify local manufacturing to bypass import frictions. Constraints persist in the grain-oriented electrical steel supply and in protracted State Grid tender cycles, yet the China transformer market continues to expand as electrification spreads across rail, electric vehicle, and rooftop solar networks.
Key Report Takeaways
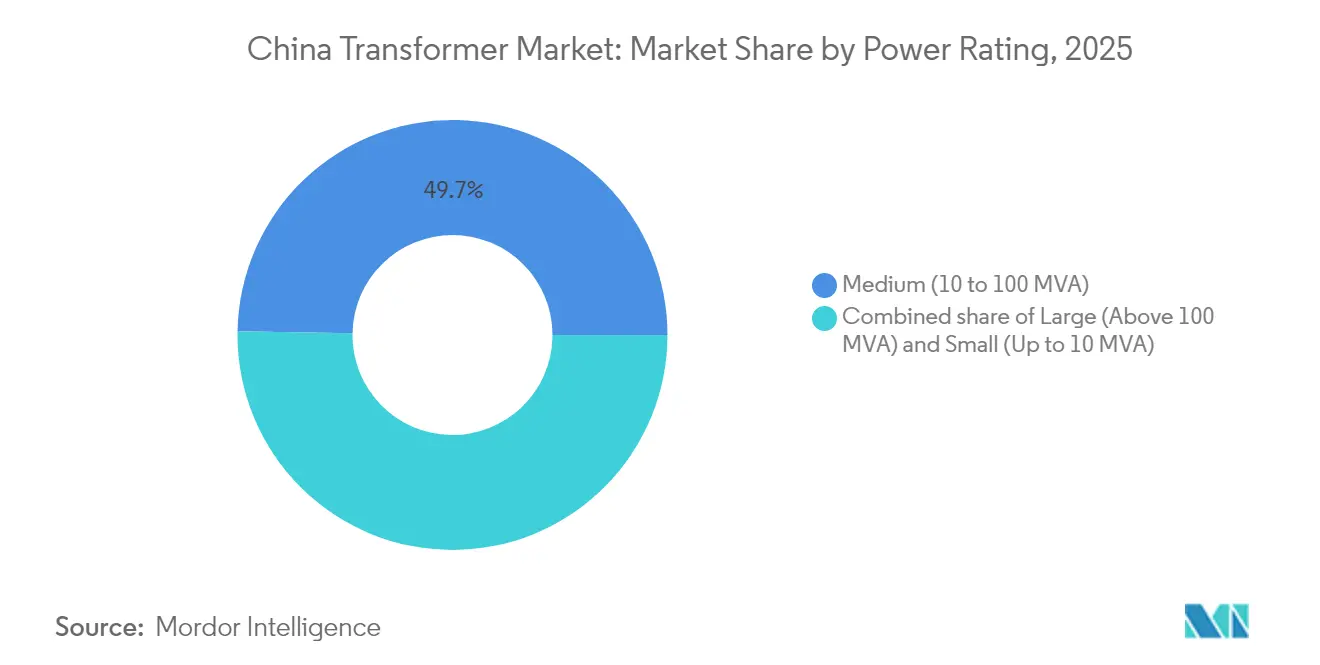
- By power rating, medium-rated units (10–100 MVA) held 49.72% of the China transformer market share in 2025; large units above 100 MVA are projected to grow at a 9.69% CAGR through 2031.
- By cooling type, oil-cooled designs commanded a 76.02% revenue share in 2025, while air-cooled units are expected to rise at a 9.92% CAGR through 2031.
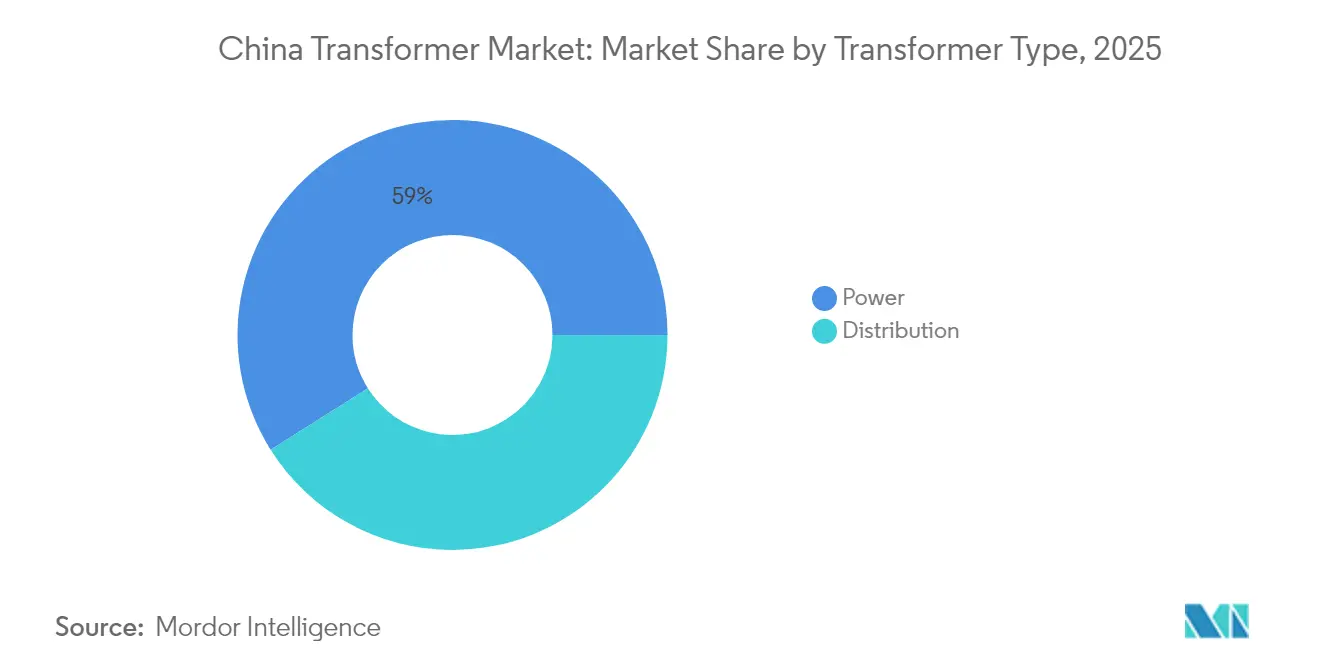
- By transformer type, power transformers accounted for 58.95% of the China transformer market size in 2025 and are forecasted to expand at a 9.44% CAGR between 2026 and 2031.
- By phase, three-phase units dominated the market with an 87.02% share in 2025 and are expected to advance at a 9.36% CAGR through 2031.
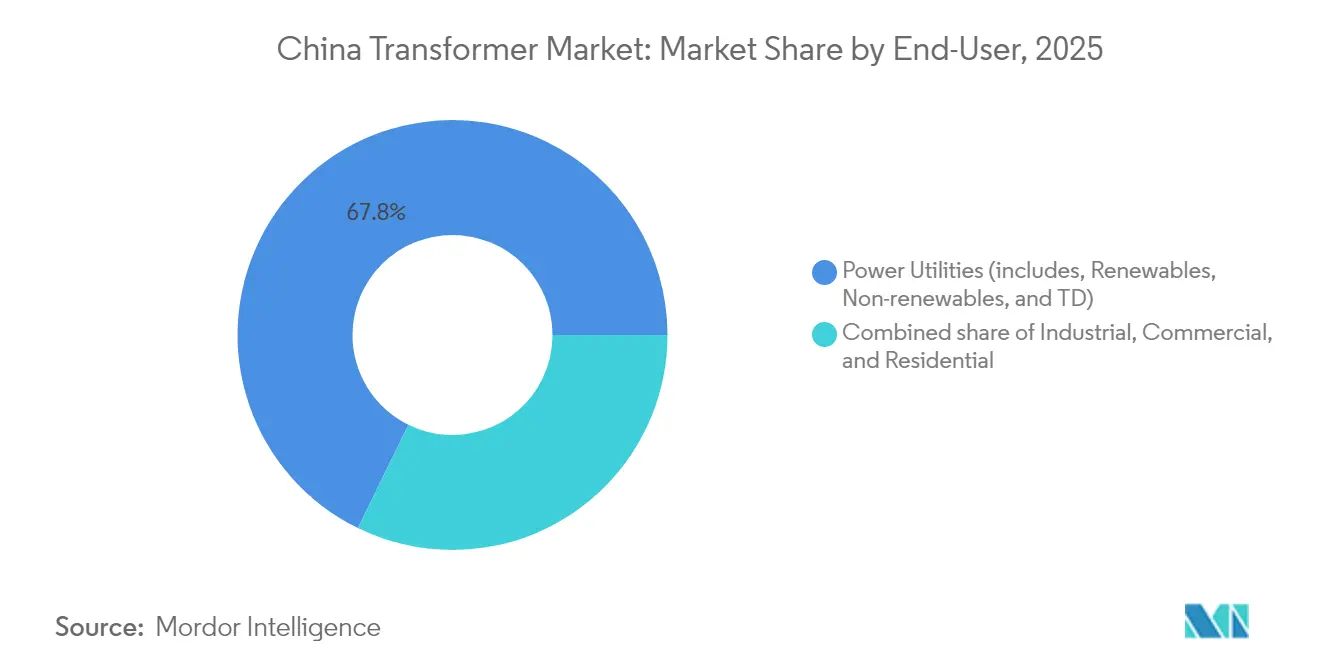
- By end-user, power utilities accounted for 67.75% of revenue in 2025 and are slated to grow at a 9.55% CAGR across the forecast horizon.
Note: Market size and forecast figures in this report are generated using Mordor Intelligence’s proprietary estimation framework, updated with the latest available data and insights as of 2026.
China Transformer Market Trends and Insights
Drivers Impact Analysis*
| Driver | (~) % Impact on CAGR Forecast | Geographic Relevance | Impact Timeline |
|---|---|---|---|
| 14th Five-Year UHV grid build-out | +2.8% | National, concentrated in North-South transmission corridors | Long term (≥ 4 years) |
| Mandatory efficiency-upgrade (S11/S13) rollout | +2.4% | National, accelerated in industrial regions | Medium term (2-4 years) |
| Electrification of metro & rail traction demand | +1.6% | Urban centers, high-speed rail corridors | Medium term (2-4 years) |
| EV fast-charging corridor build-outs | +1.2% | Eastern coastal provinces, major highways | Short term (≤ 2 years) |
| Data-centre MV substation boom | +0.9% | East China hubs, Western computing centers | Short term (≤ 2 years) |
| Bidirectional smart DTs for rooftop PV + storage | +0.5% | Distributed across rural and suburban areas | Long term (≥ 4 years) |
| Source: Mordor Intelligence | |||
14th Five-Year UHV Grid Build-Out
State Grid plans to construct 24 AC and 14 DC UHV links spanning over 30,000 km during the current plan period. Five new lines gained approval in 2024 with investments topping CNY 900 billion, 60% higher than earlier cycles.[1]Editorial Board, “Five New UHV Lines Approved,” Sohu, sohu.com Converter transformers above 100 MVA form the backbone of these projects, and ±800 kV/8 GW standardization cuts construction lead times while boosting domestic content. The 1,901 km Jinsha River–Hubei UHVDC line underscores the need for robust, high-altitude-rated transformers.[2]Staff Writer, “China Builds World’s Highest UHVDC Project,” PEOPLE.CN, people.cn These projects anchor long-term demand, locking in factory orders years ahead of commissioning.
Mandatory Efficiency-Upgrade (S11/S13) Rollout
China’s Industrial Energy Efficiency Improvement Action Plan calls for 80% of new transformers to meet S11/S13 standards by 2025. Energy-efficiency labels, which have been in force since February 2025, accelerate the replacement of legacy S9 units and shift procurement toward low-loss cores.[3]Efficiency Labelling Rules for Transformers,” National Development and Reform Commission, ndrc.gov.cn State Grid’s preference lists amplify market pull, giving high-efficiency suppliers pricing power. Retrofit momentum is strongest in power-intensive coastal provinces, where electricity costs significantly impact industrial margins. Manufacturers capture wider spreads on premium designs while phasing out low-efficiency lines.
Electrification of Metro & Rail Traction Demand
By 2024, thirty Chinese cities were expected to operate 5,850 km of metro track, and high-speed rail expansion continued unabated. Traction transformers for 2×25 kV or co-phase systems must combine compact footprints with sub-1% loss targets; superconducting prototypes already exceed 99% efficiency while weighing under 3 t. The push for neutral-section-free routes fuels demand for V-connected units integrated with static VAR devices. As new metro lines pivot to higher-frequency schedules, transformer redundancy and vibration resilience become design priorities.
EV Fast-Charging Corridor Build-Outs
State Grid deployed 78,000 charging piles across 24 provinces in 2024 and will spend more than CNY 10 billion on new stations by 2025.[4]State Grid Adds 78,000 Charging Piles,” China Daily, chinadaily.com.cn Each fast-charging hub needs 5-10 MVA of capacity, driving bulk orders for pad-mounted and kiosk-type transformers. Installations follow expressways, such as the Beijing–Shanghai and Shenyang–Haikou routes, establishing service intervals of 50 km. Demand hotspots align with areas of high electric-vehicle adoption in Jiangsu, Zhejiang, and Guangdong. Transformer specifications increasingly include harmonic mitigation to protect on-board chargers, while utilities insist on remote monitoring for preventive maintenance.
Restraints Impact Analysis*
| Restraint | (~) % Impact on CAGR Forecast | Geographic Relevance | Impact Timeline |
|---|---|---|---|
| GOES steel price volatility & shortages | -1.8% | Global supply chain, concentrated impact on manufacturing hubs | Short term (≤ 2 years) |
| Lengthy State Grid tender cycles | -1.1% | National, affecting all major infrastructure projects | Medium term (2-4 years) |
| Skilled coil-winding labour scarcity inland | -0.8% | Interior manufacturing regions, western provinces | Long term (≥ 4 years) |
| Cyber-security compliance costs on digital units | -0.4% | National, concentrated in smart grid applications | Medium term (2-4 years) |
| Source: Mordor Intelligence | |||
GOES Steel Price Volatility & Shortages
A tight global supply base for grain-oriented electrical steel pushed transformer selling prices 60-80% above 2020 levels, stretching project budgets. A handful of mills control premium Hi-B grades, exposing Chinese manufacturers to abrupt cost spikes. Lead times for large units have doubled since 2019, exceeding 115 weeks at several plants. Substituting lower-grade steel undermines no-load loss targets, leaving utilities reluctant to accept performance trade-offs. Producers negotiate longer-term supply contracts and pursue in-house slitting lines to maintain or improve margins.
Lengthy State Grid Tender Cycles
Tender windows can run 12-18 months, tying up working capital for bid bonds and prototypes while orders remain pending. A 2024-2026 Action Plan aims to streamline procedures, yet implementation lags. Smaller OEMs without deep balance sheets struggle to finance inventory during evaluation stages, which consolidates awards in favor of incumbents. Technical documentation thresholds and local-content audits add layers of complexity that slow procurement even for seasoned bidders.
*Our forecasts treat driver/restraint impacts as directional, not additive. The impact forecasts reflect baseline growth, mix effects, and variable interactions.
Segment Analysis
By Power Rating: Premium Growth in Large-Capacity Units
Large transformers above 100 MVA posted the fastest growth at a 9.69% CAGR, driven by UHVDC corridors that transport renewable energy from western bases to eastern load centers. Each ±800 kV terminal substation installs converter blocks exceeding 500 MVA, pushing factory test-bay utilization to capacity limits. Medium-rated units delivered 49.72% of shipments in 2025, servicing industrial substations, rail traction, and data-center campuses. Small units under 10 MVA retain relevance in rural electrification and distributed PV schemes but face margin compression amid commodity price swings. Supply tightness for >500 MVA cores grants incumbent producers pricing leverage, while export inquiries from Belt-and-Road markets provide cyclical hedging.
In the Chinese transformer market, large-capacity orders often bundle shunt reactors and phase-shifting units, raising average contract value and deepening OEM-utility collaboration. Medium-rated units benefit from shorter tender cycles and diversified demand across manufacturing clusters. The Chinese transformer industry continues to refine high-temperature insulation systems that widen thermal margins and permit overload operation without accelerated aging.



By Cooling Type: Air-Cooled Designs Capture Urban Share
Oil-cooled units retained a 76.02% share in 2025, owing to proven dielectric strength and cost efficiency in high-voltage service. However, air-cooled alternatives expand at a 9.92% CAGR as municipal fire codes penalize oil-filled equipment in densely populated districts. Cast-resin and vacuum-impregnated technologies now achieve comparable loss levels, benefiting data-center builders who favor minimal containment infrastructure.
Air-cooled transformers are increasingly equipped with forced-ventilation ducts and aluminum heat exchangers, which enhance thermal dissipation. Suppliers integrate online temperature monitoring to predict fan failure risks, thereby extending maintenance intervals. Oil-cooled units remain indispensable for 220 kV and above, where high dielectric requirements and outdoor exposure outweigh the drawbacks associated with oil handling. Hybrid silicone oils with high flash points offer a transitional path, but they come at a premium cost.
By Transformer Type: Power Units Lead Momentum
Power transformers accounted for 58.95% of 2025 revenue and are expected to show the highest forecast growth at a 9.44% CAGR, as backbone transmission upgrades accelerate. UHV performance demands extended creepage distances, multi-section windings, and advanced tap-changer designs. Distribution transformers underpin urban densification and rural electrification, but their expansion slows as efficiency regulations cap new-build volumes.
Power-class orders in the China transformer market often incorporate online dissolved-gas analysis and digital nameplates for lifecycle tracking. The integration of Flexible AC Transmission System (FACTS) drives demand for transformer-compatible bypass reactors and harmonic filters, thereby enlarging the project scope. The China transformer industry leverages accumulated UHV expertise to bid competitively on overseas high-voltage tenders, broadening revenue streams beyond the domestic cycle.
By Phase: Three-Phase Dominance Persists
Three-phase units accounted for 87.02% of shipments in 2025 and are expected to grow at a 9.36% CAGR as industrial motors, rail converters, and data-center UPS systems standardize on three-phase supply. Single-phase transformers remain common in rural distribution and certain residential loads but face gradual displacement as mini-three-phase pods reach remote villages.
Smart-grid pilots require three-phase transformers equipped with edge-computing modules that analyze load imbalances and voltage events in real-time. Utilities prefer modular three-phase clusters for rapid replacement, which reduces outage duration and simplifies spares inventory. The Chinese transformer market incorporates predictive analytics firmware into three-phase designs, enhancing operational resilience.
By End-User: Utilities Anchor Demand Growth
Power utilities captured 67.75% of purchases in 2025 and will sustain a 9.55% CAGR amid record grid investment. State Grid and China Southern Power Grid issue multi-year framework agreements, ensuring visibility for OEM production planning and ensuring timely execution. Industrial customers rank second, led by the steel, aluminum, and chemical sectors, which are retrofitting their plants for energy efficiency.
The commercial and residential segments are accelerating alongside rooftop solar, EV charging, and cold-chain warehouse development. Data-center developers negotiate tri-party agreements with utilities and OEMs to secure transformer supply under constrained global capacity. The Chinese transformer market responds with quick-ship programs for smaller units, while giga-projects lock reserved slots years in advance.
Geography Analysis
East China remains the primary consumption hub, characterized by dense industrial clusters in Jiangsu, Zhejiang, and Shanghai, which drives steady transformer replacement. Medium-voltage turnover rates are high, and air-cooled adoption peaks under stringent urban fire regimes. North China follows, buoyed by cross-regional UHV lines that transmit Inner Mongolia's wind output; converter blocs dominate tender documents and amplify regional project values. Central and South China emerge as fast-growth provinces. Guangdong’s electrification of heavy-manufacturing corridors spurs 110 kV substation builds, while Hunan and Jiangxi accelerate S11/S13 retrofits to curb network losses. Southwest China benefits from hydropower evacuation schemes along the Jinsha and Yalong rivers, calling for high-altitude rated transformers with seismic reinforcement.
Northwest provinces harness vast solar and wind bases that feed ±800 kV corridors, demanding robust step-up units that are tolerant to sandstorm conditions. Northeast China confronts aging industrial infrastructure; utilities there prioritize refurbishment to deliver stable power for petrochemical and shipbuilding plants. Local OEM capacity in Liaoning reduces lead times, although order volumes lag behind those of its coastal peers.
Regulatory Landscape
Transformer efficiency and market access in China are anchored by mandatory national standards and government-led procurement rules. GB 20052 (updated in 2024) sets minimum energy-efficiency requirements for power transformers, with compliance overseen by the State Administration for Market Regulation (SAMR); the update narrows the gap between domestic requirements and leading international efficiency indices. In parallel, centralized procurement by State Grid Corporation of China (SGCC) and China Southern Power Grid links eligibility to energy-saving compliance for newly added transformers, reinforcing the shift away from legacy low-efficiency designs.
Industrial policy further tightens the compliance-and-upgrade cycle. The Power Equipment Industry Steady Growth Work Plan (2025-2026), jointly issued by the Ministry of Industry and Information Technology (MIIT), SAMR, and the National Energy Administration (NEA), promotes the adoption of energy-saving transformers in grid procurement and supports higher-quality development of power equipment manufacturing. NEA also continues to steer technical upgrading through programs such as the sixth batch of major technical equipment in the energy field (first set) notice issued in February 2026, which emphasizes new power systems and energy-system digitalization and raises requirements for smart and cyber-compliant transformer solutions.
Competitive Landscape
The Chinese transformer market demonstrates moderate concentration. Domestic leaders TBEA, China XD Group, and NR Electric leverage policy alignment and vertically integrated supply chains to corner UHV tenders. They secure upstream GOES quotas and operate in-house test bays exceeding 1,000 MVA, mitigating third-party bottlenecks.
International firms Hitachi Energy, Siemens, and ABB counter with advanced insulation design, partial-discharge diagnostics, and global project references. Hitachi Energy’s USD 1.5 billion expansion, including upgrades in Chongqing, signals a long-term commitment. Strategic joint ventures help meet localization thresholds and accelerate certification for encryption modules.
Technology differentiation dictates competition. Superconducting rail units, cyber-secure digital transformers, and bidirectional solid-state platforms represent high-margin niches. Supply chain resilience strategies, such as in-house core slitting and strategic silicon-steel stockpiles, play a decisive role in contract awards. The market rewards vendors that deliver lifecycle analytics and remote-service ecosystems aligned with smart-grid objectives.
China Transformer Industry Leaders
TBEA Co., Ltd.
China XD Group
Siemens Energy
Hitachi Energy
ABB Ltd.
- *Disclaimer: Major Players sorted in no particular order


Market Opportunities and Future Outlook
UHV transmission build-out and grid renewal create a clear pull for large-capacity power transformers and associated converter-transformer packages. SGCC has communicated a 15th Five-Year Plan fixed-asset investment program of 4 trillion yuan, and its 2026 UHV pipeline is described as "Five DC Four AC" with investment exceeding 120 billion yuan. This keeps demand centered on >100 MVA classes, converter stations, and step-up transformer systems tied to west-to-east power transfer corridors, with execution visible in commissioning milestones such as the Shaanbei-Anhui +-800 kV UHVDC project (commissioned in June 2026), which supports multi-year equipment ordering.
A second opportunity layer is emerging from standard-driven replacement and digitalization at the medium-voltage and distribution edge. GB 20052-2024 (effective February 2025) accelerates the replacement of older, higher-loss units, while new technical specifications for oil-immersed smart power transformers issued in July 2025 and standardization design guidance implemented in December 2025 support repeatable designs, faster qualification, and broader uptake of monitoring-ready transformers. Demand hotspots include MV substations built for AI data-center campuses and fast-charging hubs, and utility programs that specify online monitoring and power-quality features create room for suppliers to package efficiency compliance, digital sensors, and cybersecurity-ready communications into standardized products that can pass centralized procurement thresholds.
Recent Industry Developments
- June 2026: China XD Electric reported that six subsidiaries secured a combined CNY 1.90 billion contract from State Grid Corporation of China. The win reinforces incumbent advantage in utility tenders and expands delivered volumes across high-voltage and grid equipment categories that typically bundle transformer-related scope.
- May 2026: Hitachi Energy began transporting a 750 MVA, 800 kV HVDC VSC transformer from Sweden to China for the Gansu-Zhejiang UHVDC project. The shipment highlights the technical ceiling for UHV converter-transformer designs and raises competitive pressure around test capability, insulation systems, and delivery logistics for very large units.
- April 2026: Power Automation (an SP Group subsidiary) partnered with TBEA to expand its primary power equipment portfolio, naming TBEA as the exclusive distributor for selected equipment in Singapore. The move supports TBEA’s outbound channel development and increases exposure for Chinese transformer OEMs in nearby export markets that value standardized products and reliable after-sales support.


Research Methodology Framework and Report Scope
Market Definition and Coverage
This market covers the value of electrical transformers sold and installed in China for stepping voltage up or down across generation, transmission, and distribution networks, as well as for industrial and commercial power systems.
Scope exclusions: We exclude purely service-only revenue (repairs and maintenance), used equipment resale, and components sold without a complete transformer unit.
Segmentation Overview
- By Power Rating
- Large (Above 100 MVA)
- Medium (10 to 100 MVA)
- Small (Up to 10 MVA)
- By Cooling Type
- Air-cooled
- Oil-cooled
- By Phase
- Single-Phase
- Three-Phase
- By Transformer Type
- Power
- Distribution
- By End-User
- Power Utilities (includes, Renewables, Non-renewables, and T&D)
- Industrial
- Commercial
- Residential
Data Sources, Market Sizing, and Validation
Desk Research
Desk work starts with building the demand context in China, so we do not treat the market as a single number without an electricity system behind it. We review public power and grid statistics and planning signals from sources such as the National Energy Administration (NEA), the National Bureau of Statistics of China (NBS), and the China Electricity Council, and then we align those indicators with grid capex and project announcements.
On the supply and trade side, we also use customs trade series, relevant HS-code import and export releases, and reputable press coverage to understand pricing pressure, lead times, and where product is moving. Patent databases are referenced to sense technology direction (for example, higher-efficiency designs and insulation upgrades), and company filings and investor materials are used to sanity-check capacity adds and backlog commentary. The sources listed here are illustrative, and many other public documents and datasets were also consulted for data capture, cross-checking, and clarification.
Primary Interviews and Surveys
Primary work is used to pressure-test the model inputs that are not cleanly visible in public sources, especially product mix shifts and China-specific pricing behavior. We spoke with stakeholders across utilities, EPC and procurement teams, industrial buyers, and channel participants, and we used expert feedback to confirm replacement cycles and tendering patterns across major provinces and grid buildout corridors.
Distribution of primary research fieldwork respondents
| Company type | Respondent position |
|---|---|
| Top tier: 34% | CXOs: 15% |
| Mid tier: 49% | Functional/Unit leaders: 39% |
| Smaller Players: 17% | Managers: 46% |
Market-Sizing & Forecasting
Sizing is built from a top-down view where grid investment signals and electricity infrastructure buildouts are converted into transformer demand pools, and then expressed in value using observed price bands by rating and application. To keep the totals realistic, the output is corroborated with selective bottom-up checks like sampled tender awards, a few supplier revenue roll-ups, and ASP times volume approximations for commonly procured distribution classes.
Key inputs that shape the model include annual grid capex direction, the pace of transmission and distribution expansion, replacement needs tied to equipment age and reliability programs, the shift toward renewables that changes step-up and step-down requirements, and price movement linked to core materials and delivery lead times. For the forecast, scenario analysis is used around grid spending intensity and renewable additions, and the chosen path is aligned to what interviewees expect on tender cadence, pricing resets, and mix changes. Where bottom-up evidence is thin for niche transformer types, we apply conservative penetration assumptions and then re-check the implied volumes against known installation and procurement patterns.
Data Validation & Update Cycle
Validation is done through triangulation across independent signals, and not by trusting any single dataset. We compare the modeled value against trade movement, tender intensity, and practical shipment capacity indicators, and then review outliers and correct them before sign-off.
If a variance is large, we re-check the driver assumptions and re-contact select participants to confirm whether the issue is mix, pricing, or timing. Reports are refreshed annually, and interim updates are triggered when material events occur such as policy shifts, major grid spending changes, or sharp input-cost swings. Before delivery, an analyst completes a fresh review pass so the published numbers reflect the latest available information.
Mordor Intelligence's China Transformer Market Size Compared Against Other Published Estimates
Published values for the China transformer market can look far apart because different authors mix production, trade, and domestic consumption into one figure, and they also pick different starting years and price assumptions. We try to keep the sizing tied to a repeatable demand story so readers can see what moves the number and what does not.
Some estimates lean toward manufacturing output value, which can be much higher because it can include goods made for export and can double count through the supply chain. Other figures tilt conservative by focusing mainly on a single transformer class or by holding ASPs flat even when tenders show reset cycles, and FX conversion timing can further shift USD totals.
Benchmark comparison
| Source | Market Size | Gaps in Research Methodology |
|---|---|---|
| Mordor Intelligence | USD 17.30 B (2025) | |
| Industry Association A | USD 43.50 B (2025) | This figure reflects manufacturing output value, which can include export-bound production and can also blend intermediate sales that are not equal to China end-use demand. |
| Trade Journal B | USD 18.40 B (2026) | The number is presented for a forward year and appears to apply broad average pricing without clearly separating replacement-driven distribution demand from new build transmission requirements, which can shift the mix and the total. |
The spread is mainly explained by whether the published figure represents production output or actual domestic consumption, and how price and mix are handled across ratings. Some sources lean into factory output value, and then export volume gets pulled into the total, but Mordor Intelligence counts market value as China demand for complete transformer units based on grid and end-user procurement patterns, followed by rating-linked pricing checks.


Key Questions Answered in the Report
What is the current value of the China transformer market?
It stands at USD 18.91 billion in 2026 and is projected to hit USD 29.52 billion by 2031.
Which transformer segment will grow the fastest through 2031?
Large units above 100 MVA are set to expand at a 9.69% CAGR owing to UHV transmission builds.
Why are air-cooled transformers gaining share in China?
Urban fire-safety rules and data-center preferences favor oil-free designs that cut containment costs.
How is State Grid’s 2025 investment influencing demand?
The record USD 88.7 billion budget accelerates UHV projects and digital upgrades, lifting utility transformer orders.
What material constraint affects transformer prices?
Volatile grain-oriented electrical steel supply pushes up costs and extends delivery lead times.
Which companies lead the high-voltage transformer segment?
Domestic champions TBEA, China XD Group and NR Electric hold most UHV contracts, while Hitachi Energy and Siemens supply advanced digital units.
Page last updated on:


 Your data is secure and never sold or shared.


