Distribution Board Market Size and Share
Market Overview
| Study Period | 2021 - 2031 |
|---|---|
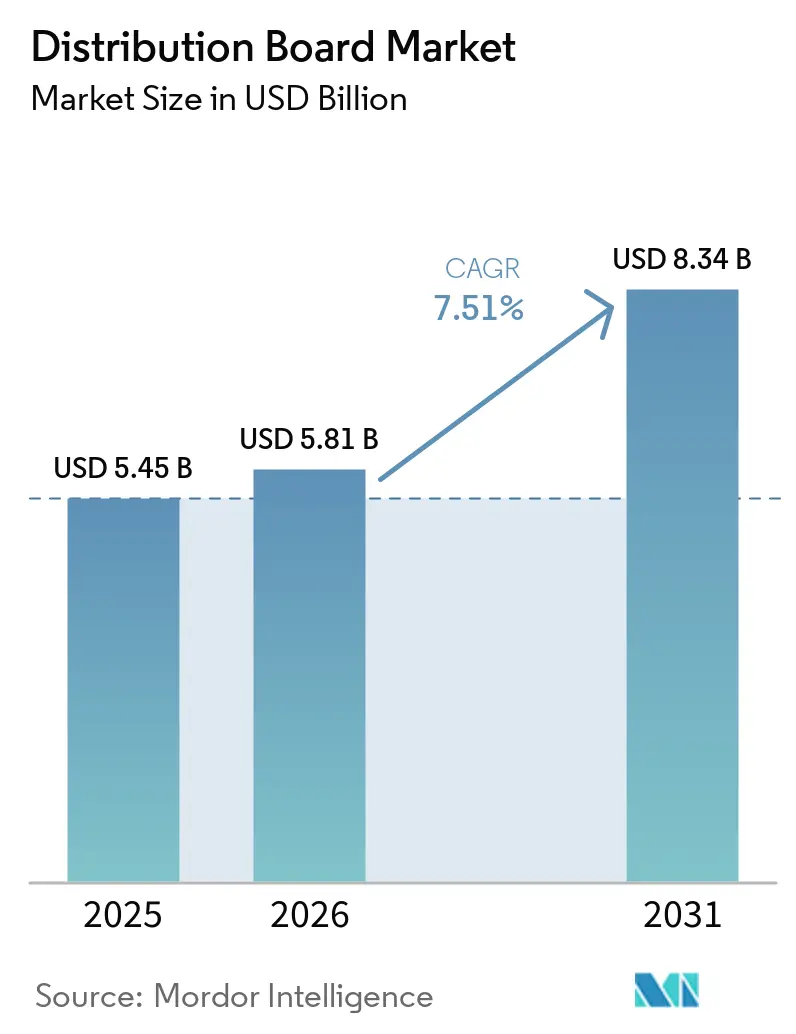
| Market Size (2026) | USD 5.81 Billion |
| Market Size (2031) | USD 8.34 Billion |
| Growth Rate (2026 - 2031) | 7.51% CAGR |
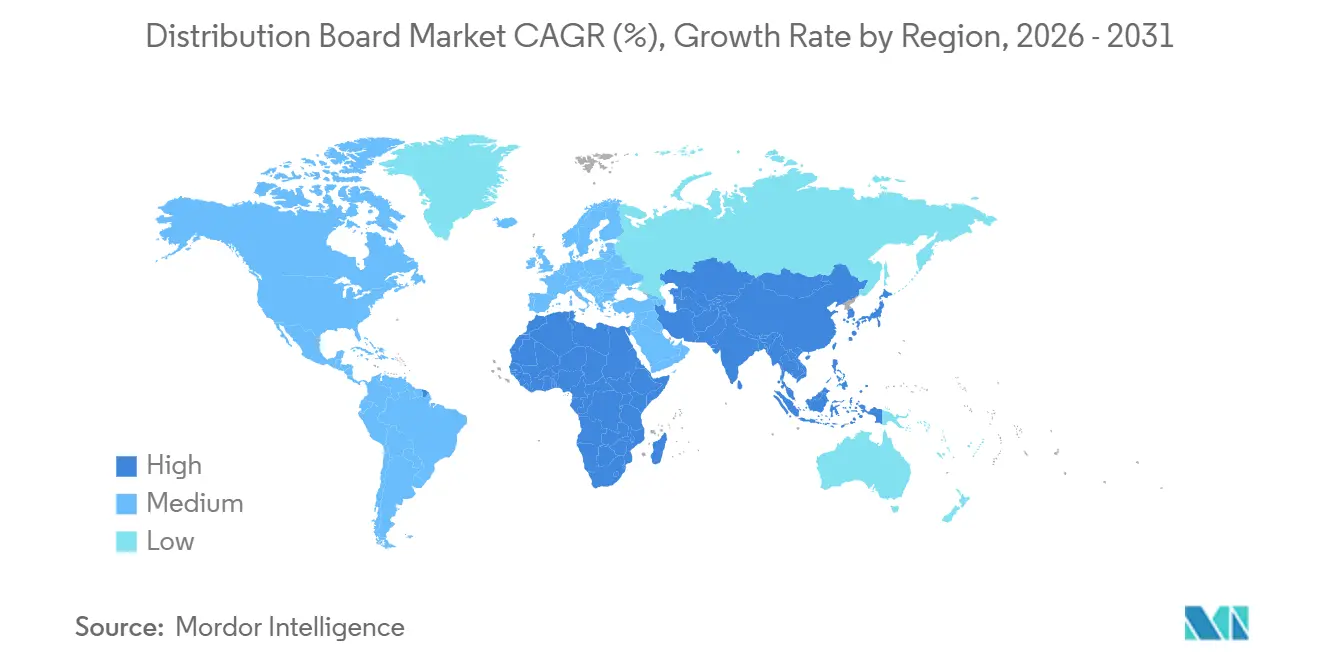
| Fastest Growing Market | Middle East and Africa |
| Largest Market | Asia Pacific |
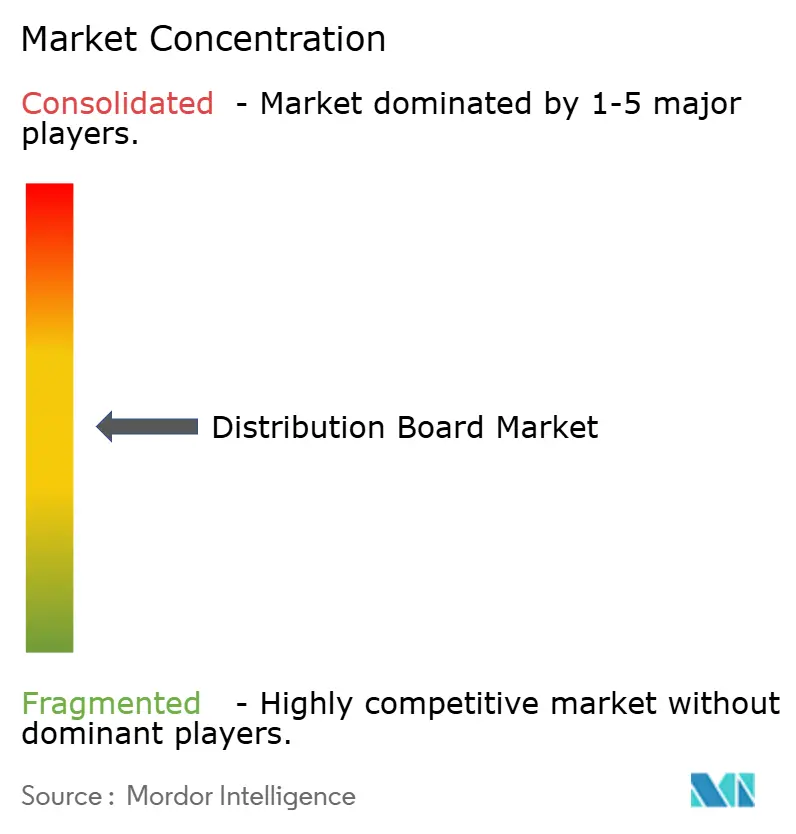
| Market Concentration | Medium |
Major Players *Disclaimer: Major Players sorted in no particular order Image © Mordor Intelligence. Reuse requires attribution under CC BY 4.0. | |
Distribution Board Market Analysis by Mordor Intelligence
The Distribution Board Market size is projected to expand from USD 5.45 billion in 2025 and USD 5.81 billion in 2026 to USD 8.34 billion by 2031, registering a CAGR of 7.51% between 2026 to 2031. Momentum stems from hyperscale data-center construction, rooftop-solar proliferation, and the rollout of EV-charging depots, all of which demand larger volumes of pre-certified, modular electrical panels.[1]Reuters, “Grid Modernization Initiatives Accelerate Across Asia,” reuters.com Asia-Pacific anchors revenue with a 44.7% stake, while the Middle East and Africa promise the quickest expansion at 9.4% as Saudi giga-projects and UAE digital-infrastructure builds accelerate.[2] Financial Times, “Amazon Announces Electrification of 100,000 Delivery Vans by 2030,” ft.com Low-voltage assemblies dominate on account of grid-edge applications, yet they also clock the fastest segmental growth as PV, battery, and charger installations scale.[3]Wall Street Journal, “IEC 61439 Standards for Distribution Boards,” wsj.com Competitive dynamics remain moderate: ABB, Siemens, and Schneider Electric leverage global service footprints and IEC 61439 portfolios, whereas regional challengers such as Havells and CHINT win on speed and localization.
Key Report Takeaways
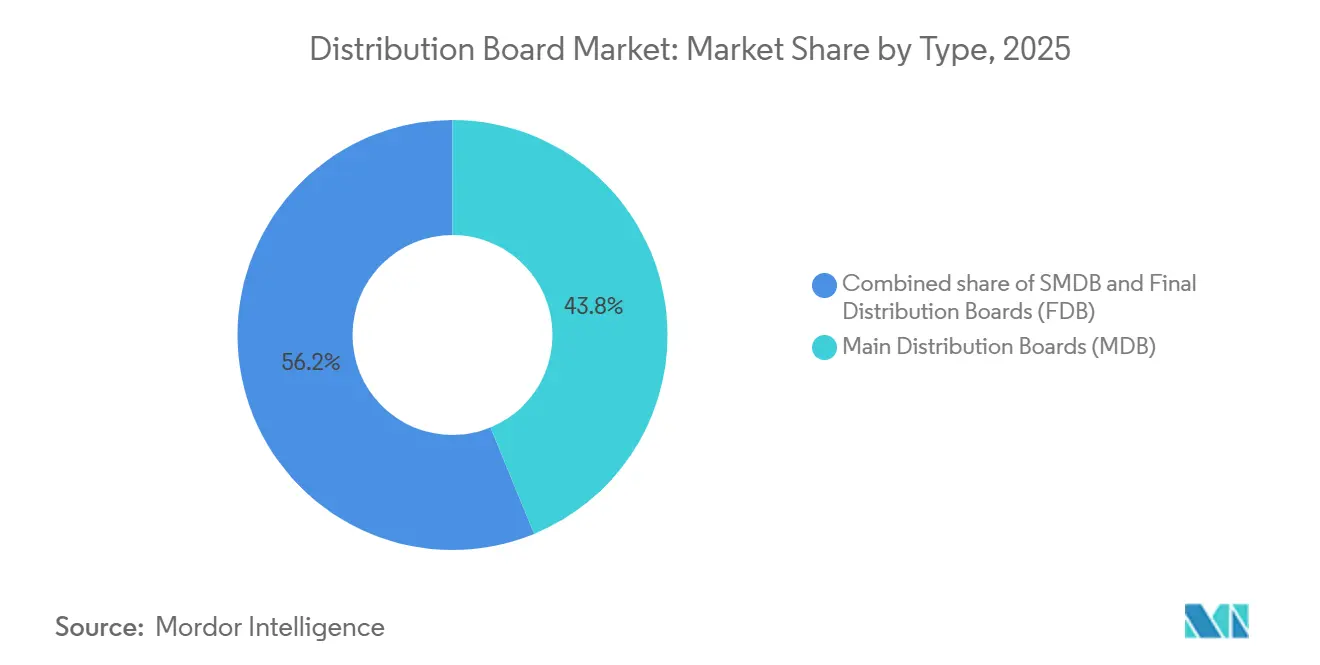
- By type, main distribution boards led with 43.8% of the distribution board market share in 2025, while final boards are tracking a 9.1% CAGR through 2031.
- By voltage level, low-voltage units captured 65.1% of the distribution board market size in 2025 and are projected to expand at a 7.9% CAGR through 2031.
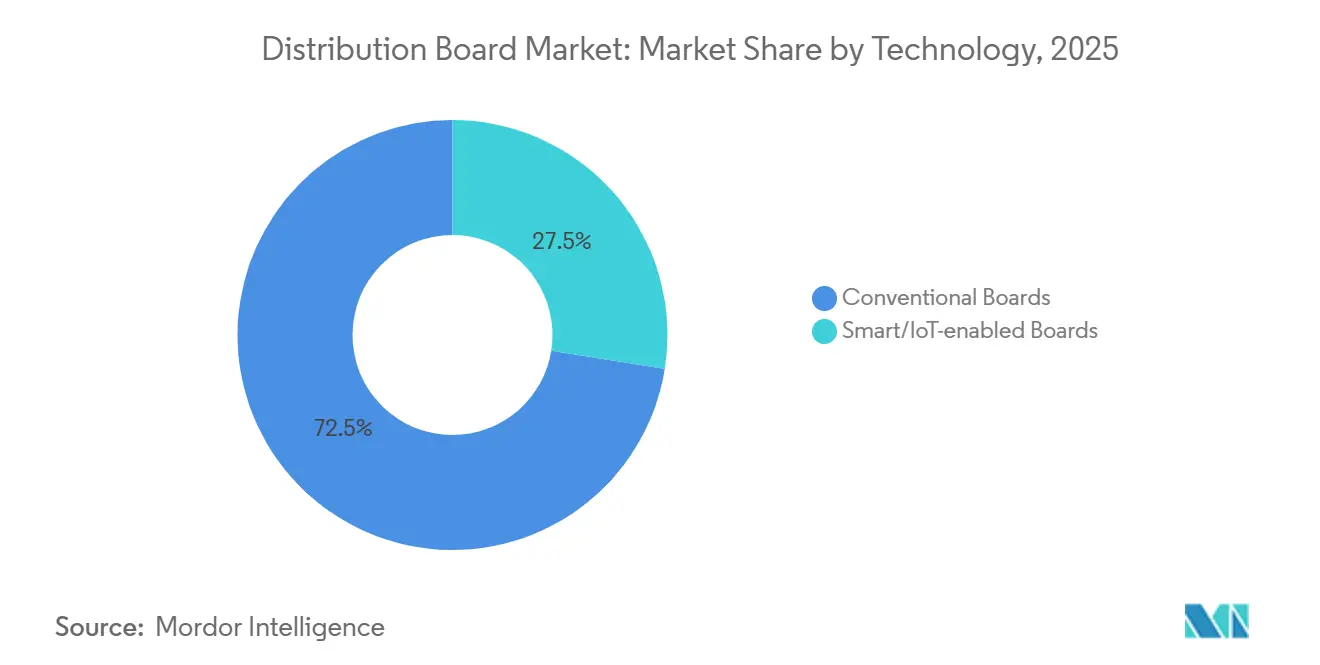
- By technology, conventional boards held 72.5% revenue share in 2025; smart/IoT-enabled variants are advancing at a 10.5% CAGR to 2031.
- By mounting, wall-mounted systems accounted for a 60.6% share in 2025, whereas floor-standing configurations are set for an 8.2% CAGR to 2031.
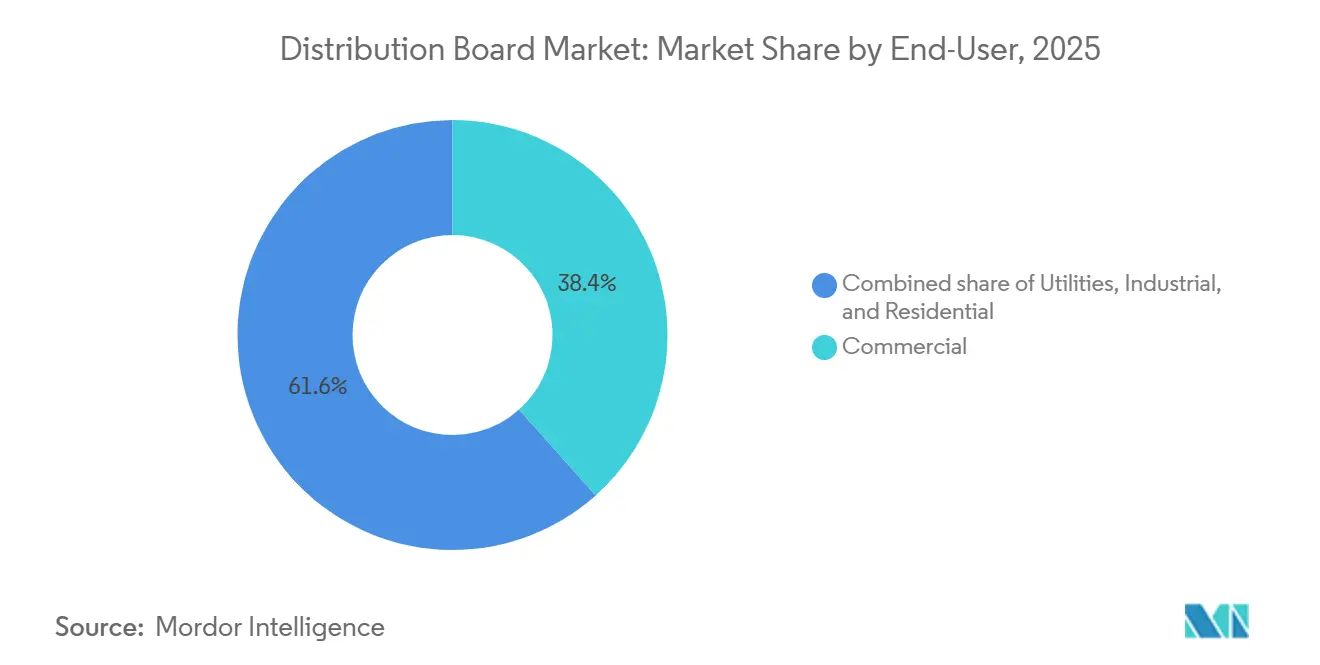
- By end-user, the commercial segment commanded 38.4% of 2025 revenue, but residential applications are pacing ahead at an 8.8% CAGR to 2031.
- By geography, Asia-Pacific held 44.7% of 2025 sales, while the Middle East and Africa region is forecast to grow at a 9.4% CAGR through 2031.
Note: Market size and forecast figures in this report are generated using Mordor Intelligence’s proprietary estimation framework, updated with the latest available data and insights as of January 2026.
Global Distribution Board Market Trends and Insights
Drivers Impact Analysis*
| Driver | (~) % Impact on CAGR Forecast | Geographic Relevance | Impact Timeline |
|---|---|---|---|
| Rapid build-out of data-center capacity | 1.80% | APAC, North America | Medium term (2-4 years) |
| Grid-modernization mandates | 1.50% | North America, Europe, India, China | Long term (≥ 4 years) |
| Rooftop-PV + storage retrofits | 1.30% | APAC, Europe, North America | Medium term (2-4 years) |
| Shift to prefabricated electrification packages | 0.90% | Global | Short term (≤ 2 years) |
| Digitization of O&M via predictive analytics | 0.70% | Global utilities, industry | Long term (≥ 4 years) |
| Surge in EV-fleet depot projects | 1.10% | North America, Europe, China | Medium term (2-4 years) |
| Source: Mordor Intelligence | |||
Rapid Build-Out of Data-Center Capacity
Hyperscale operators added 1,200 MW in 2025 and have already pre-booked equipment for 1,800 MW of annual builds by 2027.[4]Bloomberg News, “Rooftop Solar Installations Surge to 78 Gigawatts Globally,” bloomberg.com Each facility specifies 50-150 distribution boards to manage redundant feeds, battery strings, and cooling loads, pushing suppliers with pre-certified modular products to the front of bid lists. The move toward 48-V DC distribution inside racks is stimulating demand for hybrid AC-DC panels capable of seamless utility, generator, and lithium-battery interfaces. Northern Virginia, Singapore, and Frankfurt together absorbed 38% of global hyperscale capacity additions in 2025 and pulled distribution-board lead times forward by up to nine months. Operators now request embedded power-quality analytics that flag harmonic distortion and voltage sags in real time, thereby supporting 99.99% uptime commitments.
Grid-Modernization Mandates (Smart-Grid Roll-Outs)
India’s Revamped Distribution Sector Scheme budgeted USD 38 billion for network upgrades through 2025, including millions of advanced distribution transformers and associated switchgear. The European Union’s REPowerEU push compels members to accommodate 600 GW of renewables by 2030, necessitating bi-directional boards at the grid edge. China’s State Grid installed 420,000 intelligent terminals in 2025, trimming technical losses by up to 6%. Equipment must now comply with IEC 61850 to plug into utility SCADA layers. Transitioning from mechanical breakers to electronic trip units has doubled maintenance intervals, lowering lifecycle expenses for network owners by 12-18%.
Explosion of Rooftop-PV + Storage Retrofits (Last-Mile Boards)
Global solar-plus-battery additions climbed to 78 GW in 2025, up 50% since 2023. Every rooftop plant demands a dedicated final board that isolates inverters, batteries, and grid tie-ins, thereby decoupling electrical-panel demand from new-build cycles. California’s Title 24 and Germany’s KfW 442 subsidy bring solar-ready panels forward by two to three years. The popularity of DC-coupled batteries elevates the need for arc-fault detection and micro-PV breakers inside the enclosure. Prefabricated kits cut on-site labor by as much as 50%, allowing contractors to finish residential jobs in a single afternoon.
Surge in EV-Fleet Depot Electrification Projects
Amazon’s 100,000-van program and UPS’s EUR 1 billion fleet upgrade each require depot boards that handle 350-kW fast chargers and megawatt-level peak draws. Typical warehouses now install 8-15 floor-standing panels for load balancing and demand-charge mitigation. Operator specifications increasingly call for energy-management software that defers charging during peak tariffs, trimming electricity bills by up to 30%. Vehicle-to-grid pilots raise interest in bi-directional boards able to export stored energy back to utilities during demand-response events.
Restraints Impact Analysis*
| Restraint | (~) % Impact on CAGR Forecast | Geographic Relevance | Impact Timeline |
|---|---|---|---|
| Raw-material price volatility | -1.20% | Global | Short term (≤ 2 years) |
| Cyber-hardening costs for connected boards | -0.50% | North America, Europe | Medium term (2-4 years) |
| Standards fragmentation across export markets | -0.40% | Global | Long term (≥ 4 years) |
| Shortage of certified installers in APAC | -0.90% | India, ASEAN | Medium term (2-4 years) |
| Source: Mordor Intelligence | |||
Raw-Material (Cu, Al, Steel) Price Volatility
Copper topped USD 10,200/t in early 2025, up 22% versus 2023, while aluminum jumped 18% to USD 2,650/t, squeezing panel margins by several points. U.S. and EU steel tariffs layered an extra 8-12% onto enclosure costs, pushing manufacturers toward alternative mills in Turkey and India and extending lead times. Smaller vendors lacking hedging programs saw working-capital needs swell 20%, limiting their ability to pursue large tenders. Hybrid busbar materials and composite housings are now under evaluation to shave 10-15% off raw-material exposure while staying within IEC 61439 tolerances.
Acute Shortage of Certified Installers in Fast-Growing APAC
India’s licensed-electrician pool grew only 3% annually in 2023-2025, versus the 10% pace needed for solar and grid-upgrade programs. Delays of four to six months are common in Tier-2 cities, and wages for certified installers spiked 25-35% in 2025. Vietnam and Indonesia each graduate fewer than 5,000 certified electricians per year, one-third of the demand. Governments and OEMs are establishing fast-track academies; Thailand set up 15 regional centers with Siemens and Schneider to close the gap. Prefabricated panels that reduce on-site wiring by half allow newer crews to complete projects safely and rapidly.
*Our forecasts treat driver/restraint impacts as directional, not additive. The impact forecasts reflect baseline growth, mix effects, and variable interactions.
Segment Analysis
By Type: Final Boards Sprint Ahead on Last-Mile Electrification
Final boards are forecast to post a 9.1% CAGR, noticeably exceeding overall distribution board market growth as rooftop solar, EV charging, and smart-home circuits proliferate. Main boards kept a 43.8% distribution board market share in 2025 as the hub for substations and large-scale industrial plants. Sub-main boards occupy the middle tier, feeding specific building zones in modular offices and data-center halls. Prefabricated packages cut main and sub-main installation time by 40%, permitting contractors to align with hyperscale commissioning schedules.
California’s Title 24 code and Germany’s KfW 442 grant have pulled forward millions of residential panel upgrades, lifting final-board shipments in existing housing stock. OEMs now supply plug-and-play designs with factory-wired solar, battery, and arc-fault modules that reduce labor by up to 50%. Main boards still handle 1,600-6,300 A ratings in utilities and heavy industry, where IEC 61439 compliance is mandatory. Sub-main solutions gain share in multi-tenant offices and logistics parks by enabling zoned load management and 15-20% copper savings.


By Voltage Level: Low-Voltage Dominance Reflects Grid-Edge Proliferation
Low-voltage products captured 65.1% of the distribution board market size in 2025 and are on track for a 7.9% CAGR to 2031. The segment covers nearly all residential, commercial, and light-industrial installations below 1 kV, making it both the largest and the fastest bucket. Medium-voltage units sit in substations and factories, channeling power from the grid to transformers. High-voltage cabinets above 36 kV stay niche within transmission corridors and steel mills.
Rooftop solar interconnections and 350-kW DC chargers both land inside the low-voltage envelope, boosting panel count at the grid edge. India’s grid-modernization drive is stimulating medium-voltage demand by adding 420,000 intelligent terminals that link SCADA networks to field assets. High-voltage procurement remains tied to decades-long transmission projects, constraining growth to a 4-5% CAGR. IEC 61936 compliance inflates engineering spend by 10%, but utilities insist on it for safety and reliability.
By Technology: Smart Boards Surge as Predictive Maintenance Takes Hold
Smart or IoT-enabled models are projected to advance at a 10.5% CAGR through 2031 as utilities and manufacturers digitize maintenance workflows. Conventional assemblies still represented 72.5% of 2025 shipments because of entrenched procurement habits and lower ticket prices. Yet total cost-of-ownership modeling shows that predictive analytics cut unplanned downtime by 40-50%, making smart boards 15-20% cheaper over a decade.
Data-center operators already specified smart panels in 60% of new hyperscale builds during 2025 to safeguard 99.99% uptime. Schneider’s EcoStruxure and Siemens MindSphere ecosystems provide real-time harmonic and thermal alerts that surface breaker fatigue weeks in advance. Cybersecurity adds 10-15% to the bill of materials because IEC 62443 hardening requires extra processors and secure firmware images. Even so, utilities deem the spend mandatory given the spike in ransomware attacks on operational technology.
By Mounting Type: Floor-Standing Gains in Industrial and Data-Center Applications
Wall-mounted cabinets retained a 60.6% share in 2025, thanks to compact footprints and installation labor that runs 30% lower than floor-standing peers. Floor-standing units, however, are pacing at an 8.2% CAGR because data centers and heavy factories need 1,600-6,300 A ratings and hot-swappable breakers. Each hyperscale site installs 50-150 floor cabinets that feed server rows, cooling equipment, and backup generators.
Residential retrofits gravitate toward slim wall enclosures that arrive pre-wired for solar inverters and Level-2 chargers, shrinking install time from two days to mere hours. EV-depot projects also incorporate floor-standing gear where space allows, since 350-kW chargers drive amperage past wall-mounted limits. Prefabricated floor units cut job-site assembly by half, enabling contractors to hand over data-center halls up to eight weeks sooner.
By End-User: Residential Segment Accelerates on Solar and EV Mandates
Commercial buildings held 38.4% of 2025 revenue, covering offices, retail, and logistics nodes with dense, mission-critical loads. The residential slice is projected to grow at an 8.8% CAGR on the back of solar-ready and EV-ready code mandates in California, Germany, and Japan. Utilities remain consistent buyers, fitting boards with remote isolation and two-way power-flow features to integrate distributed generation.
California requires solar-ready panels in every new dwelling, and Germany’s KfW 442 pays homeowners to swap in solar-battery-wallbox packages, accelerating final-board churn. Data-center growth feeds the commercial pipe, with 1,200 MW added worldwide in 2025, and each site demanding up to 150 panels. Industrial players specify smart, floor-standing gear that registers harmonic distortion and voltage sags in real time, curbing costly outages by half.
Geography Analysis
Asia-Pacific anchored 44.7% of 2025 sales after China’s State Grid deployed 420,000 intelligent terminals and India earmarked USD 38 billion for system upgrades. Widespread rooftop-solar rollouts across ASEAN added 12 GW of new capacity, each system requiring a dedicated final panel. Japan and South Korea led smart-panel adoption by enforcing IEC 61850 integration in distribution assets. Labor shortages remain the chief headwind, pushing project timelines out by up to six months and inflating wages more than 30%.
The Middle East and Africa region is expected to clock a 9.4% CAGR through 2031 as Saudi Arabia’s NEOM and Red Sea construction zones embrace prefabricated electricity kits that slice installation labor in half. The UAE vaulted into the top tier of data-center destinations by adding 180 MW in 2025, translating to several thousand panel orders. Egypt targets 50,000 smart distribution assets by 2027 to curb outage frequency, while South Africa’s renewables program embeds bi-directional boards that manage rooftop exports. Varying certification schemes still complicate exports, extending engineering cycles by up to five months.
North America and Europe continue to mature yet absorb sizeable volumes. Northern Virginia alone integrated 320 MW of data-center capacity in 2025, forcing OEMs to pull inventory forward by nine months. The EU’s REPowerEU statute magnifies demand for grid-edge boards with bi-directional controls, while Germany’s KfW 442 incentivized 180,000 home solar-battery upgrades that each needed a new final panel. Utilities across both regions roll out AMI networks that dovetail with smart boards for real-time load shifting. South America, led by Brazil’s USD 4.2 billion grid-expansion plan, offers steady but smaller growth pulses.

Competitive Landscape
The top three suppliers, ABB, Siemens, and Schneider Electric, collectively commanded 35-40% of global revenue in 2025 by exploiting broad service networks and multiregional IEC 61439 portfolios. Regional champions such as Havells, CHINT, and Alfanar chip away at share with lead times that undercut multinationals by weeks and pricing 15-20% lower than global averages. Strategy vectors concentrate on embedded IoT analytics, prefabricated modules, and bundled energy-management software that helps clients trim demand charges.
Schneider’s EcoStruxure and Siemens MindSphere suites now flag breaker fatigue six weeks before failure, reducing outage costs for data-center operators. White-space opportunities surface in hybrid AC-DC architectures for solar-plus-storage microgrids and in IEC 62443-hardened gear that thwarts ransomware attacks on operational technology. Software-centric newcomers offer retrofit IoT dongles that transform conventional panels into connected assets at half the cost, already capturing 5-8% of the smart-panel addressable base.
Chinese manufacturers leverage scale to supply 1,600-6,300 A floor-standing cabinets at 20-25% price discounts versus Western peers, pressuring incumbents to automate factories and diversify supply chains. Patent filings tied to arc-fault detection and DC-distribution spiked 35% in 2024-2025, hinting at a technology race ahead. Prefabrication trims site work by up to 40%, so OEMs able to pair modular hardware with digital twins hold a clear advantage when bidding data-center or EV-depot packages.
Distribution Board Industry Leaders
Siemens AG
ABB Ltd.
Eaton Corporation PLC
Larsen & Toubro Limited
Schneider Electric SE
- *Disclaimer: Major Players sorted in no particular order

Recent Industry Developments
- May 2026: Schneider Electric India has announced the launch of new smart distribution board solutions as part of its Make-in-India initiative. These products offer advanced protection, a modular design, and digital monitoring capabilities, catering to the needs of commercial buildings, industrial facilities, and modern power distribution networks.
- October 2025: Eaton allocated USD 120 million for a Texas prefab-electrical facility to serve North American data-center and EV-depot sites.
- April 2025: Waaree Energies has launched the Waaree Radiance All-in-One Solar Kit to simplify residential rooftop solar installations in India. Aligned with the PM Surya Ghar Muft Bijli Yojana, the kit includes solar modules, an inverter, advanced distribution boards, lightning protection, an earthing kit, and cables, offering a complete solution to reduce reliance on multiple suppliers.
- March 2025: IPD has launched the Evolution Core Distribution Board Range, designed to meet AS/NZS 3000 and AS/NZS 61439 standards. Available in multiple configurations, it features a 160A ABB OT160 Main Switch, supports ABB RCBOs and MCBs, and offers 15 DIN modules.


Global Distribution Board Market Report Scope
The distribution board (DB) market involves the design, manufacturing, and supply of electrical distribution boards. These boards distribute electricity from a main source to multiple circuits in residential, commercial, industrial, and utility installations. They house protective devices like circuit breakers, fuses, residual current devices (RCDs), and surge protection devices, ensuring electrical safety, load management, and fault isolation.
The global distribution board market is segmented by type, voltage level, technology, mounting type, end-user, and geography. By type, the market is segmented into main distribution boards, sub-main distribution boards, and final distribution boards. By voltage level, the market is divided into low voltage, medium voltage, and high voltage. By technology, the market is segregated into conventional boards and smart/IoT-enabled boards. By mounting type, the market is divided into wall-mounted and floor/free-standing. By end-user, the market is segmented into utilities, industrial, commercial, and residential. The report also covers the market size and forecasts for the subsea systems market across major regions. Market sizing and forecasts have been done for each segment based on revenue (USD billion).
| Main Distribution Boards (MDB) |
| Sub-Main Distribution Boards (SMDB) |
| Final Distribution Boards (FDB) |
| Low Voltage (Up to 1 kV) |
| Medium Voltage (1 to 36 kV) |
| High Voltage (Above 36 kV) |
| Conventional Boards |
| Smart/IoT-enabled Boards |
| Wall-Mounted |
| Floor/Free-Standing |
| Utilities |
| Industrial |
| Commercial |
| Residential |
| North America | United States |
| Canada | |
| Mexico | |
| Europe | Germany |
| United Kingdom | |
| France | |
| Italy | |
| NORDIC Countries | |
| Russia | |
| Rest of Europe | |
| Asia-Pacific | China |
| India | |
| Japan | |
| South Korea | |
| ASEAN Countries | |
| Rest of Asia-Pacific | |
| South America | Brazil |
| Argentina | |
| Colombia | |
| Rest of South America | |
| Middle East and Africa | Saudi Arabia |
| United Arab Emirates | |
| South Africa | |
| Egypt | |
| Rest of Middle East and Africa |
| By Type | Main Distribution Boards (MDB) | |
| Sub-Main Distribution Boards (SMDB) | ||
| Final Distribution Boards (FDB) | ||
| By Voltage Level | Low Voltage (Up to 1 kV) | |
| Medium Voltage (1 to 36 kV) | ||
| High Voltage (Above 36 kV) | ||
| By Technology | Conventional Boards | |
| Smart/IoT-enabled Boards | ||
| By Mounting Type | Wall-Mounted | |
| Floor/Free-Standing | ||
| By End-User | Utilities | |
| Industrial | ||
| Commercial | ||
| Residential | ||
| By Geography | North America | United States |
| Canada | ||
| Mexico | ||
| Europe | Germany | |
| United Kingdom | ||
| France | ||
| Italy | ||
| NORDIC Countries | ||
| Russia | ||
| Rest of Europe | ||
| Asia-Pacific | China | |
| India | ||
| Japan | ||
| South Korea | ||
| ASEAN Countries | ||
| Rest of Asia-Pacific | ||
| South America | Brazil | |
| Argentina | ||
| Colombia | ||
| Rest of South America | ||
| Middle East and Africa | Saudi Arabia | |
| United Arab Emirates | ||
| South Africa | ||
| Egypt | ||
| Rest of Middle East and Africa | ||


Key Questions Answered in the Report
What is the current valuation of the distribution board market?
The distribution board market size was USD 5.81 billion in 2026 and is projected to climb to USD 8.34 billion by 2031.
Which segment is expanding the fastest?
Smart/IoT-enabled panels lead growth at a 10.5% CAGR through 2031.
Why are low-voltage boards so dominant?
Grid-edge uses such as rooftop solar, battery storage and EV charging all operate below 1 kV, keeping low-voltage units at 65.1% share.
Which region will record the highest future growth?
The Middle East and Africa region is forecast for a 9.4% CAGR owing to Saudi giga-projects and UAE data-center builds.
How are raw-material prices affecting manufacturers?
Copper, aluminum and steel volatility has squeezed gross margins by up to 5 percentage points, pushing vendors toward composite busbars.
Who are the leading companies?
ABB, Siemens and Schneider Electric together hold around 35-40% of global revenue, while Havells and CHINT gain traction in high-growth Asia.
Page last updated on:


