
Market Overview
| Study Period | 2021 - 2031 |
|---|---|
| Market Size (2026) | USD 21.24 Billion |
| Market Size (2031) | USD 31.40 Billion |
| Growth Rate (2026 - 2031) | 8.13 % |
| Fastest Growing Market | Asia Pacific |
| Largest Market | Europe |
| Market Concentration | Medium |
Major Players *Disclaimer: Major Players sorted in no particular order Image © Mordor Intelligence. Reuse requires attribution under CC BY 4.0. | |
DC Distribution Network Market Analysis by Mordor Intelligence
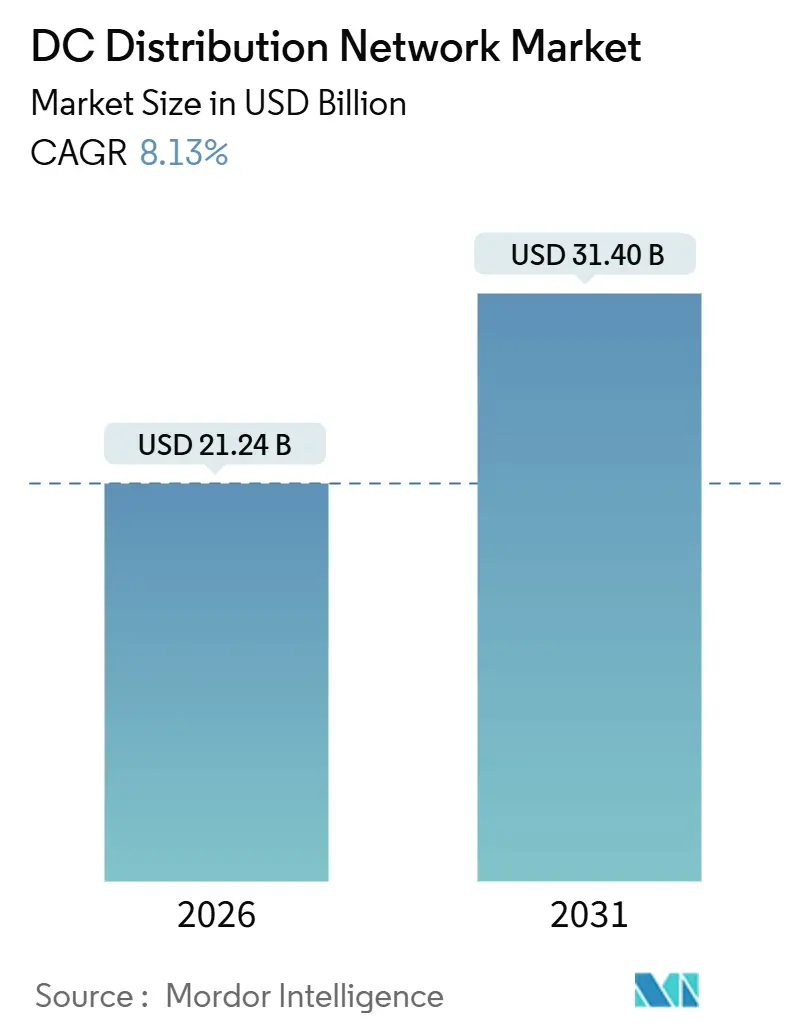
The DC Distribution Network Market size is estimated at USD 21.24 billion in 2026, and is expected to reach USD 31.40 billion by 2031, at a CAGR of 8.13% during the forecast period (2026-2031).
Cost pressures linked to energy prices, the conversion-loss penalty in legacy alternating-current systems, and the rapid rise of native DC loads, data centers, electric-vehicle fast chargers, solar arrays, and large battery banks are reinforcing a multi-year shift toward direct-current backbones.[1] International Electrotechnical Commission, “IEC 63290 Low-Voltage Direct Current Power Distribution,” iec.ch Hyperscale operators are standardizing on 380 V low-voltage DC (LVDC) buses to cut cooling overhead and reclaim floor space, while industrial plants employ medium-voltage DC (MVDC) links to bypass step-down transformers and trim copper weight by as much as 30%.[2]ABB Ltd., “ABB DC Distribution Portfolio Overview,” abb.com Publication of IEC 63290 in 2024 created a plug-and-play ecosystem for commercial buildings, greatly expanding adoption beyond telecom and military niches. At the same time, national energy-efficiency mandates in Europe and the United States, coupled with ultra-fast charging corridors for electric vehicles, are driving fresh capital toward direct-current infrastructure.
Key Report Takeaways
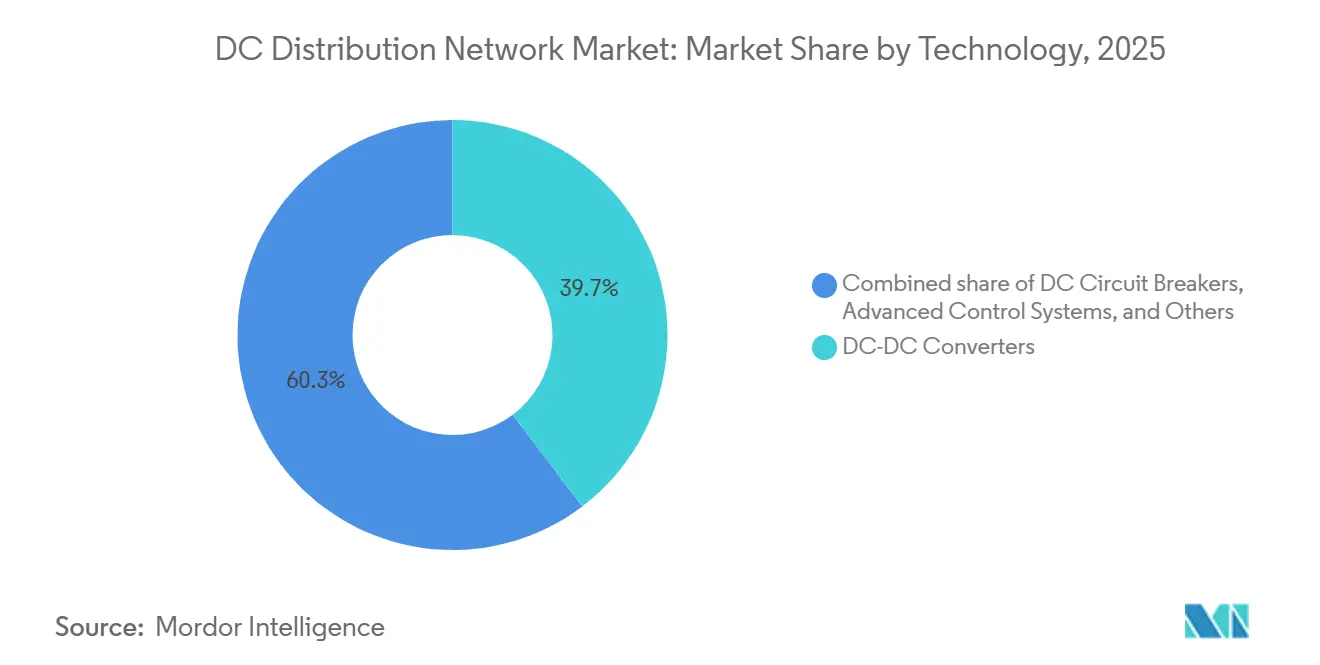
- By technology, DC-DC converters led with 39.7% of the DC Distribution Network market share in 2025, while the converters segment is projected to expand at an 8.6% CAGR through 2031.
- By voltage level, low-voltage systems accounted for a 49.2% share of the DC Distribution Network market size in 2025 and will grow at an 8.8% CAGR through 2031.
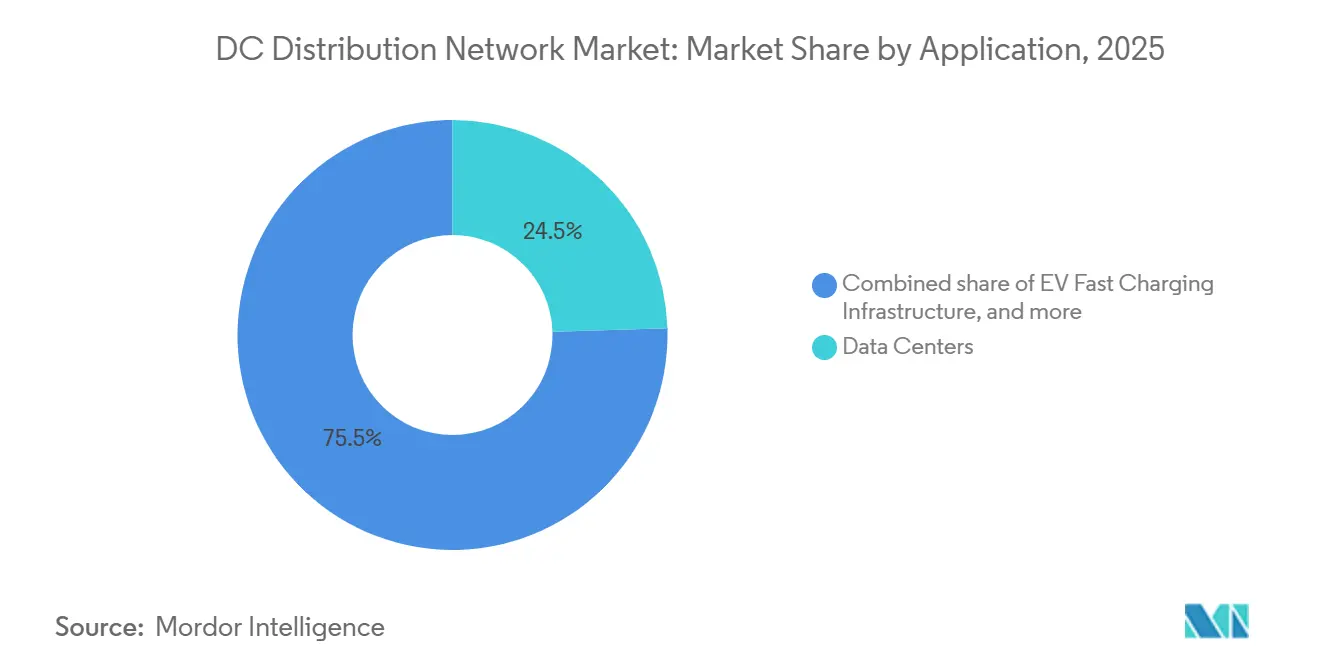
- By application, data centers held 24.5% revenue share in 2025, whereas EV fast-charging infrastructure is forecast to advance at a 13.5% CAGR through 2031.
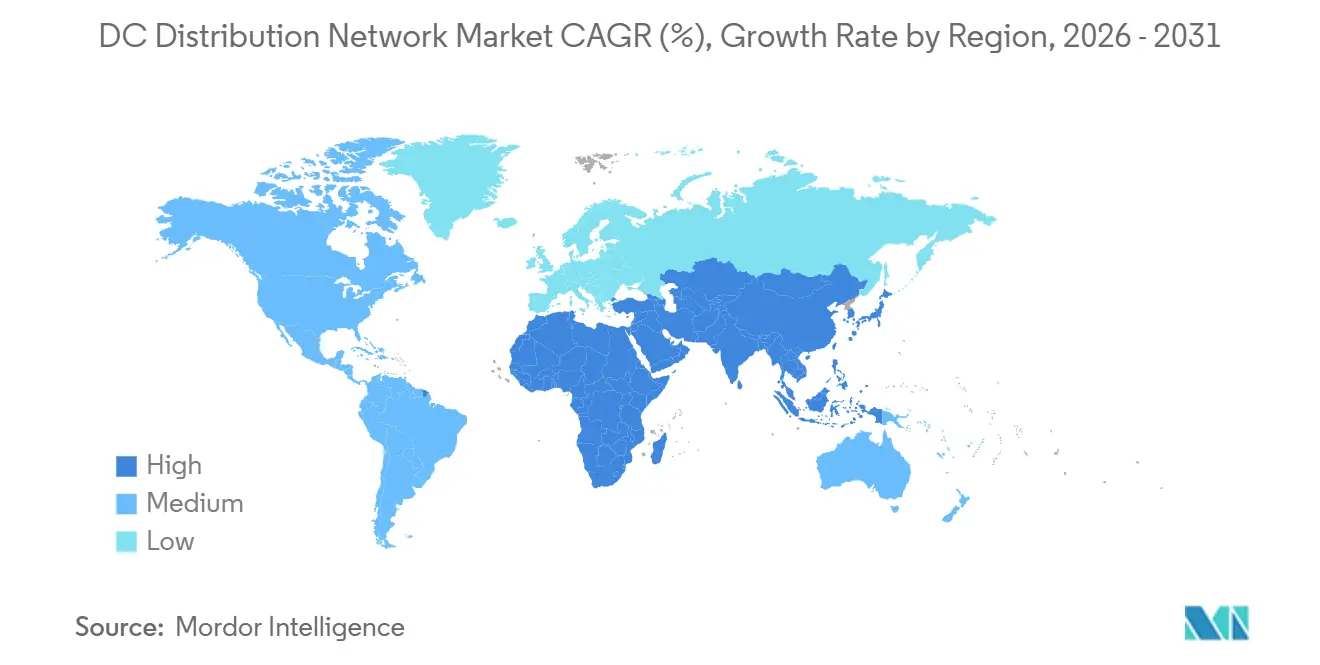
- By geography, Europe commanded 40.8% revenue share in 2025, while Asia-Pacific is expected to post the fastest regional CAGR at 9.6% through 2031.
Note: Market size and forecast figures in this report are generated using Mordor Intelligence’s proprietary estimation framework, updated with the latest available data and insights as of January 2026.
Market Trends and Insights
Drivers Impact Analysis of DC Distribution Network Market*
| Driver | (~) % Impact on CAGR Forecast | Geographic Relevance | Impact Timeline |
|---|---|---|---|
| Renewable-energy build-out accelerates LVDC and MVDC microgrids | +1.8% | Global with focus on Asia-Pacific and Europe | Medium term (2–4 years) |
| Hyperscale data-center surge adopts 380 V LVDC bus architectures | +2.1% | North America and Europe, expanding in Asia-Pacific | Short term (≤ 2 years) |
| Fast-charging corridors for EVs demand high-power DC backbones | +1.5% | North America, Europe, China | Medium term (2–4 years) |
| Energy-efficiency mandates cut AC/DC conversion losses | +1.2% | Europe, California, Japan | Long term (≥ 4 years) |
| 380 V DC standardization in commercial buildings (IEC 63290) | +0.9% | Germany, Netherlands, Singapore | Long term (≥ 4 years) |
| MVDC electrification of heavy industry drives copper and footprint savings | +0.6% | China, Germany, South Korea | Long term (≥ 4 years) |
| Source: Mordor Intelligence | |||


Renewable-Energy Build-Out Accelerates LVDC and MVDC Microgrids
Solar and wind installations are increasingly paired with batteries and DC feeders to eliminate inverter losses that can reach 12% in AC-coupled topologies. China added 217 GW of solar in 2024, much of it in remote provinces where MVDC microgrids bypass long AC lines and step-up transformers. India’s 2025 program to electrify 10,000 villages with LVDC microgrids combines rooftop solar, lithium-iron-phosphate batteries, and DC appliances, backed by USD 1.2 billion in funding. A 500 kW installation in Rajasthan delivered a 22% lower levelized cost of electricity than an AC equivalent by removing inverter stages and reducing copper cross-section. Island nations are following suit to integrate diesel, solar, and storage without synchronizing AC phases, a long-standing technical barrier for small grids. The net effect is accelerated uptake of DC Distribution Network market solutions across emerging economies.
Hyperscale Data-Center Surge Adopts 380 V LVDC Bus Architectures
Meta, Microsoft, and Google each operate multiple hyperscale facilities that are migrating to 380 V LVDC to reduce server-rack power loss and airflow requirements.[3]Microsoft Corporation, “Data-Center Sustainability Report 2025,” microsoft.com Lawrence Berkeley National Laboratory quantified a 15–20% reduction in distribution losses compared with 480 V AC, translating to USD 2 million in annual savings for a 20 MW site. Vertiv and Schneider Electric launched modular LVDC shelves integrating lithium-ion batteries directly on the bus, enabling sub-millisecond failover and trimming UPS footprint by 40%. Singapore’s data-center regulations now mandate a Power Usage Effectiveness below 1.3, a threshold more readily met with LVDC. Widespread replication of this architecture is reinforcing the DC Distribution Network market’s medium-term growth trajectory.
Fast-Charging Corridors for EVs Demand High-Power DC Backbones
Ultra-fast charging stations rated 350–500 kW require continuous direct-current feeders from the substation to the dispenser to avoid cascaded AC/DC conversions and voltage sag. Electrify America deployed 150 corridor sites in 2025, each with on-site solar canopies and 1 MWh batteries to shave peaks and sell grid services. Germany’s Autobahn network added 200 high-power charging hubs fed by 10 kV MVDC lines that cut cable gauge and trenching costs. China’s State Grid piloted 15 kV DC at 50 hubs, reducing copper use by 35% versus 10 kV AC. Economies of scale mean a six-stall 350 kW site fed by one MVDC spur costs 18% less than isolated AC feeds, strengthening the DC Distribution Network market outlook.
Energy-Efficiency Mandates Cut AC/DC Conversion Losses
The European Union’s 2024 Energy Performance of Buildings Directive compels large commercial buildings to chart a path to near-zero energy by 2030, favoring DC wiring where LED lighting and rooftop solar already run on direct current. California’s 2025 Title 24 update allocates compliance credits for tenant-level DC circuits, recognizing a 15% plug-load reduction when AC rectifiers are removed. Japan’s subsidy program covers 30% of DC retrofits in factories and warehouses, aiming for a 5% nationwide industrial energy cut by 2030. Early adopters in high-tariff regions log four-to-six-year paybacks, but economics remain shaky where electricity costs fall below USD 0.12 per kWh. As mandates proliferate, the DC Distribution Network market is positioned to capture a rising share of energy-savings capital.
Restraints Impact Analysis of DC Distribution Network Market*
| Restraint | (~) % Impact on CAGR Forecast | Geographic Relevance | Impact Timeline |
|---|---|---|---|
| Fragmented codes and standards for building-level DC wiring | -1.1% | Global, most acute in North America, South America, MEA | Medium term (2–4 years) |
| High upfront cost of DC-rated protection and switchgear | -0.9% | Emerging markets in APAC, South America, Africa | Short term (≤ 2 years) |
| Legacy AC asset lock-in among facility owners | -0.7% | North America, Europe, mature APAC | Long term (≥ 4 years) |
| Shortage of DC-skilled workforce in emerging MVDC projects | -0.5% | Global, acute in South America and MEA | Medium term (2–4 years) |
| Source: Mordor Intelligence | |||
Fragmented Codes and Standards for Building-Level DC Wiring
Architects must navigate a patchwork of jurisdictions where many rules fail to address voltages above 60 V DC, forcing project-by-project approvals that add six to twelve months to schedules.[4]National Fire Protection Association, “NEC 2023 Handbook,” nfpa.org Brazil’s ABNT standards still omit IEC 63290, while South Africa references outdated clauses that predate modern LVDC topologies. Insurance underwriters in the United States assess premiums that are 15–20% higher for DC installations, citing uncertain arc-flash risk profiles. These gaps slow the flow of capital into the DC Distribution Network market, particularly for retrofit projects.
High Upfront Cost of DC-Rated Protection and Switchgear
Because DC currents lack natural zero crossings, circuit breakers require complex solid-state or hybrid interruption methods that raise costs by a factor of two to three relative to AC equivalents. A 1,000 A, 1,000 V DC breaker lists at USD 8,000–12,000, whereas an AC peer costs USD 3,000–4,000. MVDC bays can exceed USD 500,000, undermining paybacks in low-tariff regions. Import duties of up to 25% in India and Nigeria inflate total installed costs, dampening the DC Distribution Network market’s appeal.
*Our forecasts treat driver/restraint impacts as directional, not additive. The impact forecasts reflect baseline growth, mix effects, and variable interactions.
DC Distribution Network Market Segment Analysis
By Technology:
Converters Drive Integration EconomicsDC-DC converters captured 39.7% of 2025 revenue as the interface that harmonizes 600–800 V solar arrays, 400–750 V battery strings, and 380 V or 750 V distribution buses, ensuring bidirectional power flow and grid-services revenue streams. Silicon-carbide MOSFET designs pushed efficiency above 98% in 2025, trimming thermal losses and cooling loads. DC circuit breakers form the second-largest slice of the DC Distribution Network market, helped by sub-2 ms solid-state interruption launched in 2024. Advanced control software layers predictive maintenance and revenue optimization atop hardware, yielding up to 18% higher internal rates of return than unmanaged systems. Secondary devices, contactors, fuses, and meters round out a USD 1.5 billion niche that supplies specialty applications such as telecom shelters and defense outposts.
A brighter outlook emerges as gallium-nitride devices mature, opening a path toward 99% efficient megawatt-scale converters that could reshape the DC Distribution Network market over the long term. Vendors are also integrating digital twins that forecast equipment aging and schedule condition-based maintenance, a feature set valued by data-center operators facing 99.999% uptime requirements. Chinese suppliers bundle converters with lithium-iron-phosphate batteries at aggressive price points that undercut European offerings by 25%, accelerating penetration in Southeast Asia and the Middle East. Nonetheless, intellectual-property-heavy segments such as fault-current limiters remain dominated by European incumbents.


By Voltage Level:
Low-Voltage Dominance Reflects Data-Center and Building MomentumLow-voltage systems (up to 1 kV) commanded 49.2% of revenue in 2025, buoyed by data-center standardization on 380 V and rapid commercial-building uptake following IEC 63290’s release. Installers require only standard electrician certifications, cutting labor costs by up to 20% and compressing project timelines. Medium-voltage DC (1–15 kV) is the sector’s high-growth frontier, adopted for long feeder runs in industrial campuses and large-scale renewable plants. Hitachi Energy’s 12 kV link at an Australian lithium refinery connects a 20 MW solar farm and 30 MWh battery storage directly to electrolysis cells, eliminating intermediate conversion stages. High-voltage distribution (15–150 kV) remains experimental, limited to fewer than ten pilot sites, yet cable innovations by Prysmian and others foreshadow eventual expansion into offshore renewables.
Heading into the next planning cycle, many owners intend to future-proof campuses by installing MVDC conduit even when initial loads are LVDC, anticipating higher-power EV chargers and hydrogen electrolyzers. The dual-level approach should deepen revenues for cable makers and breaker suppliers alike, further diversifying the DC Distribution Network market.
By Application:
EV Charging Outpaces a Maturing Data-Center SegmentData centers retained 24.5% of 2025 revenue, but growth moderates as the initial wave of migrations nears saturation among hyperscale operators. By contrast, EV fast-charging infrastructure is projected to expand at a 13.5% CAGR through 2031 with corridor projects funded by the United States, European Union, and China. Telecom towers in India, Africa, and Southeast Asia leverage LVDC to integrate solar and batteries, displacing diesel gensets and cutting operating costs by up to 60%. University campuses and institutional buildings apply DC to LED lighting and HVAC drives, logging double-digit energy savings. Industrial parks, renewable-energy plants, transport hubs, and defense sites each represent 5–10% of turnover, anchored by sector-specific resilience and decarbonization targets.
Scale economics favor turnkey packages that co-locate charging dispensers, energy-management systems, and battery storage on a shared DC backbone, translating into larger order sizes for power-electronics vendors. In parallel, governments are tightening performance specifications, mandating 97% efficiency at rated load, a criterion likely to push late-generation silicon devices out of the DC Distribution Network market.
Geography Analysis
Europe DC Distribution Network Market
Europe’s 40.8% share in 2025 reflects coherent policy, readily available subsidies, and deep engineering expertise in power-electronics manufacturing. Germany’s Federal Ministry for Economic Affairs and Climate Action extended its DC microgrid subsidy to 2027 with EUR 200 million earmarked for commercial and industrial facilities. Nordic utilities employ MVDC links for offshore wind collection, reducing platform weight by 30% and lowering installation risk. France is retrofitting 50 government buildings with 380 V LVDC to secure 20% energy savings, and the United Kingdom’s grid operator plans MVDC interconnections to defer GBP 1 billion in conventional transmission upgrades. Policy synchrony under the Energy Performance of Buildings Directive shortens approval cycles, encouraging cross-border equipment procurement that enlarges the DC Distribution Network market.
APAC DC Distribution Network Market
Asia-Pacific is forecast to post a 9.6% CAGR as China scales MVDC industrial parks and India rolls out rural LVDC microgrids. China’s State Grid invested USD 3.2 billion in 2025 to develop direct-current feeders across industrial zones in Jiangsu and Guangdong, cementing domestic suppliers’ dominance. India’s Bureau of Energy Efficiency introduced a star-rating program for microgrids that ties fiscal incentives to performance, raising design standards and ensuring replicability. Japan and South Korea experiment with smart-city LVDC to support peer-to-peer energy trading, while Australia funds MVDC for remote mining, cutting diesel reliance by 40%. Regional uptake is amplified by aggressive price plays from Chinese converter and switchgear manufacturers that market integrated packages at 20-30% discounts to European imports.
The Americas and MEA DC Distribution Network Market
North America holds 22% of 2025 revenue but reveals uneven progress. Fifty new hyperscale data centers embraced LVDC, yet commercial-building projects stall under fragmented codes and cautious utilities. California’s Self-Generation Incentive Program allocates USD 200 million for DC microgrids in critical facilities, while Canada backs LVDC in remote Indigenous communities to displace diesel generation. Mexico pilots MVDC in automotive corridors but faces regulatory uncertainty that clouds private investment. South America and the Middle East & Africa represent smaller but rising contributors; Brazil approved its first MVDC microgrid in 2024, and the United Arab Emirates extended its 380 V LVDC backbone in Masdar City to 500 buildings. Together, these trends signal steady, albeit regionally variable, expansion for the DC Distribution Network market.

Regulatory Landscape
Standards and grid-code activity is tightening around DC distribution in buildings, data centers, and microgrids, which reduces the need for case-by-case engineering justifications. On standards, IEC 63290 (published in 2024) provides a foundation for low-voltage DC power distribution in commercial buildings, while IEEE issued IEEE 2984-2025 (published November 2025) to guide protection topology in DC distribution grids. For data centers, CENELEC is advancing prEN 50600-2-2:2026, a draft covering power supply and distribution within data center facilities, which supports harmonization as operators move toward higher-voltage DC architectures.
Interconnection and resilience rules are also evolving. In the European Union, ACER issued recommendations in 2024 and 2025 to amend network code treatment for HVDC and DC regulation elements, signaling continued alignment work for DC connections across member states. In the United States, state-level activity includes the District of Columbia Public Service Commission establishing Chapter 48 (15 DCMR) to define microgrid requirements, while New Mexico introduced SB 235 in 2026 (Microgrid Oversight Act), which includes a Microgrid Renewable Portfolio Standard framework. At the federal level, FERC issued Order No. 919 in March 2026, approving updated Critical Infrastructure Protection reliability standards that include definitions linked to virtualized power systems and shape compliance expectations for modern, software-defined power infrastructure.
Competitive Landscape
The DC Distribution Network industry remains moderately concentrated, with the top five suppliers (ABB, Siemens, Schneider Electric, Vertiv, and Eaton) holding roughly 45% of 2025 revenue. ABB emphasizes MVDC, having filed 12 patents in 2024-2025 that target modular solid-state breakers and fault-current limiters to slash protection costs by 20%. Siemens positions itself for commercial-building LVDC, collaborating with German and Singaporean developers to embed IEC 63290-ready wiring in new projects. Schneider Electric’s 2024 acquisition of a French converter start-up adds bidirectional capability aimed at monetizing grid services.
Vertiv leverages Open Compute Project membership to co-design 380 V reference platforms now standard across Meta and Microsoft deployments, securing multi-year framework agreements. Eaton differentiates through software; its 2025 energy-management suite uses machine learning to optimize battery dispatch, reducing demand charges by up to 15%. Chinese challengers, Huawei, Chint, and Sungrow, undercut Western pricing by 25–30% while bundling converters, batteries, and cloud analytics, swiftly gaining share across Asia-Pacific and the Middle East.
Standards-setting participation augments competitive advantage; ABB and Siemens chair multiple IEC working groups, shaping protection requirements that dovetail with their product roadmaps. Workforce scale also matters: ABB runs 15 MVDC training centers worldwide, a network that accelerates commissioning and reduces perceived risk among industrial customers. Niche players such as Nextek Power Systems and Alpha Technologies focus on telecom and defense, where ruggedization justifies premium pricing despite small volumes. The landscape is expected to consolidate as standards mature, economies of scale grow, and customers favor vertically integrated suppliers, reinforcing mid-term growth prospects for the DC Distribution Network market.
DC Distribution Network Industry Leaders
ABB Ltd
Siemens AG
Vertiv Group Corp.
Eaton Corporation PLC
Schneider Electric SE
- *Disclaimer: Major Players sorted in no particular order

DC Distribution Network Market Companies Covered in this Report
- ABB Ltd.
- Siemens AG
- Schneider Electric SE
- Vertiv Group Corp.
- Eaton Corporation plc
- Hitachi Energy Ltd.
- General Electric Co.
- Mitsubishi Electric Corp.
- Prysmian Group
- Delta Electronics, Inc.
- Nextek Power Systems, Inc.
- Alpha Technologies Ltd.
- Secheron SA
- TE Connectivity Ltd.
- Johnson Controls International plc
- Huawei Technologies Co.
- Legrand SA
- Chint Group
- Littelfuse, Inc.
- Socomec Group

Market Opportunities and Future Outlook
Near-term whitespace centers on replicable DC microgrid and facility-level DC backbone deployments that pair on-site generation, storage, and DC-native protection, particularly where power quality, resilience, and conversion-loss reduction translate into measurable operating benefits. Industrial and manufacturing sites offer a practical entry point since they can manage load profiles and standardize internal architectures: in May 2026, Siemens brought its Wendell, North Carolina manufacturing microgrid to full operational status (1.25 MW solar and 3.9 MWh battery). In May 2026, Delta Electronics Americas commissioned a Detroit facility microgrid (425 kW solar and 2.8 MWh storage) synchronized to a 13.2 kV medium-voltage utility grid, reinforcing demand for DC-DC conversion, DC protection, and controls that support grid-tied microgrid modes. In July 2026, LS Electric inaugurated a fully DC-powered manufacturing facility at its Cheonan plant using solid-state transformers, solid-state circuit breakers, and energy storage, pointing to a broader equipment stack around DC-native switching and protection where incumbent AC product portfolios leave gaps.
Data centers and EV fast-charging remain high-value adoption channels, with opportunities tied to higher-voltage DC distribution, modularization, and standardization efforts that reduce project risk. A concrete reference point is the commissioning of Hong Kong's first LVDC microgrid at Ocean Park in August 2025, which increased cable transmission capacity to 700 kVA and shows how LVDC can unlock additional capacity where space and cabling constraints bind. At the same time, ongoing standards activity (including IEC and CENELEC initiatives such as prEN 50600-2-2:2026 and workstreams on decentralized DC distribution technical specifications) supports packaging of compliant, reference-architecture-based solutions for 380 V and emerging 800-1,000 V DC buses, particularly for hyperscale and AI-driven facilities where time-to-build and electrical efficiency are procurement criteria.
Recent Industry Developments in DC Distribution Network Market
- June 2026: Siemens announced an NVIDIA DSX Vera Rubin-aligned reference architecture for AI data centers that includes electrical design parameters for next-generation facilities. The move supports standardized, higher-power DC-capable distribution designs and speeds up specification-driven procurement for switchgear, protection, and power conversion.
- October 2025: ABB announced a collaboration with NVIDIA to develop power solutions for next-generation AI data centers, highlighting 800 VDC architectures aimed at scaling to gigawatt-class sites. The partnership reinforces momentum toward higher-voltage DC backbones and influences component roadmaps for breakers, converters, and busway systems used across large data center campuses.
- December 2024: Schneider Electric introduced the Galaxy VXL UPS and new AI-ready data center reference designs to address power and sustainability constraints in high-density computing environments. The release supports modular, high-efficiency power trains that can be paired with DC distribution approaches as operators rework electrical rooms and power chains for AI loads.


DC Distribution Network Market Report Scope and Research Methodology
Market Definition and Coverage
This market covers the revenue generated from DC distribution network equipment and integrated systems used to distribute and control direct current power within a defined voltage envelope across key end-use settings such as buildings, industry, telecom, and EV charging.
Scope exclusions: After-sales, replacement, repair, and service revenues are excluded so the market size reflects equipment and system sales only.
Segments Covered in This Report
- By Technology
- DC-DC Converters
- DC Circuit Breakers
- Advanced Control Systems
- Others
- By Voltage Level
- Low Voltage (Up to 1 kV)
- Medium Voltage (1 kV to 15 kV)
- High Voltage (15 kV to 150 kV)
- By Application
- Data Centers
- Telecom and Remote Cell Towers
- Commercial and Institutional Buildings
- Industrial Facilities
- EV Fast Charging Infrastructure
- Military and Defense
- Renewable Energy and Storage
- Transportation and Mobility
- Other Applications
- By Geography
- North America
- United States
- Canada
- Mexico
- Europe
- Germany
- United Kingdom
- France
- Italy
- Spain
- NORDIC Countries
- Russia
- Rest of Europe
- Asia-Pacific
- China
- India
- Japan
- South Korea
- ASEAN Countries
- Australia and New Zealand
- Rest of Asia-Pacific
- South America
- Brazil
- Argentina
- Colombia
- Rest of South America
- Middle East and Africa
- Saudi Arabia
- United Arab Emirates
- South Africa
- Egypt
- Rest of Middle East and Africa
- North America
Data Sources, Market Sizing, and Validation
Desk Research
Desk work started by mapping where DC distribution is being deployed, then linking that demand to measurable power and infrastructure indicators. Public sources, including the International Energy Agency for electricity and grid themes, the US Energy Information Administration for power statistics, and World Bank indicators for macro and investment signals, were used to keep assumptions tied to observable activity.
We also reviewed standards and technical guidance, such as IEC and IEEE publications, plus relevant national energy regulators and grid agencies, to keep voltage definitions and safety requirements consistent. Import and export trade statistics and tender notices were used as supporting signals for equipment movement and new project activity, and then company filings and investor presentations were checked for product mix, pricing commentary, and order momentum. In a few places, analysts used paid subscriptions for company financial intelligence, patent databases, and shipment-level trade views to cross-check selected parameters. These desk sources are illustrative, and many other public references were also used for data collection, validation, and clarification.
Primary Interviews and Surveys
Primary work was used to pressure-test what we saw in desk research, especially around typical system configurations, pricing behavior, and adoption speed by end use. Interviews were held with equipment manufacturers, integrators, EPC and project stakeholders, and large end users across major regions, so assumptions on voltage split, application share, and near-term project timing were grounded in what is being specified, purchased, and installed.
Distribution of primary research fieldwork respondents
| Company type | Respondent position | Region |
|---|---|---|
| Top tier: 29% | CXOs: 12% | APAC: 52% |
| Mid tier: 50% | Functional/Unit leaders: 33% | EMEA: 30% |
| Smaller Players: 21% | Managers: 55% | Americas: 18% |
Market-Sizing & Forecasting
The core model is built top-down by reconstructing the addressable demand pool using power and infrastructure build-out signals, then applying adoption and spend intensity assumptions for DC distribution within each major application. To keep the estimate practical, the model uses repeatable inputs, including new data center capacity additions and power density trends, EV fast charging rollouts, industrial electrification activity, renewable plus storage deployments, and typical voltage band choices across use cases.
Revenue is then estimated using sampled price ranges for key DC distribution equipment and system packages, which were refined through interviews and cross-checks against public pricing commentary and recent project patterns. Totals were corroborated with selective bottom-up approximations, such as rolling up a set of supplier revenues by relevant product lines and then adjusting for coverage gaps, channel mix, and regional exposure. Where supplier disclosure was limited, gaps were handled using proxy ratios, such as equipment share of project electrical spend, and then retested using primary inputs.
For forecasting, scenario analysis was used so slower or faster adoption paths could be expressed clearly. A light multivariate regression view was also run as a sanity check using the same demand indicators. Final growth assumptions were locked only after experts confirmed how quickly DC architectures are being specified and how protection and standards readiness are influencing rollout timing.
Data Validation & Update Cycle
Validation was done by triangulating model outputs against independent signals, including regional investment cycles, tender activity, and the pace of build-outs in data centers and charging infrastructure. If a region or application line showed an unexpected jump, it was flagged for a second review, and the underlying variables such as adoption rate, pricing, and timing were revisited before sign-off.
Before publication, the work goes through multi-step checks across the analyst team so major assumptions are consistent across applications and regions, and currency and year alignment is kept clean. The report is refreshed annually, and interim updates are triggered when material events occur, including major standards changes, policy shifts, or sharp capex swings. Immediately before delivery, an analyst rechecks that the latest public indicators are incorporated into the final view.
Mordor Intelligence's Global Dc Distribution Networks Market Market Estimate Compared With Other Published Estimates
Published market sizes for DC distribution networks often do not match, even when the topic appears identical, because each publisher makes different choices about which revenue lines count and which voltage and application limits are applied. Differences can also come from how pricing is updated, the assumed adoption pace in data centers and EV charging, and how frequently estimates are refreshed to reflect new project pipelines.
Some estimates fold in a wider bucket of adjacent power electronics and power supply revenues, which can raise totals even if DC distribution deployment is still uneven across end uses. In Mordor Intelligence, only DC distribution network equipment and integrated systems for installations up to 1500 Vdc are counted, and after-sales, replacement, repair, and service revenues are kept out to avoid mixing product sales with lifecycle services.
Benchmark comparison
| Source | Market Size | Gaps in Research Methodology |
|---|---|---|
| Mordor Intelligence | USD 21.24 B (2026) | |
| Global Consultancy A | USD 17.43 B (2025) | Uses a different base year and appears to include a broader component set (such as DC power sources and related control categories), which can shift the counted revenue beyond distribution networks and systems alone. |
| Industry Publisher B | USD 11.90 B (2026) | Reports a smaller 2026 figure that likely reflects narrower counting by application and a more conservative adoption curve for higher voltage DC deployments, which reduces the near-term demand pool. |
The spread across the three figures is mainly explained by what is counted as in-scope revenue, plus how quickly adoption is assumed in data centers, EV fast charging, and industrial uses. By keeping voltage limits explicit and excluding service revenues, the estimate stays traceable to clear demand indicators and can be reproduced and updated as new build-out data comes in.


Key Questions Answered in the Report
How large is the DC Distribution Network market in 2026?
The DC Distribution Network market size stands at USD 21.24 billion in 2026 and is projected to reach USD 31.40 billion by 2031.
Which segment will grow the fastest through 2031?
EV fast-charging infrastructure is set to expand at a 13.5% CAGR, outpacing data-center and telecom deployments.
Why are data centers moving to 380 V DC distribution?
Native DC server loads, lower cooling demand, and a 15-20% drop in power-distribution losses make 380 V architectures attractive for hyperscale operators.
What is the main barrier to DC adoption in commercial buildings?
Fragmented electrical codes and higher upfront costs for DC-rated protection devices extend approval timelines and increase capital outlays.
Which regions currently lead and which are catching up?
Europe leads with more than 40% revenue share, while Asia-Pacific is the fastest-growing region, registering a 9.6% CAGR to 2031.
How do DC breakers differ from AC breakers in cost and function?
DC breakers employ solid-state or hybrid mechanisms to extinguish arcs without current zero crossings, driving costs to two-to-three times those of AC equivalents but providing sub-2 ms interruption.
Page last updated on:





