Busbar Trunking Market Size and Share
Market Overview
| Study Period | 2021 - 2031 |
|---|---|
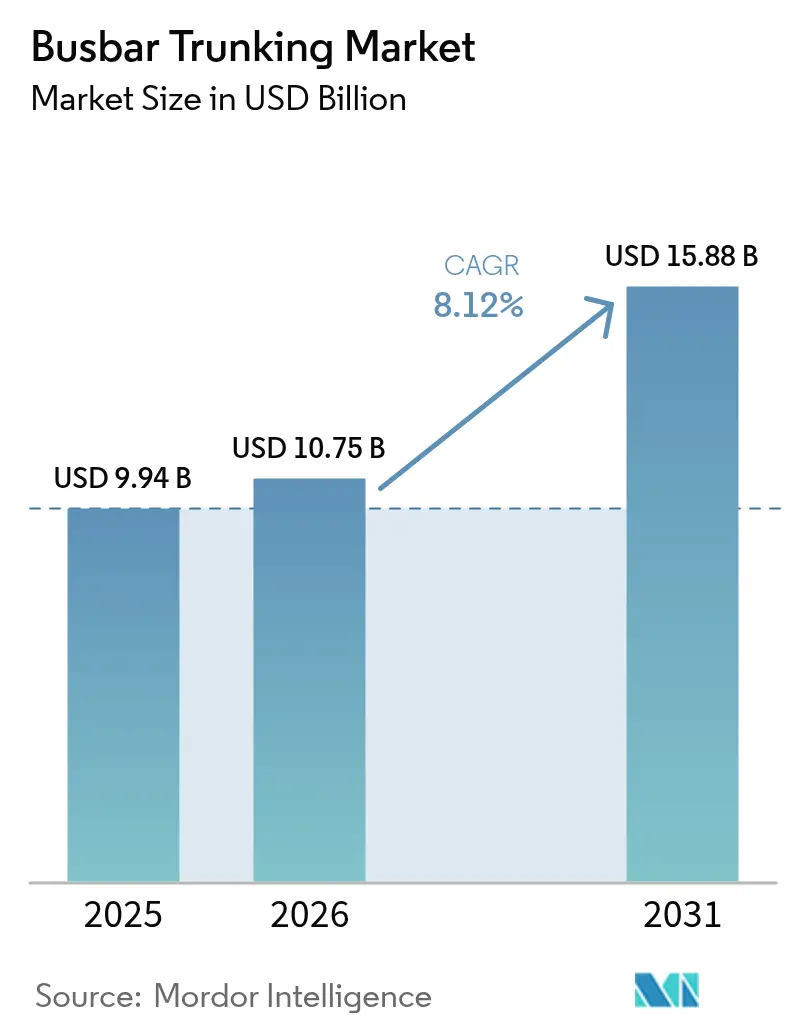
| Market Size (2026) | USD 10.75 Billion |
| Market Size (2031) | USD 15.88 Billion |
| Growth Rate (2026 - 2031) | 8.12% CAGR |
| Fastest Growing Market | Asia Pacific |
| Largest Market | Asia Pacific |
| Market Concentration | Medium |
Major Players *Disclaimer: Major Players sorted in no particular order Image © Mordor Intelligence. Reuse requires attribution under CC BY 4.0. | |
Busbar Trunking Market Analysis by Mordor Intelligence
Busbar Trunking market size in 2026 is estimated at USD 10.75 billion, growing from 2025 value of USD 9.94 billion with 2031 projections showing USD 15.88 billion, growing at 8.12% CAGR over 2026-2031.
Rapid progress in data-center construction, the modernization of industrial facilities, and widespread smart-building programs underpin this growth. Developers of hyperscale campuses now view busbars as a default option because the modular assemblies occupy less overhead space than bundled cables and shorten installation timelines. At the same time, industrial producers in sectors such as chemicals, metals, and advanced manufacturing rely on the technology to carry high-ampacity loads while maintaining power-quality parameters critical for automation. Demand also rises in utility and transportation projects that require compact, fire-tested products to handle harsh operating conditions. Finally, a wave of digitalization—IoT sensors, asset-health analytics, and power-quality monitoring—pushes suppliers to embed intelligence directly into the aluminum and copper bars, creating aftermarket service opportunities and new revenue streams.
Key Report Takeaways
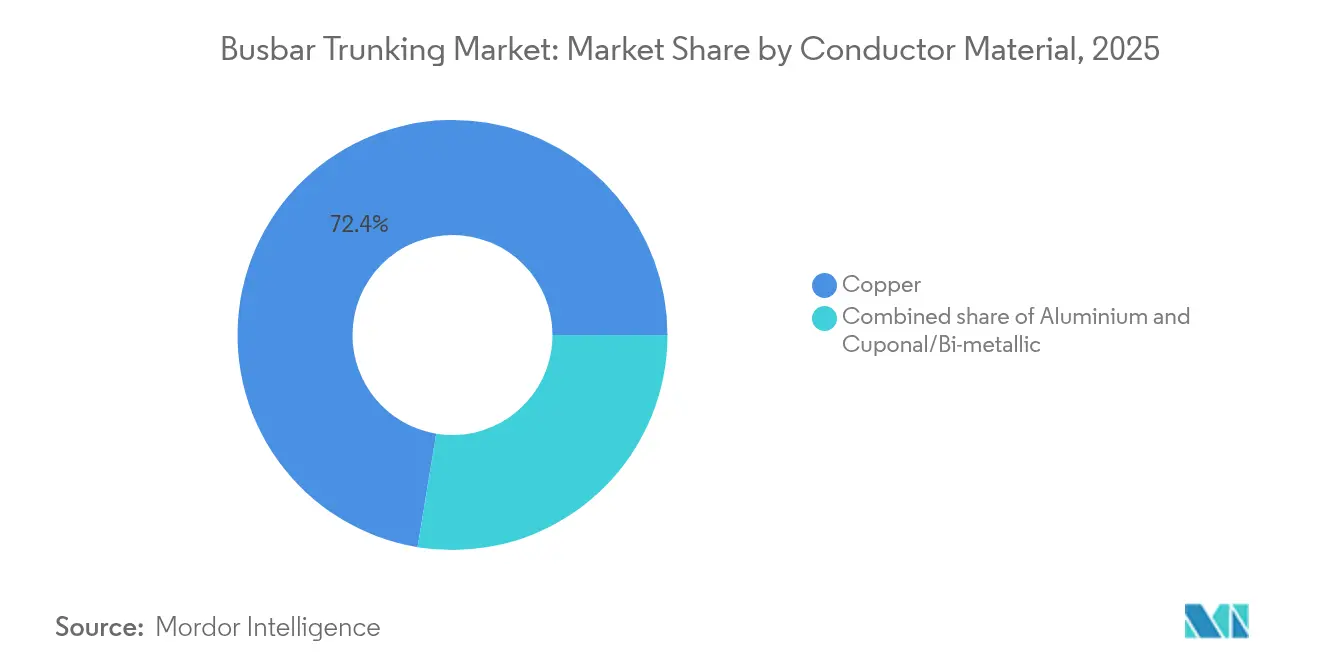
- By conductor material, copper led with 72.40% revenue share in 2025, while aluminum is projected to register the fastest 8.45% CAGR through 2031.
- By insulation type, sandwich assemblies commanded 67.35% of the 2025 base and are growing at an 8.25% CAGR to the end of the decade.
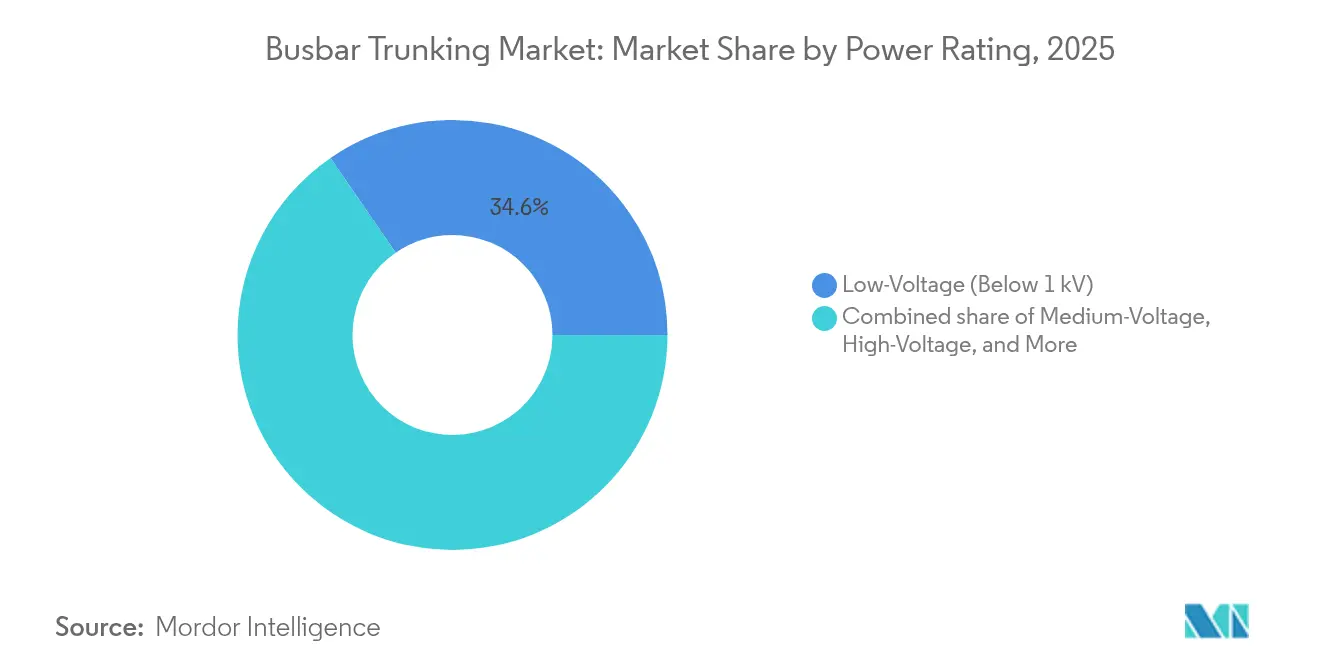
- By power rating, low-voltage configurations below 1 kV accounted for 34.60% of 2025 demand, whereas the high-voltage tier above 35 kV is expected to advance at a 9.05% CAGR.
- By end-user, industrial facilities retaineda 41.30% share in 2025, yet the commercial segment is forecast to expand at a 9.35% CAGR through 2031.
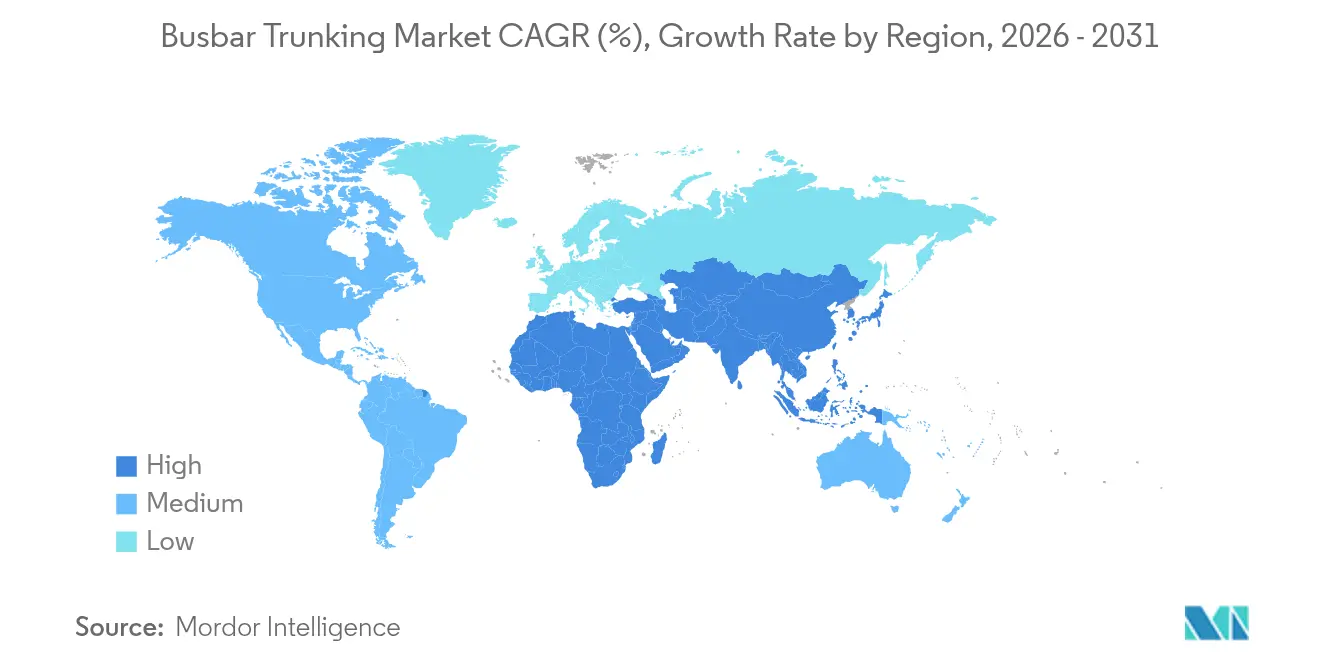
- By geography, Asia-Pacific captured 47.60% of global demand in 2025 and is set to record the quickest 8.35% CAGR through the forecast horizon.
Note: Market size and forecast figures in this report are generated using Mordor Intelligence’s proprietary estimation framework, updated with the latest available data and insights as of 2026.
Global Busbar Trunking Market Trends and Insights
Drivers Impact Analysis*
| Driver | (~) % Impact on CAGR Forecast | Geographic Relevance | Impact Timeline |
|---|---|---|---|
| Demand for reliable, space-efficient distribution in data-centres & commercial real-estate | 2.10% | Global, with concentration in North America & APAC | Medium term (2-4 years) |
| Smart-grid & renewables roll-out needing modular busbar links | 1.80% | Global, led by EU & APAC renewable mandates | Long term (≥ 4 years) |
| Industrial capacity surge across APAC manufacturing hubs | 1.50% | APAC core, spill-over to MEA | Short term (≤ 2 years) |
| High-ampacity EV fast-charging networks adoption | 1.20% | North America & EU, expanding to APAC | Medium term (2-4 years) |
| Prefab micro-grid kits for disaster-resilient power restoration | 0.80% | Global, with early adoption in disaster-prone regions | Long term (≥ 4 years) |
| Fire-retardant polymer casings lowering insurance premiums in high-rise projects | 0.60% | Global, concentrated in urban high-rise markets | Medium term (2-4 years) |
| Source: Mordor Intelligence | |||
Demand for Reliable, Space-Efficient Distribution in Data Centers and Commercial Real Estate
Hyperscale developers prefer busbar trunking systems because the assemblies deliver megawatt-scale power within reduced ceiling height, reserving valuable server rack space. A multi-year framework between Siemens and Compass Datacenters shows how integrated medium-voltage skids cut installation time by 60% and simplify expansion. Edge computing and AI workload growth increase power-density targets, which require conductors that manage thermal loads and allow future uprating. Operators also value the plug-and-play tap-off design that lets contractors add breakers without rewiring long runs. Digital meters embedded in tap-off boxes enable predictive maintenance and align with uptime service-level agreements. Together, these factors keep data-center builders at the forefront of busbar adoption, and their buying patterns shape global specification standards that later diffuse into broader commercial real-estate projects.
Smart-Grid Integration Drives Modular System Demand
National grid operators integrating large volumes of wind and solar generation are shifting from fixed cable harnesses to modular busbar links that support bidirectional energy flow. Busbars deliver lower impedance over long collector runs, which reduces thermal losses and improves overall renewable-plant efficiency. Utilities also favor the rigid design because it withstands short-circuit stresses linked to intermittent generation. As energy storage systems enter substations and community micro-grids, planners need distribution assemblies that can be re-configured quickly in line with evolving load patterns. IoT sensors fitted to modern busbar joints provide real-time temperature and current data, allowing operators to execute condition-based maintenance schedules. The result is a steadily widening installed base in greenfield and retrofit smart-grid projects.
Industrial Capacity Surge Across Asia-Pacific Manufacturing Hubs
Rising investment in semiconductor fabs, battery plants, and process industries across China, India, and Southeast Asia underpins short-term demand for high-ampacity distribution equipment. Government incentives designed to relocate supply chains encourage investors to expand production footprints and electrify processes. Manufacturers replace legacy conductors with busbar trunking to handle harmonic-rich loads produced by variable-speed drives and robotic welding cells. The rigid, enclosed bars mitigate electromagnetic interference that would disrupt sensitive automation systems. Siemens’ data-center competence center in Chennai, with more than 200 specialists, demonstrates supplier commitment to regional engineering support, further accelerating adoption.
High-Ampacity EV Fast-Charging Networks Adoption
Vehicle electrification programs now specify modular busbars in depots and public charging hubs to manage continuous currents above 1,500 A without unacceptable voltage drop. Developers of megawatt chargers for commercial trucks need aluminum or copper assemblies with enhanced thermal paths and integrated temperature sensors that prevent connector hotspots. Huber+Suhner is trialing liquid-cooled bar profiles that double current ratings for urban bus terminals. Eaton’s EV charging busway demonstrates how tap-off chargers can be added as fleet sizes grow, avoiding costly switchgear replacements. These engineering gains accelerate rollouts in Europe and North America and set a technology benchmark for projects that will scale in Asia-Pacific after 2026.
Restraints Impact Analysis*
| Restraint | (~) % Impact on CAGR Forecast | Geographic Relevance | Impact Timeline |
|---|---|---|---|
| Copper & aluminium price volatility | -1.40% | Global, with higher impact in cost-sensitive markets | Short term (≤ 2 years) |
| Cable-based retrofits competing in aged facilities | -0.90% | North America & EU legacy infrastructure | Medium term (2-4 years) |
| Thermal-runaway risks under harmonic-rich industrial loads | -0.70% | Industrial-heavy regions globally | Medium term (2-4 years) |
| Shortage of certified installers in emerging economies | -0.50% | APAC & MEA emerging markets | Long term (≥ 4 years) |
| Source: Mordor Intelligence | |||
Copper and Aluminum Price Volatility
Commodity cycles create budgeting uncertainty for contractors who may lock in busbar orders six months before delivery.[1]Bruker, “Cuponal Conductor Technology,” bruker.com Copper-clad aluminum (Cuponal) attempts to bridge the gap by lowering mass 60% and cutting conductor cost by 40%, yet many design engineers hesitate due to limited field history. Supply chain disruptions can push build schedules beyond peak price windows, causing contractors to renegotiate or defer projects. At the same time, spot spikes in aluminum force suppliers to raise surcharges that erode already thin margins in price-sensitive infrastructure tenders. Consequently, volatility deters large procurement decisions and lengthens approval cycles, trimming near-term growth.
Cable-Based Retrofits Competing in Aged Facilities
Factories built before 2000 often lack the clearance or structural reinforcement needed for modern sandwich bars, making cable tray replacement a cheaper option. Facility managers prefer improved tray and conductor insulation to full re-routing to busways, which might trigger lengthy shutdowns. Retrofit busbar layouts also demand custom offsets and joint kits that raise installation complexity and partially offset the labor savings that busbars usually deliver. Even when space is available, local codes may require changes to fire-compartment walls that exceed project budgets, steering owners back to traditional cables and reducing addressable market volume.
*Our forecasts treat driver/restraint impacts as directional, not additive. The impact forecasts reflect baseline growth, mix effects, and variable interactions.
Segment Analysis
By Conductor Material: Aluminum Gains Despite Copper Dominance
Copper captured 72.40% of the busbar trunking system market share 2025, reflecting legacy acceptance, high conductivity, and a well-established supplier base. Aluminum lines, however, are growing at an 8.45% CAGR as engineering teams place greater value on lower weight and reduced structural-support costs. Busbar trunking system market size contributions from aluminum are expected to double between 2025 and 2031 as global supply chains mature.
Weight savings translate into easier overhead handling, which lowers crane hire charges at construction sites and improves safety by reducing manual lifting. Thermal properties of advanced alloys meanwhile dissipate heat faster than comparable copper bars, which benefits solar-plant collector systems in hot climates. Hybrid Cuponal bars deliver copper-surface contact resistance with aluminum-core economics but require specialized roll-cladding equipment that only a few manufacturers possess. Continued R&D promises better compatibility between mixed-metal joints and standard terminations, supporting steady migration toward aluminum without fully displacing legacy copper inventories.


By Insulation Type: Compact Design Drives Sandwich Dominance
Sandwich-insulated assemblies accounted for 67.35% of 2025 revenue because their stacked conductor plates minimize overall cross-section and simplify routing through congested ceiling voids. Demand for space efficiency within data centers, hospitals, and modular office towers keeps this configuration ahead of air-insulated rivals. Busbar trunking system market size allocations to sandwich products will remain elevated through 2031 as premium real-estate values reward compact infrastructure.
Recent advances in halogen-free polymer casings achieve superior fire ratings that reduce insurance premiums for high-rise developers. Digital temperature sensors integrated inside sandwich housing deliver early warning of loose joints, enabling condition-based maintenance. Air-insulated lines still find favor in low-rise industrial plants where easy visual inspection trumps density, yet their growth lags due to a larger footprint. Suppliers respond with hybrid products that combine ventilated covers and localized sandwich sections to optimize cost and fire safety, widening the menu of choices for consulting engineers.
By Power Rating: High-Voltage Segment Accelerates
Low-voltage bars below 1 kV represented 34.60% of 2025 shipments because they form the backbone of building services distribution. At the same time, the high-voltage tier above 35 kV will outpace all others at a 9.05% CAGR as renewable farms, battery-storage hubs, and mass-transit projects call for longer runs and reduced resistive losses. Therefore, the busbar trunking system market size for high-voltage products will rise more steeply than for lower ratings.
Siemens’ SENTRON ECPD solid-state protection device demonstrates how Arc energy can be curtailed 1,000 times faster than conventional breakers, enhancing safety margins at higher voltages. Medium-voltage assemblies between 1-35 kV remain the largest opportunity because industrial automation lines and multi-tenant logistics parks are upgrading feeders to accommodate electric heating, cranes, and conveyor systems. DC-based data-center layouts introduce additional voltage classes, driving suppliers to extend catalogues while maintaining cross-compatibility among joints and tap-off boxes.
By End-User: Commercial Segment Outpaces Industrial Growth
Industrial plants retained 41.30% revenue contribution in 2025 due to entrenched busbar use in heavy machinery, refining, and assembly shops. Yet the commercial category—data centers, airports, shopping malls, and smart offices—is forecast to climb at a 9.35% CAGR, outstripping industrial growth as developers prioritize flexible power layouts. The shift will raise commercial stakeholders' busbar trunking system market share by 2031.
High-rise residential complexes form an adjacent opportunity because local fire codes are tightening. Projects such as Mumbai Metro Line 7 specify 25 kV AC traction feeds that leverage sandwich technology to control clearances within service tunnels. Combined commercial and industrial campuses adopt common busbar platforms to streamline spares and maintenance. Suppliers now bundle design services and digital twins to model load changes throughout building life cycles, ensuring commercial clients achieve targeted energy-efficiency ratings.
Geography Analysis
Asia-Pacific led the busbar trunking system market in 2025 with 47.60% of global revenue. Ambitious infrastructure corridors, factory expansions, and smart-city investments across China, India, and Southeast Asia continue to elevate regional demand. The region is also the fastest growing, posting an 8.35% CAGR to 2031 as national governments redirect stimulus toward grid resilience and EV charging rollouts. North America follows, buoyed by robust data-center pipelines in Virginia, Dallas, and Silicon Valley. Developers there demand custom busway skids that reduce deployment cycles from months to weeks. Europe holds a mature installed base, yet policy pressures to integrate renewable energy and improve building fire performance sustain moderate expansion. Renovation of aging cable infrastructure adds scope for retrofit busbar packages in office and mixed-use refurbishments. The Middle East and Africa remain smaller in absolute numbers but present double-digit growth pockets in Gulf smart-city programs and mining megaprojects. Latin America lags because macroeconomic volatility restrains capital expenditure, though utility-scale solar parks in Chile and Brazil create selective opportunities for high-voltage collector busways. Overall, the busbar trunking system market size gains are geographically diversified, with Asia-Pacific adding the largest incremental volume.

Competitive Landscape
The competitive field is moderately consolidated. Global brands—ABB, Schneider Electric, Siemens, and Legrand—leverage broad product portfolios, in-house digital platforms, and turnkey service networks to lock in framework agreements with multinational contractors. Mid-tier manufacturers such as nVent, Power Bus Way, and Niedax emphasize niche expertise and value-engineering to win specifications in regional data-center or industrial niches.
Strategic acquisitions shape growth paths. Legrand’s EUR 70 million purchase of Power Bus Way in 2024 gave it immediate traction in North America’s rapidly scaling data-center build-out. ABB created a joint venture with Niedax Group to combine busways and cable trays for holistic routing packages across commercial campuses. Siemens is augmenting hardware with software by integrating SIMOCODE M-CP motor control data into its cloud analytics, differentiating on predictive maintenance.
Margin management is increasingly tied to materials innovation and localized manufacturing. Powell Industries launched PowlSmart IoT modules that retrofit on existing bars, providing higher-value service revenues. Start-ups offering aluminum-conductor licensing models nibble at budget segments, putting pressure on copper-dominated incumbents. Commodity price swings test cost pass-through agility; those with hedging programs and dual-sourcing strategies protect share, while smaller firms risk earnings compression. Despite these pressures, top suppliers collectively control well above half of global shipments, leaving room for regional specialists but deterring large-scale fragmentation.
Busbar Trunking Industry Leaders
Schneider Electric SE
Siemens AG
ABB Ltd
Eaton Corporation plc
Legrand SA
- *Disclaimer: Major Players sorted in no particular order


Recent Industry Developments
- January 2025: Hitachi Energy pledged an additional USD 250 million to expand global transformer capacity, supporting higher busbar demand in power-dense applications.
- February 2025: Eaton invested USD 340 million in a South Carolina three-phase transformer plant to create 700 jobs and bolster downstream busbar installations.
- December 2024: Siemens signed a multi-year supply agreement with Compass Datacenters for modular medium-voltage skids integrating busbars, switchgear, and transformers.
- August 2024: Larsen & Toubro won major electrical packages for the Navi Mumbai Airport build, including high-capacity busbar trunking layouts.


Global Busbar Trunking Market Report Scope
Busbar Trunking System distributes electric power using copper or aluminum busbars with suitable enclosures and a good amount of protection to prevent the cables from getting damaged due to foreign bodies. The busbar trunking market is segmented by Material, Power Rating, End-User, and Geography. By Material, the market is segmented into Aluminum and Copper. By Power Rating, the market is segmented into Lighting, Low Voltage, Medium Voltage, and High Voltage. By End-user, the market is segmented into Commercial, Industrial, Transportation, and Residential. By Geography, the market is segmented into North America, Europe, Asia-Pacific, South America, and Middle-East, and Africa. For each segment, the market sizing and forecasts have been done based on revenue (USD Billion).
| Copper |
| Aluminium |
| Cuponal/Bi-metallic |
| Sandwich (Compact) |
| Air-Insulated |
| Lighting (Below 125 V) |
| Low-Voltage (125 V to 1 kV) |
| Medium-Voltage (1 to 35 kV) |
| High-Voltage (Above 35 kV) |
| Industrial (Process, Manufacturing, Mining, Oil & Gas) |
| Commercial (Offices, Retail, Datacentres, Hospitals) |
| Transportation (Airports, Rail & Metro, Marine) |
| Residential and Mixed-Use High-Rise |
| North America | United States |
| Canada | |
| Mexico | |
| Europe | Germany |
| United Kingdom | |
| France | |
| Italy | |
| Russia | |
| Rest of Europe | |
| Asia-Pacific | China |
| India | |
| Japan | |
| South Korea | |
| ASEAN Countries | |
| Rest of Asia-Pacific | |
| South America | Brazil |
| Argentina | |
| Rest of South America | |
| Middle East and Africa | Saudi Arabia |
| United Arab Emirates | |
| South Africa | |
| Egypt | |
| Rest of Middle East and Africa |
| By Conductor Material | Copper | |
| Aluminium | ||
| Cuponal/Bi-metallic | ||
| By Insulation Type | Sandwich (Compact) | |
| Air-Insulated | ||
| By Power Rating | Lighting (Below 125 V) | |
| Low-Voltage (125 V to 1 kV) | ||
| Medium-Voltage (1 to 35 kV) | ||
| High-Voltage (Above 35 kV) | ||
| By End-User | Industrial (Process, Manufacturing, Mining, Oil & Gas) | |
| Commercial (Offices, Retail, Datacentres, Hospitals) | ||
| Transportation (Airports, Rail & Metro, Marine) | ||
| Residential and Mixed-Use High-Rise | ||
| By Geography | North America | United States |
| Canada | ||
| Mexico | ||
| Europe | Germany | |
| United Kingdom | ||
| France | ||
| Italy | ||
| Russia | ||
| Rest of Europe | ||
| Asia-Pacific | China | |
| India | ||
| Japan | ||
| South Korea | ||
| ASEAN Countries | ||
| Rest of Asia-Pacific | ||
| South America | Brazil | |
| Argentina | ||
| Rest of South America | ||
| Middle East and Africa | Saudi Arabia | |
| United Arab Emirates | ||
| South Africa | ||
| Egypt | ||
| Rest of Middle East and Africa | ||


Key Questions Answered in the Report
What is the current value of the busbar trunking market?
The market is estimated at USD 10.75 billion in 2026, and is projected to reach USD 15.88 billion by 2031, implying a 8.12% CAGR.
What is driving the rapid growth of the busbar trunking system market?
Data-center expansion, grid modernization linked to renewable energy, and industrial automation projects are the three largest drivers, supporting an 8.12% CAGR through 2031.
Which region accounts for the highest demand?
Asia-Pacific leads with 47.60% of 2025 revenue and remains the fastest growing at an 8.35% CAGR to 2031 due to large infrastructure and manufacturing investments.
How do sandwich-insulated busbars differ from air-insulated products?
Sandwich designs stack conductors tightly, saving ceiling space and achieving higher fire ratings, which explains their 67.35% revenue share in 2025.
Why is aluminum gaining share against copper?
Aluminum’s 60% weight advantage and lower cost translate into easier handling and reduced structural support, pushing its segment to an 8.45% CAGR.
What challenges could slow adoption?
Commodity price swings, a shortage of certified installers in emerging markets, and retrofit complexity in older facilities act as the main restraints.
How concentrated is the competitive landscape?
A handful of global players hold roughly 60% of shipments, resulting in a market concentration score of 6 on a 10-point scale.
Page last updated on:


