Market Overview
| Study Period | 2021 - 2031 |
|---|---|
| Forecast Data Period | 2026 - 2031 |
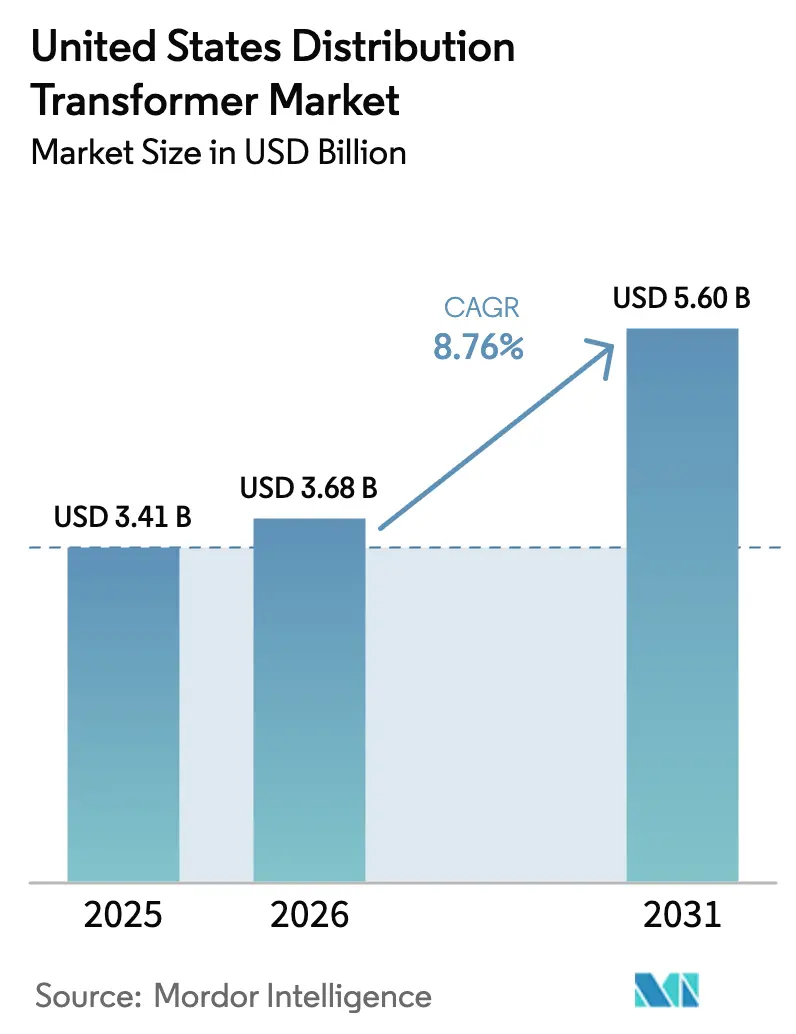
| Base Year Market Size (2025) | USD 3.41 Billion |
| Market Size (2026) | USD 3.68 Billion |
| Market Size (2031) | USD 5.60 Billion |
| Growth Rate (2026 - 2031) | 8.76% CAGR |
| Market Concentration | Medium |
Major Players *Disclaimer: Major Players sorted in no particular order Image © Mordor Intelligence. Reuse requires attribution under CC BY 4.0. | |
United States Distribution Transformer Market Analysis by Mordor Intelligence
The United States Distribution Transformer Market size is projected to expand from USD 3.41 billion in 2025 and USD 3.68 billion in 2026 to USD 5.60 billion by 2031, registering a CAGR of 8.76% between 2026 to 2031.
Federal grid-modernization appropriations and an unprecedented wave of electrification have moved replacement projects forward on utility capital plans, compressing typical procurement lead times. Simultaneously, hyperscale data-center operators and electric-vehicle charging networks are adding concentrated loads that require larger medium-voltage feeders and higher-rated pad-mounted units.[1]U.S. Energy Information Administration, “Electric Power Monthly,” eia.gov Manufacturers with domestic grain-oriented electrical steel capacity are therefore winning contracts as utilities seek to satisfy Buy America provisions while meeting 2027 Department of Energy efficiency thresholds.[2]U.S. Department of Energy, “Grid Resilience and Innovation Partnerships,” energy.gov Persistent volatility in copper and electrical-steel prices, however, continues to pressure transformer bills of material and is nudging utilities toward long-term supply agreements.
Key Report Takeaways
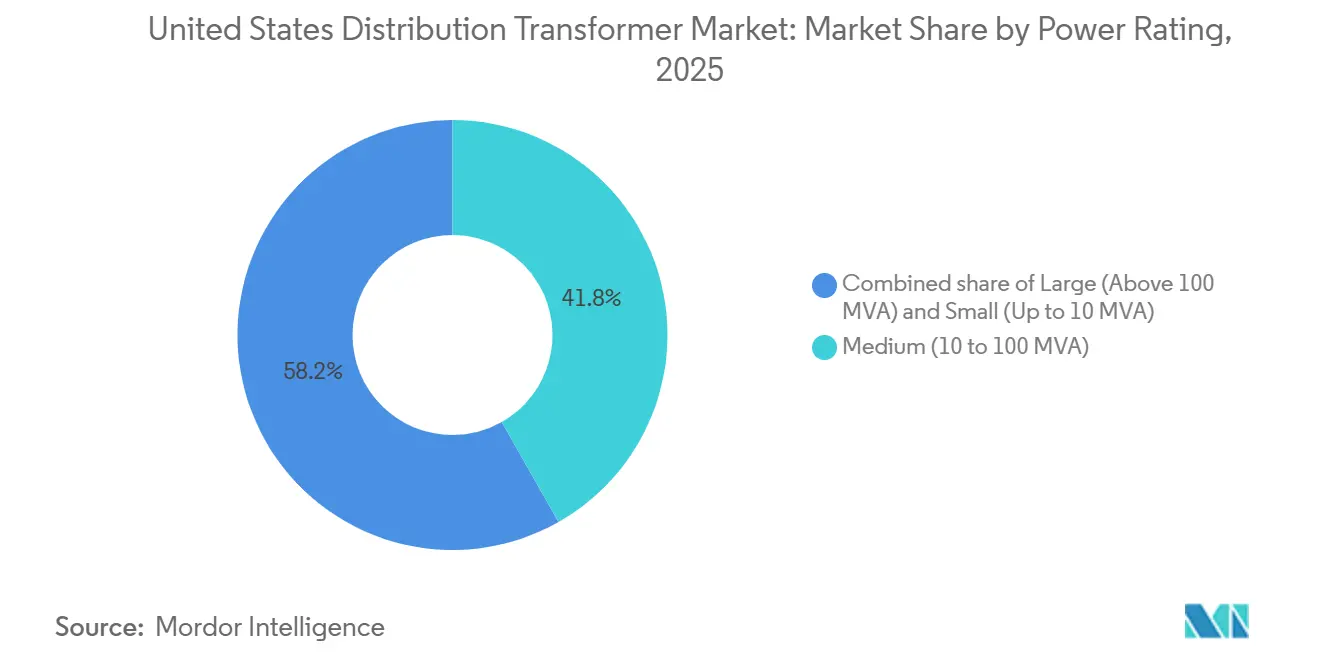
- By power rating, medium transformers captured 41.8% of the United States distribution transformer market share in 2025 and are projected to expand at a 9.6% CAGR through 2031.
- By cooling type, oil-cooled units held 80.9% of the United States distribution transformer market size in 2025, while air-cooled designs are the fastest growing at a 9.9% CAGR to 2031.
- By phase, single-phase transformers accounted for 60.4% share in 2025, whereas three-phase equipment is advancing at a 9.8% CAGR on the back of industrial reshoring.
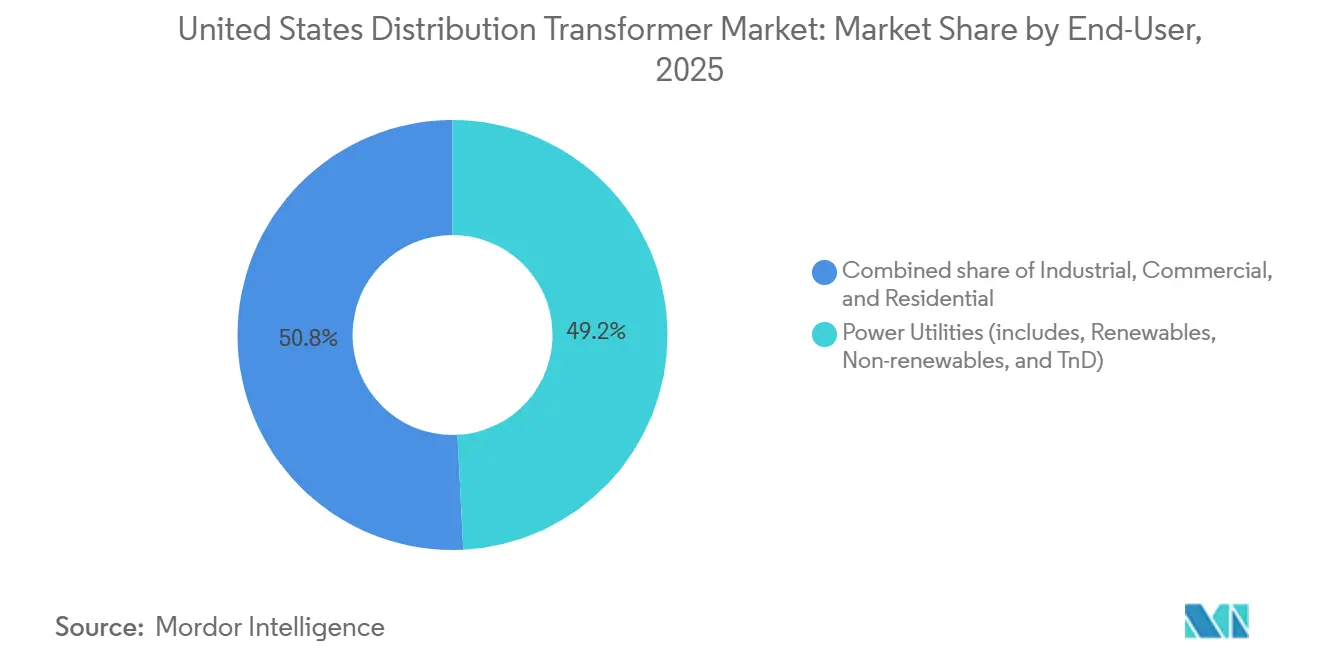
- By end-user, power utilities led with 49.2% revenue share in 2025, but the industrial segment records the highest projected 9.7% CAGR through 2031.
Note: Market size and forecast figures in this report are generated using Mordor Intelligence’s proprietary estimation framework, updated with the latest available data and insights as of 2026.
United States Distribution Transformer Market Trends and Insights
Drivers Impact Analysis*
| Driver | (~) % Impact on CAGR Forecast | Geographic Relevance | Impact Timeline |
|---|---|---|---|
| Rising electricity demand & electrification wave | +1.8% | National, concentrated in Sun Belt states | Medium term (2-4 years) |
| Grid-modernization funding under IIJA & DOE programs | +2.1% | National, with early allocations to Texas, California, Florida | Short term (≤ 2 years) |
| Renewable & DER integration creating bi-directional load flows | +1.5% | National, led by California, Texas, Northeast ISO regions | Long term (≥ 4 years) |
| Domestic sourcing rules spurring on-shoring of transformer manufacturing | +1.2% | National, manufacturing hubs in Mississippi, Tennessee, Missouri | Medium term (2-4 years) |
| Data-center cluster build-outs requiring medium-voltage distribution upgrades | +1.4% | Regional hotspots: Northern Virginia, Phoenix, Dallas-Fort Worth | Short term (≤ 2 years) |
| Federal & state EV-charging corridor mandates | +0.9% | National, prioritizing Interstate highway corridors | Medium term (2-4 years) |
| Source: Mordor Intelligence | |||


Rising Electricity Demand & Electrification Wave
Electricity consumption in the United States recorded four consecutive years of growth through 2026, with the Energy Information Administration projecting a 2% annual rise driven by data-center capacity additions, semiconductor fabrication, and space-heating electrification. Utilities are therefore ordering distribution transformers earlier than their historical replacement cadence and are favoring higher-rated units to defer future upgrades. Data-center developers now routinely request feeders capable of handling 20-50 MW, translating into multiple 34.5 kV, 20-40 MVA transformers per site. Industrial electrification, particularly heat-pump retrofits and electric-arc furnaces, is spurring demand for three-phase transformers that can tolerate high harmonic content. As a result, manufacturers must increase buffer inventory of cores and windings to service short-cycle industrial orders without delaying utility backlog. Elevated base-load growth is also stimulating interest in transformer monitoring to push assets beyond the traditional 30-year design life, creating cross-selling opportunities for digital services.[3]Hitachi Energy, “TXpert Transformer Monitoring Deployment,” hitachienergy.com
Grid-Modernization Funding Under IIJA & DOE Programs
The Infrastructure Investment and Jobs Act committed USD 10.5 billion to the Grid Resilience and Innovation Partnerships initiative, while an additional USD 2.5 billion flowed to state energy offices through formula grants. These appropriations shorten procurement calendars by 12-18 months because funded projects must reach mechanical completion by 2027. Embedded sensing and communications are now baseline specifications on GRIP-financed transformers, giving a competitive edge to suppliers with proven Internet-of-Things platforms. The DOE Transformer Rebate Program, though modest at USD 20 million, established a scoring system that elevates lifecycle efficiency over the lowest bid, further differentiating vendors with amorphous-core production capacity. Utilities tapping federal funds face schedule-liquidated damages if milestones slip, which incentivizes the purchase of domestically sourced units that can ship in 12-14 months rather than waiting 18-24 months for imports. Early grant recipients in Texas and California have already issued multi-year framework agreements that lock in both volume and pricing, providing order visibility to manufacturers through 2028.
Renewable & DER Integration Creating Bi-Directional Load Flows
Distributed energy resources surpassed 50 GW of installed capacity nationwide by 2025, altering voltage and fault-current behavior on radial feeders. California’s Rule 21, now copied in a dozen states, mandates tap changers and real-time monitoring for transformers serving high-penetration solar circuits.[4]California Public Utilities Commission, “Rule 21 Interconnection,” cpuc.ca.gov Utilities are thus replacing otherwise healthy units with models equipped for bidirectional flows and harmonic mitigation. This specification shift increases the average selling price by 8-12% versus legacy designs but unlocks predictive-maintenance revenue when combined with cloud-based analytics. OEMs that bundle hardware with software subscriptions are realizing gross-margin uplift and deeper customer lock-in. Furthermore, data generated at the transformer level feeds distribution-management systems that optimize voltage, reducing technical losses and helping utilities meet state energy-efficiency mandates.
Domestic Sourcing Rules Spurring On-Shoring of Transformer Manufacturing
The Build America, Buy America Act now requires that iron, steel, and manufactured products in federally funded grid projects be domestically produced. In response, Hitachi Energy, Eaton, and several regional specialists have announced capacity expansions totaling more than USD 200 million since 2024. The binding constraint remains grain-oriented electrical steel, where Cleveland-Cliffs and AK Steel supply roughly 80% of U.S. demand and have 52-week backlogs. Manufacturers with captive slitting and annealing lines now advertise a six-month delivery advantage over peers that depend on spot procurement. Utilities, wary of schedule risk, are awarding multi-year blanket contracts to plants located inside their service territories. The move toward domestic integration, while raising fixed costs, insulates OEMs from currency fluctuations and secures future compliance as Buy America waivers tighten.
Restraints Impact Analysis*
| Restraint | (~) % Impact on CAGR Forecast | Geographic Relevance | Impact Timeline |
|---|---|---|---|
| Distributed generation cannibalizing peak-load growth | -0.8% | California, Hawaii, Northeast states with high solar penetration | Long term (≥ 4 years) |
| Volatile copper & GOES prices inflating capex | -1.1% | National, affecting all utility procurement budgets | Short term (≤ 2 years) |
| Tight U.S. GOES supply chain extending transformer lead times | -0.7% | National, with acute impact on medium and large transformers | Medium term (2-4 years) |
| 2027 DOE efficiency rules raising compliance costs | -0.5% | National, affecting all new transformer sales | Short term (≤ 2 years) |
| Source: Mordor Intelligence | |||
Distributed Generation Cannibalizing Peak-Load Growth
California exceeded 1.5 million rooftop solar systems by 2025, trimming midday peak demand 8-12% in areas served by Pacific Gas & Electric. Utilities in high-solar states now re-optimize feeders rather than adding new capacity, directly reducing transformer purchases. Hawaii Electric cut its 2025-2030 procurement plan by 18% compared with its 2020 baseline after distributed PV and batteries met incremental load. This restraint is most acute for single-phase pole-top units whose replacement is tied primarily to capacity rather than age. Consequently, OEMs are pivoting toward retrofit kits, monitoring modules, and clamp-on voltage regulators that extend life and improve visibility without requiring full unit swaps.
Volatile Copper and GOES Prices Inflating Capex
Copper prices spiked 18% in early 2025, while GOES spot values jumped 22% year-over-year as electric-vehicle motor demand strained rolling mill supply. Because windings and cores represent up to half the cost of a distribution transformer, utilities faced immediate 8-10% increases in delivered prices. Duke Energy disclosed that commodity inflation added USD 120 million to its 2025 distribution capital budget, forcing a 7% reduction in planned transformer volumes. Larger utilities hedge futures contracts, but municipal and cooperative entities cannot, making them sensitive to spot volatility. Manufacturers now market aluminum-wound and amorphous-core options to dampen cost swings, though each alternative trades higher losses or larger footprints for lower material exposure.
*Our forecasts treat driver/restraint impacts as directional, not additive. The impact forecasts reflect baseline growth, mix effects, and variable interactions.
Segment Analysis
By Power Rating: Medium Units Anchor Capacity Upgrades
Medium transformers (10-100 MVA) commanded 41.8% of 2025 revenue and are forecast to grow at a 9.6% CAGR to 2031. This slice of the United States distribution transformer market size benefits from both substation modernization and industrial expansions requiring dedicated medium-voltage feeders. Large transformers above 100 MVA cater mainly to transmission projects, and their growth lags as utilities channel budgets toward distribution resilience instead of bulk-power corridors.
Utilities also favor trailer-mounted medium units that can be moved into wildfire or hurricane zones during emergencies, broadening the addressable United States distribution transformer market. Small transformers below 10 MVA remain the volume leader in units, but face margin compression as utilities standardize ratings to simplify inventory. The rising share of medium equipment, therefore, boosts dollar revenue faster than overall shipment counts.


By Cooling Type: Air-Cooled Designs Gain Urban Momentum
Oil-filled equipment held 80.9% market share in 2025, thanks to lower cost and superior heat dissipation. Yet air-cooled dry-type units are projected to expand at a 9.9% CAGR on stricter fire codes in dense urban zones and growing data-center adoption. Dry-type designs remove the risk of oil leaks, which eases permitting and insurance requirements for indoor substations. For utilities chasing Infrastructure Investment and Jobs Act deadlines, factory-assembled dry units also shorten civil works schedules.
Nevertheless, higher losses at full load and a footprint roughly one-third larger than oil-filled equivalents keep dry transformers from displacing their oil-cooled counterparts in space-constrained vaults or high-duty solar-collector circuits. As a result, oil-filled solutions will retain the majority of the United States distribution transformer market share over the forecast horizon, even as dry units carve out lucrative niches.
By Phase: Three-Phase Orders Accelerate on Reshoring
Single-phase transformers captured 60.4% share in 2025 because they populate almost every residential feeder. Three-phase equipment, however, is growing faster at a 9.8% CAGR as semiconductor fabs, battery plants, and commercial EV chargers demand balanced three-phase service. Major industrial projects announced under the Inflation Reduction Act collectively represent 18 GW of new load that will connect through 10-40 MVA three-phase units.
The United States distribution transformer market size for three-phase products, therefore, outpaces single-phase spending despite lower unit counts. Utilities also prefer three-phase pad-mounts at fleet-charging depots to avoid derating single-phase lines. OEMs that can tailor impedance and harmonic filtering for sensitive process equipment capture price premiums and negotiate service contracts that stretch revenue well beyond the initial sale.
By End-User: Industrial Buyers Lead Growth
Power utilities still accounted for 49.2% of 2025 shipments, yet industrial customers will post the fastest 9.7% CAGR through 2031. Chip fabrication, cathode-active-material plants, and electric-vehicle assembly now routinely procure dedicated medium-voltage transformers to avoid utility interconnection delays. United States distribution transformer market share for direct-purchase industrial sales is therefore rising even as utilities optimize replacement cycles.
Commercial property and data-center developers add another growth leg, with hyperscalers seeking indoor, dry-type designs that embed advanced monitoring. Residential demand remains tied to housing starts and shows greater cyclicality, making it a less reliable revenue pillar. For manufacturers, cultivating industrial and hyperscale accounts yields steadier order flow and higher margins than bidded utility tenders.
Geography Analysis
The United States distribution transformer market is national in scope, but regional dynamics differ sharply. The Sun Belt, Texas, Florida, Arizona, and North Carolina, accounts for an outsized share of new load because of population in-migration, large solar additions, and data-center campuses. Texas alone added 8 GW of solar in 2024-2025, requiring roughly 2,000 new transformers to connect projects to the ERCOT grid.
California remains the single-largest state market, driven by wildfire-hardening programs that bury distribution lines and replace pole-mount units with vault-mounted equivalents. Pacific Gas & Electric, Southern California Edison, and San Diego Gas & Electric together budgeted USD 1.8 billion for transformers between 2024 and 2028. Meanwhile, the Southeast leverages Buy America provisions to attract new manufacturing, which concentrates industrial transformer demand near Tennessee, Mississippi, and South Carolina.
The Midwest and Northeast show slower load growth but must swap aging fleets that average more than 35 years in service. Utilities in these regions, therefore, present steady replacement demand, often awarded in multi-year tenders that favor suppliers with nearby factories such as Howard Industries in Mississippi or Central Moloney in Missouri. Proximity reduces freight cost and enables expedited service, a competitive differentiator when outages risk regulator penalties.
Competitive Landscape
Market concentration is moderate: the top five suppliers, Hitachi Energy, Siemens Energy, Eaton, GE Vernova, and Schneider Electric, control roughly 45-50% of the installed base, while more than a dozen regional specialists share the balance. Global integrators leverage economies of scale in electrical-steel procurement and proprietary monitoring platforms but suffer longer lead times because of complex global supply chains. Regional manufacturers win urgent orders by turning medium-power units in 12-15 months, meeting utility schedules linked to federal-funding deadlines.
Technology differentiation now centers on embedded intelligence. Hitachi Energy’s TXpert monitors vibration and dissolved gases to forecast failures up to a year in advance. GE Vernova and Siemens Energy integrate cybersecurity protocols that satisfy revised IEEE C57.12.00 requirements. Utilities increasingly evaluate the total cost of ownership, combining purchase price with 30 years of no-load losses, which rewards suppliers offering high-efficiency amorphous-core designs.
Materials security is another axis of competition. GE Vernova’s five-year, 50,000-ton supply agreement with Cleveland-Cliffs guarantees electrical-steel availability, insulating it from spot-market spikes. Eaton’s acquisition of Royal Electric Company and Schneider Electric’s EcoStruxure analytics platform expand portfolios into fast-growing dry-type and digital-service adjacencies. Modular-transformer startups remain niche because utilities require lengthy qualification, yet their factory-built substations could disrupt incumbents once performance is field-proven.
United States Distribution Transformer Industry Leaders
Hitachi Energy (ABB)
Siemens Energy
Eaton Corporation
GE Vernova
Schneider Electric
- *Disclaimer: Major Players sorted in no particular order

Recent Industry Developments
- January 2026: Avangrid announced a USD 7 million purchase of five U.S.-manufactured transformers from WEG Transformers USA to support its multibillion-dollar grid-modernization plan. This investment bolsters domestic transformer supply, supports U.S. jobs, and addresses increasing distribution-grid demand.
- August 2025: Eaton acquired Resilient Power Systems, incorporating solid-state transformer technology to improve U.S. distribution-grid efficiency and support applications in data centers and EV charging. This acquisition enhances domestic innovation capabilities and modernizes distribution-level power-conversion equipment.
- April 2025: Hitachi Energy invested USD 22.5 million to expand U.S. dry-type distribution-transformer manufacturing by adding a 75,000 sq-ft facility in Atkins and upgrading its Bland plant. The expansion increases domestic capacity, creates 120 jobs, and meets growing demand from data centers, renewables, and grid-modernization initiatives.


United States Distribution Transformer Market Report Scope
Distribution transformers are devices that step down the voltage at substations to deliver electricity to customers. Distribution transformers provide the final voltage transformation in the electrical grid.
The distribution transformers market is segmented by power rating, cooling type, phase, and end-user. By power rating, the market is segmented into small, medium, and large. By cooling type, the market is segmented into air-cooled and oil-cooled. By phase, the market is segmented into single-phase and three-phase. By end-user, the market is divided into power utilities, industrial, commercial, and residential. The market sizing and forecasts have been done for each segment based on revenue (USD).
By Power Rating
| Large (Above 100 MVA) |
| Medium (10 to 100 MVA) |
| Small (Up to 10 MVA) |
By Cooling Type
| Air-cooled |
| Oil-cooled |
By Phase
| Single-Phase |
| Three-Phase |
By End-User
| Power Utilities (includes, Renewables, Non-renewables, and T&D) |
| Industrial |
| Commercial |
| Residential |
| By Power Rating | Large (Above 100 MVA) |
| Medium (10 to 100 MVA) | |
| Small (Up to 10 MVA) | |
| By Cooling Type | Air-cooled |
| Oil-cooled | |
| By Phase | Single-Phase |
| Three-Phase | |
| By End-User | Power Utilities (includes, Renewables, Non-renewables, and T&D) |
| Industrial | |
| Commercial | |
| Residential |


Key Questions Answered in the Report
What is the current value of United States Distribution Transformer Market?
Revenue stood at USD 3.68 billion in 2026 and is projected to rise to USD 5.60 billion by 2031, reflecting a 8.76% CAGR between 2026 and 2031.
Which rating category generates the most revenue?
Medium units rated 10-100 MVA dominate, holding 41.8% of 2025 revenue and expanding at a 9.6% CAGR through 2031.
Why are dry-type transformers gaining share?
Urban fire-safety codes and indoor data-center installations favor non-flammable designs, pushing air-cooled units to a 9.9% growth rate.
How do Buy America rules affect suppliers?
Domestic content mandates shift contracts toward plants in Missouri, Tennessee, and Mississippi, rewarding firms with U.S. steel supply chains.
What is the major cost headwind for utilities?
Volatile copper and grain-oriented electrical steel prices raised unit costs 8-10% in 2025, forcing some buyers to trim volumes or delay orders.
Which customer segment will grow fastest?
Industrial facilities semiconductor fabs, battery plants, and EV assembly will post a 9.7% CAGR as they procure dedicated medium-voltage feeders.
Page last updated on:


