Direct Air Capture Market Size and Share
Market Overview
| Study Period | 2020 - 2030 |
|---|---|
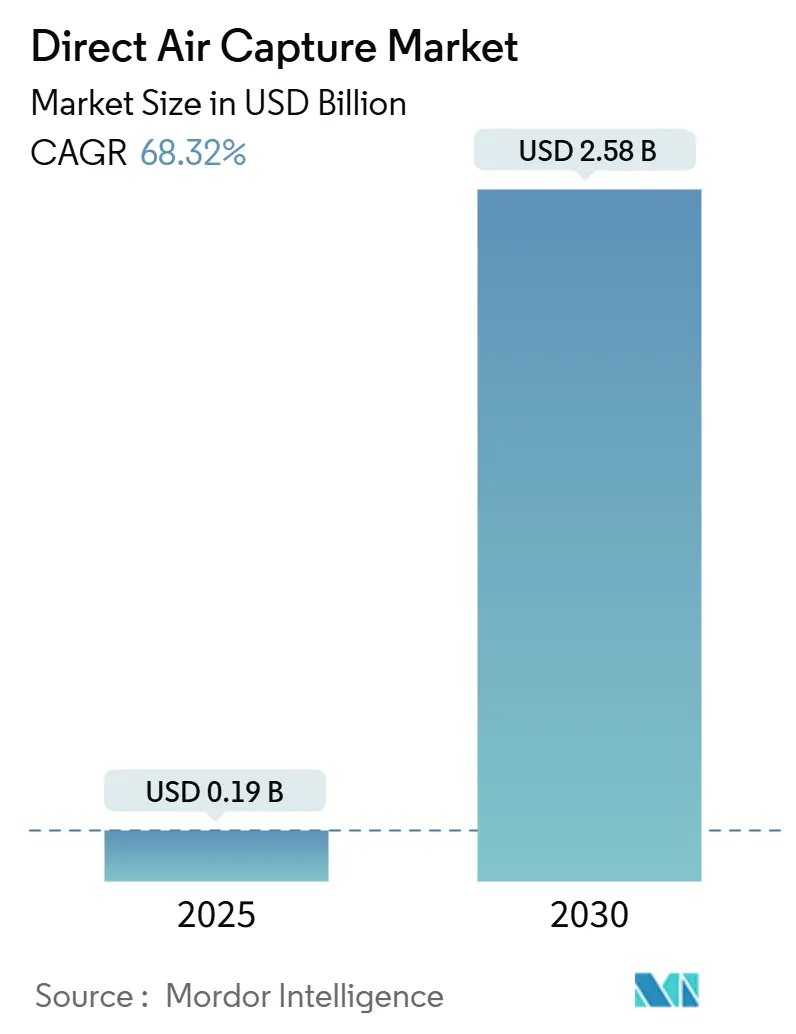
| Market Size (2025) | USD 0.19 Billion |
| Market Size (2030) | USD 2.58 Billion |
| Growth Rate (2025 - 2030) | 68.32% CAGR |
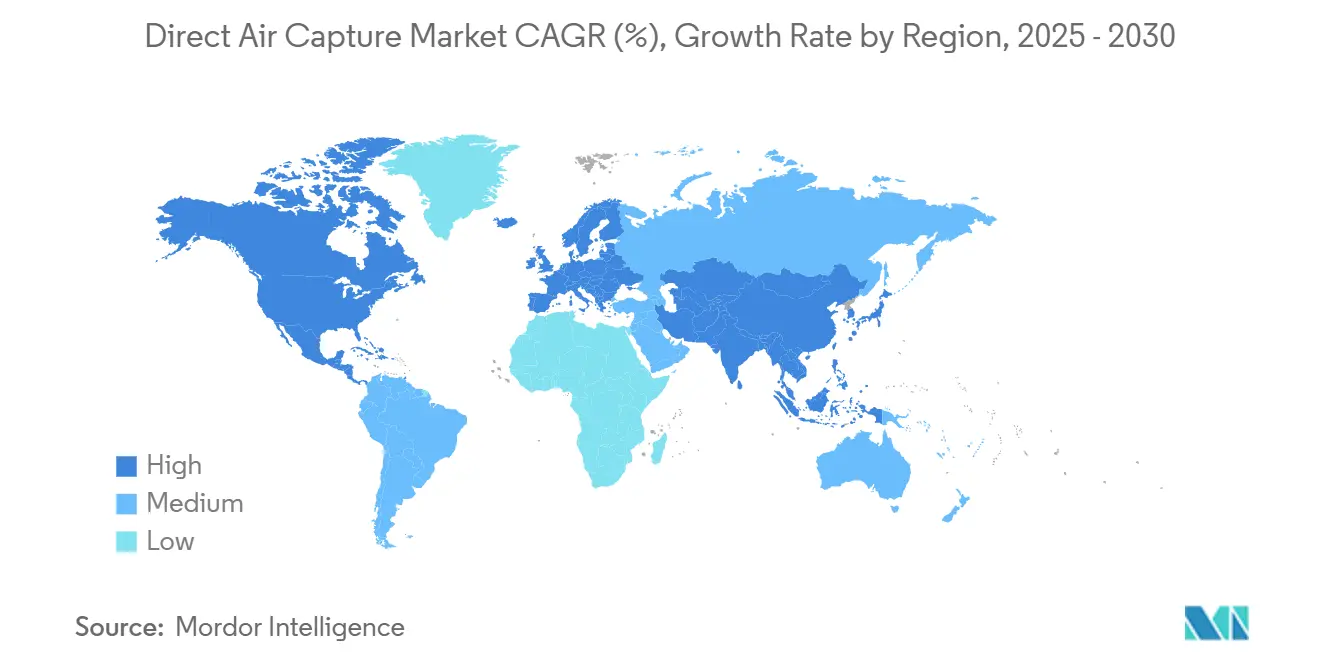
| Fastest Growing Market | Asia Pacific |
| Largest Market | North America |
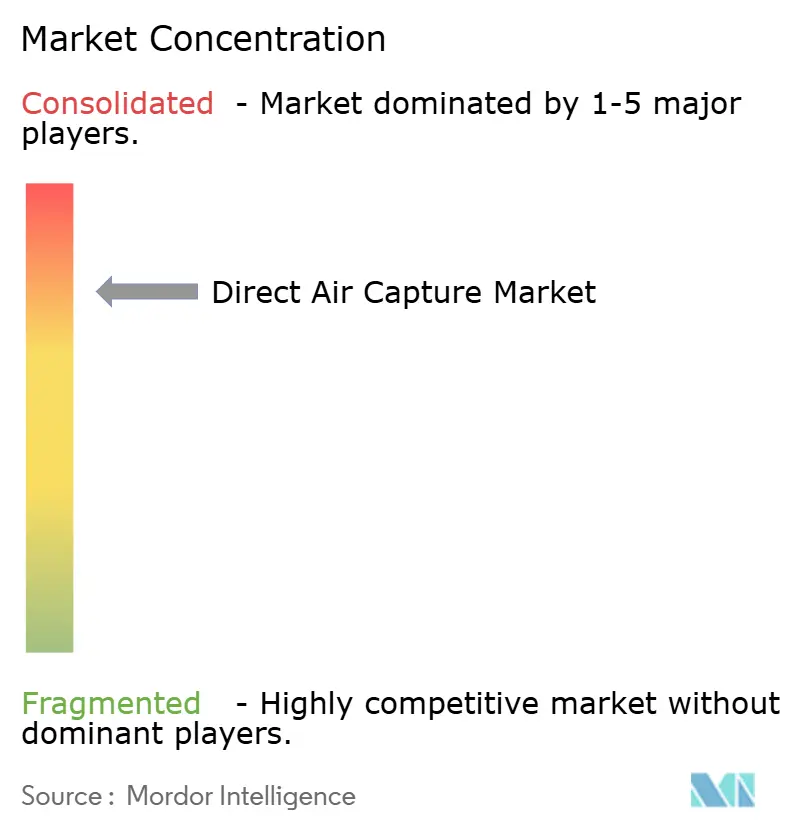
| Market Concentration | High |
Major Players *Disclaimer: Major Players sorted in no particular order Image © Mordor Intelligence. Reuse requires attribution under CC BY 4.0. | |
Direct Air Capture Market Analysis by Mordor Intelligence
The Direct Air Capture Market size is estimated at USD 0.19 billion in 2025, and is expected to reach USD 2.58 billion by 2030, at a CAGR of 68.32% during the forecast period (2025-2030).
Rapid policy support, growing corporate offtake demand, and material-science breakthroughs converge to compress technology learning curves and unlock cost trajectories that trend toward the sub-USD 200 per-ton threshold. North America retains an early-mover advantage through enhanced 45Q credits and mature storage networks, while APAC capitalizes on abundant renewable energy to narrow levelized removal costs. Solid sorbent systems dominate early deployments thanks to favorable energy profiles, yet electrochemical and membrane concepts gain momentum as semiconductor-grade manufacturing expertise enters the ecosystem. Project developers increasingly bundle capture, renewable power, and verified storage into bankable infrastructure packages that attract climate-focused capital pools.
Key Report Takeaways
- By technology, solid sorbents (S-DAC) led with 57.5% of the direct air capture market share in 2024, whereas the membrane‑based capture segment is forecast to expand at a 76.3% CAGR to 2030.
- By capture capacity, below 1 kt CO₂ yr (pilot) accounted for 48.3% of the direct air capture market size in 2024, whereas above 100 kt CO₂ yr (commercial-large) is expanding at a 74.5% CAGR.
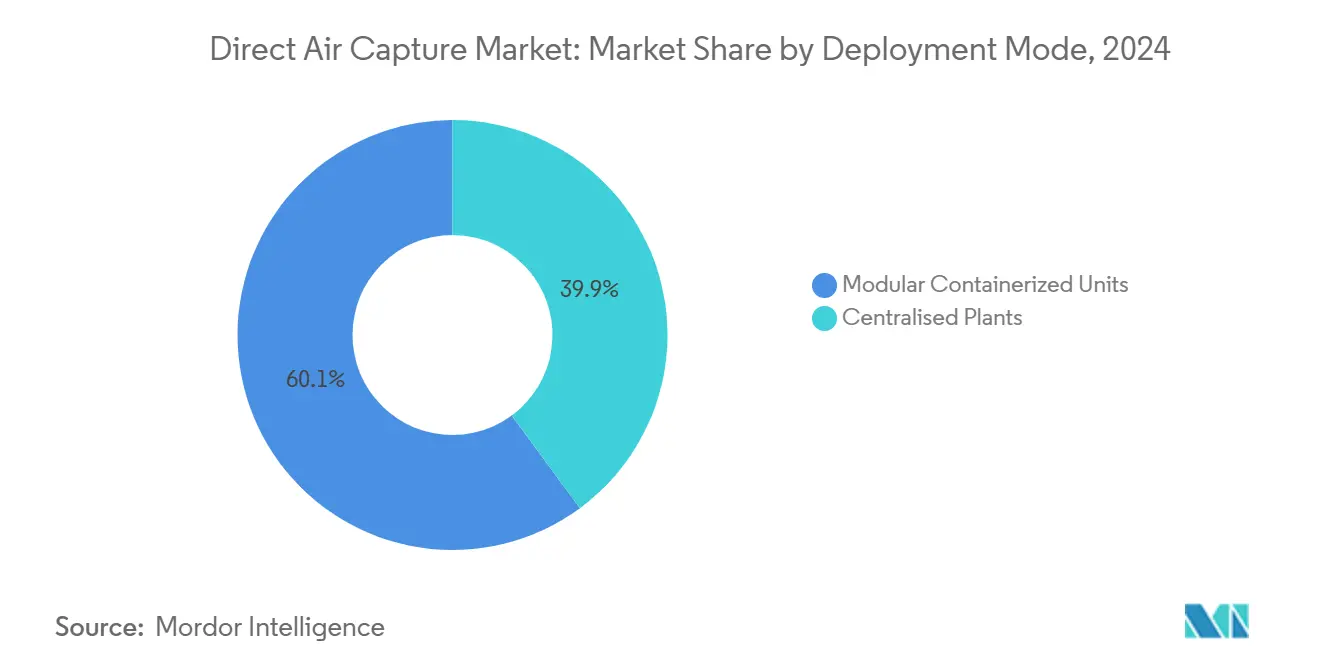
- By deployment mode, the modular containerized units segment captured 60.1% of the direct air capture market size in 2024, while the centralised plants are projected to grow at a 78.9% CAGR through 2030.
- By application, carbon sequestration (geological) led with 52% of the direct air capture market share in 2024; food and beverage is forecast to expand at a 72.1% CAGR through 2030.
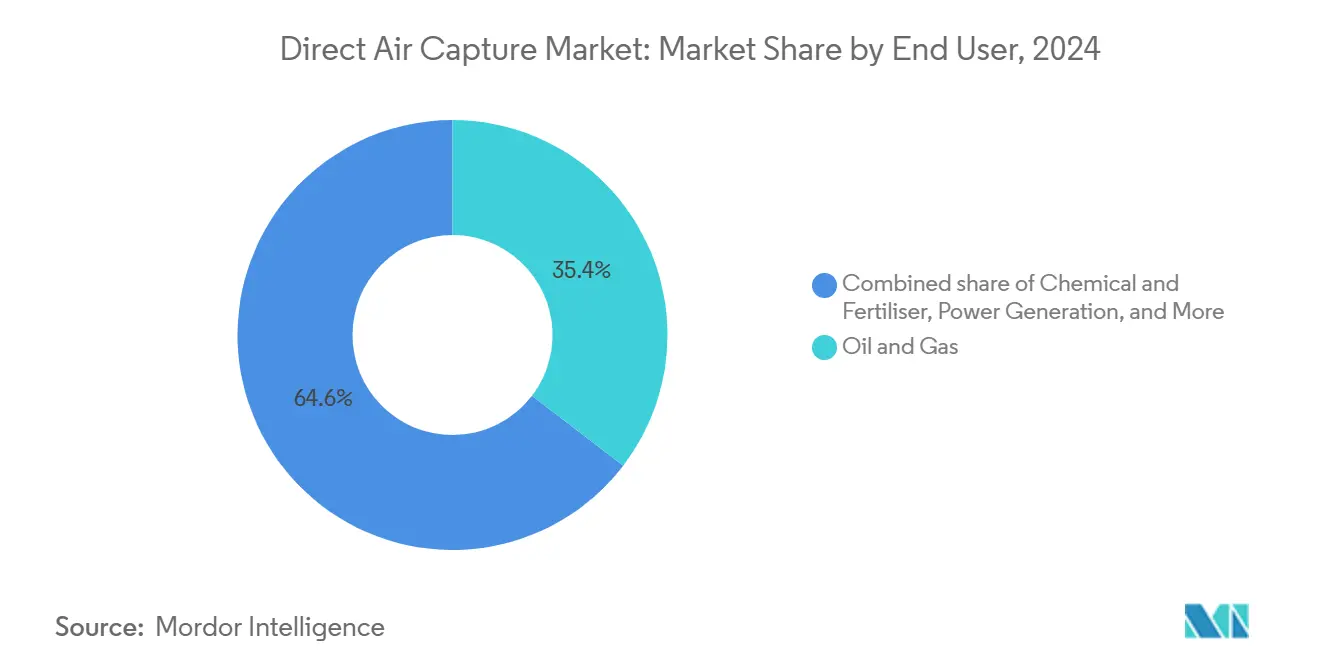
- By end-user, oil and gas held a 35.4% share of the direct air capture market size in 2024, while chemical and fertiliser demand is projected to advance at a 73.8% CAGR between 2025-2030.
- By geography, North America held 45.9% of the direct air capture market size in 2024, while Asia-Pacific is advancing at an 80.4% CAGR through 2030.
Global Direct Air Capture Market Trends and Insights
Drivers Impact Analysis*
| Driver | (~) (%) Impact on CAGR Forecast | Geographic Relevance | Impact Timeline |
|---|---|---|---|
| Direct-air capture tax credits & regulated carbon pricing schemes | 18.5% | North America & EU, expanding to APAC | Medium term (2-4 years) |
| Corporate net-zero commitments accelerating offtake contracts | 15.2% | Global, concentrated in North America & EU | Short term (≤ 2 years) |
| Breakthrough sorbent cost curves enabled by material science | 12.8% | Global, with R&D centers in North America, EU, Japan | Long term (≥ 4 years) |
| Scale-up of low-carbon hydrogen driving co-location synergies | 9.4% | APAC core, spill-over to North America & EU | Medium term (2-4 years) |
| Ocean-coupled DAC prototypes lowering energy penalty | 6.1% | Global coastal regions, early adoption in Singapore, UK | Long term (≥ 4 years) |
| Data-centre waste-heat integration pilots | 4.2% | North America & EU tech hubs, expanding globally | Medium term (2-4 years) |
| Source: Mordor Intelligence | |||
Direct-Air Capture Tax Credits and Regulated Carbon Pricing Schemes
Enhanced 45Q incentives lift the effective revenue floor to USD 180 per ton for storage-linked removal, creating a robust commercial case for first-wave plants. Parallel frameworks surface in Canada, the EU’s carbon border adjustment mechanism, and emerging APAC markets, aligning removal premiums with rising compliance prices. Policymakers signal long-range support through multi-decade targets that de-risk capital formation and enable long tenor project finance. Although permit timelines and legislative revisions introduce volatility, the structural direction of rising carbon costs underpins investor confidence. Bundling renewable energy credits with capture incentives compresses paybacks and catalyzes integrated clean-energy hubs.
Corporate Net-Zero Commitments Accelerating Offtake Contracts
Enterprise procurement transitioned from voluntary offsets to legally binding offtake agreements, supplying ten-to-fifteen-year cash-flow visibility essential for debt financing.(1)Source: Jason Husk & Graham Wenz, “Inside-Out: Driving Down Direct Air Capture Costs With High-Efficiency Adsorbents,” Frontiers in Climate, frontiersin.org Technology leaders such as Microsoft, Google, and LEGO Group collectively locked in more than USD 1 billion of future removals at fixed or index-linked pricing, anchoring demand curves ahead of large-scale capacity. Financial institutions become early movers, treating permanent removal as a hedging instrument against portfolio transition risk. Contract standardization—covering verification, durability, and liability—enforces quality thresholds that elevate high-purity atmospheric credits above generic offset markets. The resulting bankability funnel moves the direct air capture market from venture financing toward project-level limited-recourse structures.
Breakthrough Sorbent Cost Curves Enabled by Material Science
Humidity-swing materials, structured sorbent geometries, and amino-acid salt hybrids collectively slash regeneration energy by 30-40%, attacking the highest operating-cost line item. University-industry consortia expedite scale-up by sharing pilot rigs and advanced characterization tools. Lower thermal demands translate into compact contactor footprints and reduced CAPEX, while enhanced cyclic stability extends media life and curbs replacement budgets. Innovation waves spill over into supply chain localization, spawning specialized manufacturing clusters for monolith substrates and advanced polymer membranes. Cost knock-ons ripple through balance-of-plant design, shrinking blower sizes, lowering pump duty cycles, and ultimately compressing the all-in removal price.
Scale-Up of Low-Carbon Hydrogen Driving Co-Location Synergies
Hydrogen electrolyzers furnish waste heat streams that align with low-temperature sorbent requirements, unlocking 15-25% cost synergies for co-situated assets. Shared renewable supply contracts spread curtailment risk across dual revenue sources, improving utilization factors for both technologies. Policy blueprints in Japan and South Korea prioritize clean hydrogen clusters that bundle capture and synthetic fuel production, accelerating infrastructure pooling. Integrated power-purchase strategies harness forward-contracted green electrons, reducing exposure to merchant price swings. Joint operations also streamline permitting timelines, as combined environmental impact assessments address capture, conversion, and storage in a single regulatory docket.
Restraints Impact Analysis*
| Restraint | (~) (%) Impact on CAGR Forecast | Geographic Relevance | Impact Timeline |
|---|---|---|---|
| High capital intensity & first-of-a-kind engineering risk | -8.7% | Global, most acute in emerging markets | Short term (≤ 2 years) |
| Limited CO₂ transport & storage infrastructure build-out pace | -6.3% | Global, particularly outside North America | Medium term (2-4 years) |
| Land-use conflicts for ultra-large sorbent contactor farms | -4.1% | Dense population regions, EU & APAC primarily | Medium term (2-4 years) |
| Volatile renewable-power PPA prices undermining OPEX predictability | -3.2% | Global, most pronounced in liberalized energy markets | Short term (≤ 2 years) |
| Source: Mordor Intelligence | |||
High Capital Intensity and First-of-a-Kind Engineering Risk
Early commercial plants command USD 600-1,000 of installed capital per annual ton of capture capacity, demanding equity cushions that limit participation to well-capitalized developers.(2)Source: Moritz Gutsch & Jens Leker, “Co-assessment of costs and environmental impacts for off-grid direct air carbon capture and storage systems,” Nature Communications Engineering, nature.com Novel process integration exposes projects to commissioning delays and unplanned downtime, as maiden-scale units in Iceland demonstrated. Public funding, such as the Department of Energy’s USD 1.8 billion hub program, underwrites learning curves yet does not fully offset schedule risk. Custom equipment procurement lengthens supply timelines and inflates contingency budgets, while sparse performance benchmarks complicate lender due diligence. Modular design and factory pre-assembly offer a path to standardize skids, shorten fieldwork, and lower the cost of capital over successive waves.
Limited CO₂ Transport and Storage Infrastructure Build-Out Pace
Capture deployment currently clusters around existing pipeline corridors and proven saline reservoirs, constraining geographic optionality. Outside the United States and parts of Canada, public-domain pore-space data remain sparse, and permitting for Class VI wells typically exceeds three years. Rail or truck transport adds USD 30-50 per ton on 500-mile hauls, eroding margins for demonstration-scale sites. Coordination gaps between capture developers and midstream operators create timing mismatches that stall final investment decisions. Long-term solutions involve hub-and-spoke networks backed by transport tariffs, strategic storage mapping, and synchronized environmental reviews that align capture capacity with available injection rights.
*Our forecasts treat driver/restraint impacts as directional, not additive. The impact forecasts reflect baseline growth, mix effects, and variable interactions.
Segment Analysis
By Technology: Solid Sorbents Hold Position While Electrochemical Rises
Solid sorbent systems carried 58% of the direct air capture market share in 2024 because of favorable kinetics and moderate operating temperatures. Continuing material advances are expected to defend this lead even as electrochemical and membrane solutions chart a 32% CAGR through 2030. Energy cuts from humidity-swing substrates and structured monoliths narrow levelized capture costs to the USD 300 per-ton band, nurturing scale deployment. Electrochemical units leverage semiconductor fabrication supply chains, promising step-wise capex compression once stack output surpasses 1 kt per year. Liquid solvent lines remain niche, suitable for co-deployment with high-grade waste heat. Cryogenic and hybrid concepts fill specialized purity or environmental niches but lack near-term volume impact.
Growth dynamics illustrate an innovation race rather than a zero-sum contest. Solid sorbent vendors push toward turnkey containerized modules, while electrochemical entrants experiment with roll-to-roll electrode manufacturing. Component cross-pollination—such as ion-exchange membranes inside classic packed beds—blurs categorical lines and accelerates cost discovery. Intellectual property protection intensifies, with patent filings clustering around sorbent synthesis routes, contactor geometries, and thermal-integration algorithms.


By Capture Capacity: Small Units Dominate Today, Megaton Plants Accelerate
Installations under 1 kt per year comprise 52% of 2024 capacity, reflecting the pilot heritage of the direct air capture market size. Projects above 100 kt per year nevertheless record a 45% CAGR, propelled by hub funding, offtake certainty, and risk-sharing consortia. Demonstrator arrays supply field data that feed design-for-manufacture programs, while commercial-small plants in the 10-100 kt band balance financeability with material volume for corporate buyers. Gigaton-scale ambition concentrates in the United States Gulf Coast, Iceland, and Australia, where renewable overbuild and storage geology overlap.
Economies of scale manifest through larger blower manifolds, central utility islands, and shared CO₂ conditioning trains. However, megaton complexes drive land-use concerns and require dedicated power lines, imposing stakeholder engagement burdens. Conversely, micro-skid swarms align with distributed renewables and incremental permitting but sacrifice operating leverage. Therefore, the direct air capture market adopts a barbell structure until logistic chains mature.
By Deployment Mode: Modular Dominates but Central Plants Scale Faster
Modular containerized units hold 63% of 2024 installations because factory-built skids speed commissioning and limit site works. They excel where power-price arbitrage or space constraints dictate flexibility. Centralized plants, though only 37% of current stock, log a 38% CAGR toward 2030 as economies of scale overshadow bespoke engineering premiums. Hub architectures with shared CO₂ compression, brine handling, and maintenance crews reinforce the case for larger footprints.
Standardization efforts converge on ISO reporting templates for module capacity, uptime, and sorbent life, smoothing bankability for roll-out pipelines. Meanwhile, centralized builds drive innovations in integrated thermal management, harnessing steam-rankine cycles or low-temperature geothermal sources to feed multiple capture blocks. Over time, hybrid estates combining clusters of modules around a central utility core may offer compromise configurations.
By Application: Storage Leads, Synthetic Fuels Gain
Carbon sequestration absorbs 46% of 2024 demand as companies chase durable negative emissions credits accepted under science-based target protocols. Synthetic fuels, including e-kerosene and e-methanol, climb at a 36.5% CAGR as aviation mandates crystallize premium pull for atmospheric feedstock. Mineralization pilots embed CO₂ into concrete and aggregate, demonstrating life-cycle benefits yet awaiting standardized material codes. Food and beverage industries adopt small modular units for greenhouse enrichment, valuing high-purity output despite limited volume.
Market evolution tilts toward multi-revenue configurations, pairing removal credits with product margins. Fuel pathways enjoy hedging value against volatile oil prices and compliance exposure, while sequestration hinges on the trajectory of carbon taxes. Portfolio developers diversify by maintaining capture cores that can pivot output across storage or utilization depending on policy and commodity signals.
By End User: Power Sector Still Largest, Aviation Expands Fast
Power generation accounted for 34% of the 2024 offtake, bundling capture with surplus renewable electricity and grid services. Airlines and fuel producers, however, post a 29% CAGR as sustainable aviation fuel blending targets lock in multidecade demand. Oil and gas firms deploy capture for Scope 1 emission offsets while marketing carbon-neutral barrels, though credibility scrutiny rises. Hard-to-abate sectors like cement and steel trial co-located capture to address calcination and process emissions, leveraging waste heat to trim regeneration duty cycles.
Data centers explore DAC integration by routing low-grade server heat through modular units, thus driving circular-energy narratives. Chemical firms eye atmospheric CO₂ as a zero-carbon feedstock for ammonia and polyols, contingent upon renewable hydrogen cost curves. End-user diversification insulates the direct air capture industry from single-sector shocks and encourages technology tailoring to varied duty cycles.
Geography Analysis
North America leads with 41% of the direct air capture market share in 2024, underpinned by the Inflation Reduction Act tax credits, extensive CO₂ pipeline corridors, and Gulf Coast saline reservoirs that cut storage costs.(3)Source: Rhodium Group, “Direct Air Capture Deployment and Economic Opportunity: State-by-State,” rhg.com Department of Energy grants totaling USD 50 million for Project Cypress and USD 1.8 billion for hub build-outs establish project-finance precedents and crowd in private capital. Canadian momentum springs from carbon-pricing rebates and wind-hydro synergies, while Mexico edges into the value chain through renewable power export corridors. Regional clustering around Texas, Louisiana, and Alberta accelerates labor scaling and supply-chain localization.
Europe remains a pivotal node for technology research and verification protocols. Germany, the United Kingdom, and the Nordics pilot integration with district heating and offshore storage, leveraging mature permitting frameworks. Carbon border adjustment discussions elevate interest from export-oriented industries seeking embedded removal to maintain market access. Southern Europe emphasizes mineralization potential, harnessing abundant limestone resources.
Asia-Pacific registers the highest growth, clocking a 28% CAGR through 2030 as solar and wind overcapacity intersect with manufacturing depth. China’s five-year plans target negative-emission corridors linked to ammonia exports and green steel, although storage regulation lags capture investment. Japan and South Korea drive co-location of DAC with hydrogen valleys, aided by robust subsidy stacks and technology partnerships. India’s renewable pipeline and industrial clusters attract feasibility studies, yet financing terms and CO₂ transport clarity remain gating factors. Australia leverages vast saline aquifers and solar irradiance, positioning itself as a regional removal credit exporter.

Competitive Landscape
Nineteen substantive players vie in a technically segmented arena, yielding a fragmentation profile that rewards intellectual property and partnership agility rather than pure scale. Climeworks commands brand visibility through operational benchmarks at its Orca and Mammoth plants, anchoring premium offtakes with tech majors.(4)Source: Climeworks, “The reality of deploying direct air capture in the field,” climeworks.com Carbon Engineering advances alkaline solvent routes with backing from Occidental, which recently absorbed Holocene to expand engineering depth. Heirloom pioneers limestone looping that lowers feedstock cost and accelerates reaction kinetics, winning multi-year purchase agreements.
Electrochemical startups like Verdox and Mission Zero import battery-grade manufacturing practices to slash cell stack costs. Oxygen regeneration firms pursue hybrid air capture coupled with fuel cells, opening patent clashes around membrane compositions. Ocean-coupled entrants like Equatic and Ebb Carbon target the maritime niche, banking on favorable public perception and scalable alkalinity adjustments. Strategic alliances proliferate: sorbent specialists partner with HVAC giants, while project developers lock in renewables under synthetic PPA structures to hedge energy input volatility. Investors monitor successful commissioning milestones, with Series A rounds increasingly eclipsing USD 80 million, exemplified by CarbonCapture’s raise.
Direct Air Capture Industry Leaders
Climeworks AG
Carbon Engineering Ltd.
1PointFive (Occidental)
Global Thermostat
Heirloom Carbon Technologies
- *Disclaimer: Major Players sorted in no particular order

Recent Industry Developments
- January 2025: Department of Energy committed USD 50 million to Project Cypress, a Louisiana demonstration slated to capture 100 kt annually, reinforcing federal support for first-wave commercialization.
- December 2024: Climeworks’ Mammoth plant in Iceland attained full operations, delivering 36 kt annual capacity and real-time performance data for solid sorbent scaling.
- November 2024: STRATOS facility construction reached 94% completion, signaling imminent launch of one of the largest modular arrays globally.
- October 2024: Occidental closed the acquisition of Holocene, integrating limestone-driven capture into its Permian hub roadmap.


Global Direct Air Capture Market Report Scope
| Liquid Solvent (L‑DAC) |
| Solid Sorbent (S‑DAC) |
| Electrochemical‑DAC |
| Membrane‑Based Capture |
| Others |
| Below kt CO₂ yr (Pilot) |
| 1 to 10 kt CO₂ yr (Demo) |
| 10 to 100 kt CO₂ yr (Commercial-Small) |
| Above 100 kt CO₂ yr (Commercial-Large) |
| Modular Containerised Units |
| Centralised Plants |
| Carbon Sequestration (Geological) |
| Enhanced Oil Recovery |
| Synthetic Fuels |
| E-fuels |
| Sustainable Aviation Fuel |
| Methanol |
| Mineralisation and Building Materials |
| Food and Beverage |
| Greenhouse Enrichment |
| Others |
| Power Generation |
| Oil and Gas |
| Cement and Steel |
| Chemical and Fertiliser |
| Aviation |
| Data Centres and ICT |
| Others |
| North America | United States |
| Canada | |
| Mexico | |
| Europe | Germany |
| United Kingdom | |
| France | |
| Italy | |
| NORDIC Countries | |
| Russia | |
| Rest of Europe | |
| Asia-Pacific | China |
| India | |
| Japan | |
| South Korea | |
| ASEAN Countries | |
| Rest of Asia-Pacific | |
| South America | Brazil |
| Argentina | |
| Rest of South America | |
| Middle East and Africa | Saudi Arabia |
| United Arab Emirates | |
| South Africa | |
| Egypt | |
| Rest of Middle East and Africa |
| By Technology | Liquid Solvent (L‑DAC) | |
| Solid Sorbent (S‑DAC) | ||
| Electrochemical‑DAC | ||
| Membrane‑Based Capture | ||
| Others | ||
| By Capture Capacity | Below kt CO₂ yr (Pilot) | |
| 1 to 10 kt CO₂ yr (Demo) | ||
| 10 to 100 kt CO₂ yr (Commercial-Small) | ||
| Above 100 kt CO₂ yr (Commercial-Large) | ||
| By Deployment Mode | Modular Containerised Units | |
| Centralised Plants | ||
| By Application | Carbon Sequestration (Geological) | |
| Enhanced Oil Recovery | ||
| Synthetic Fuels | ||
| E-fuels | ||
| Sustainable Aviation Fuel | ||
| Methanol | ||
| Mineralisation and Building Materials | ||
| Food and Beverage | ||
| Greenhouse Enrichment | ||
| Others | ||
| By End User | Power Generation | |
| Oil and Gas | ||
| Cement and Steel | ||
| Chemical and Fertiliser | ||
| Aviation | ||
| Data Centres and ICT | ||
| Others | ||
| By Geography | North America | United States |
| Canada | ||
| Mexico | ||
| Europe | Germany | |
| United Kingdom | ||
| France | ||
| Italy | ||
| NORDIC Countries | ||
| Russia | ||
| Rest of Europe | ||
| Asia-Pacific | China | |
| India | ||
| Japan | ||
| South Korea | ||
| ASEAN Countries | ||
| Rest of Asia-Pacific | ||
| South America | Brazil | |
| Argentina | ||
| Rest of South America | ||
| Middle East and Africa | Saudi Arabia | |
| United Arab Emirates | ||
| South Africa | ||
| Egypt | ||
| Rest of Middle East and Africa | ||


Key Questions Answered in the Report
What growth rate is forecast for the direct air capture market between 2025 and 2030?
The direct air capture market is expected to post a 68.32% CAGR during 2025-2030, taking the value from USD 191.54 million in 2025 to USD 2,587.84 million in 2030.
What technology currently leads commercial deployments in the direct air capture market?
Asia-Pacific is projected to grow at a 80.4% CAGR through 2030, driven by renewable energy abundance and government incentives for negative emissions.
How do 45Q tax credits influence project economics?
The U.S. 45Q provision offers up to USD 180 per ton for permanently stored CO₂, materially improving revenue certainty and reducing payback periods for new plants.
What technology currently leads commercial deployments in the direct air capture market?
Solid sorbent systems hold 57.5% of market share thanks to moderate temperature operation and rapid material-science improvements.
Why are corporate offtake agreements crucial for financing in the direct air capture market?
Multi-year purchase contracts from firms such as Microsoft and Google provide predictable cash flows that enable limited-recourse debt structures for first commercial facilities.
What cost reduction target unlocks mass DAC adoption across the direct air capture market?
Crossing below USD 200 per ton of removed CO₂ is widely viewed as the trigger for broad-based deployment across storage and synthetic fuel applications.
Page last updated on:


