Market Overview
| Study Period | 2021 - 2031 |
|---|---|
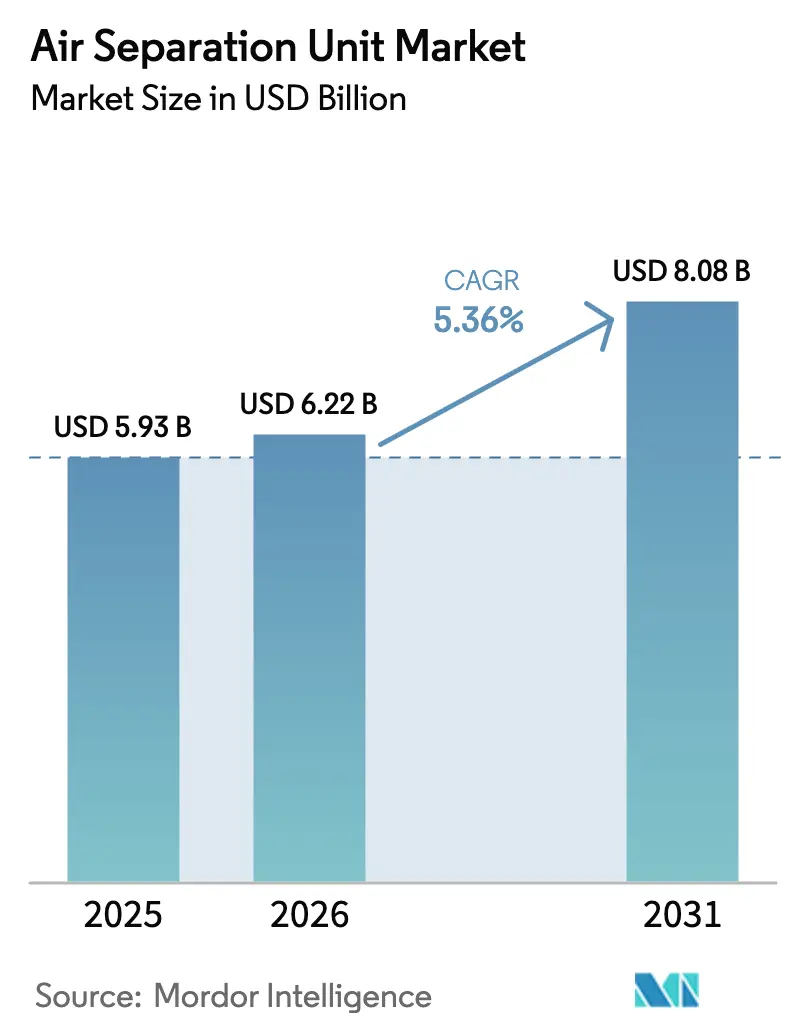
| Market Size (2026) | USD 6.22 Billion |
| Market Size (2031) | USD 8.08 Billion |
| Growth Rate (2026 - 2031) | 5.36% CAGR |
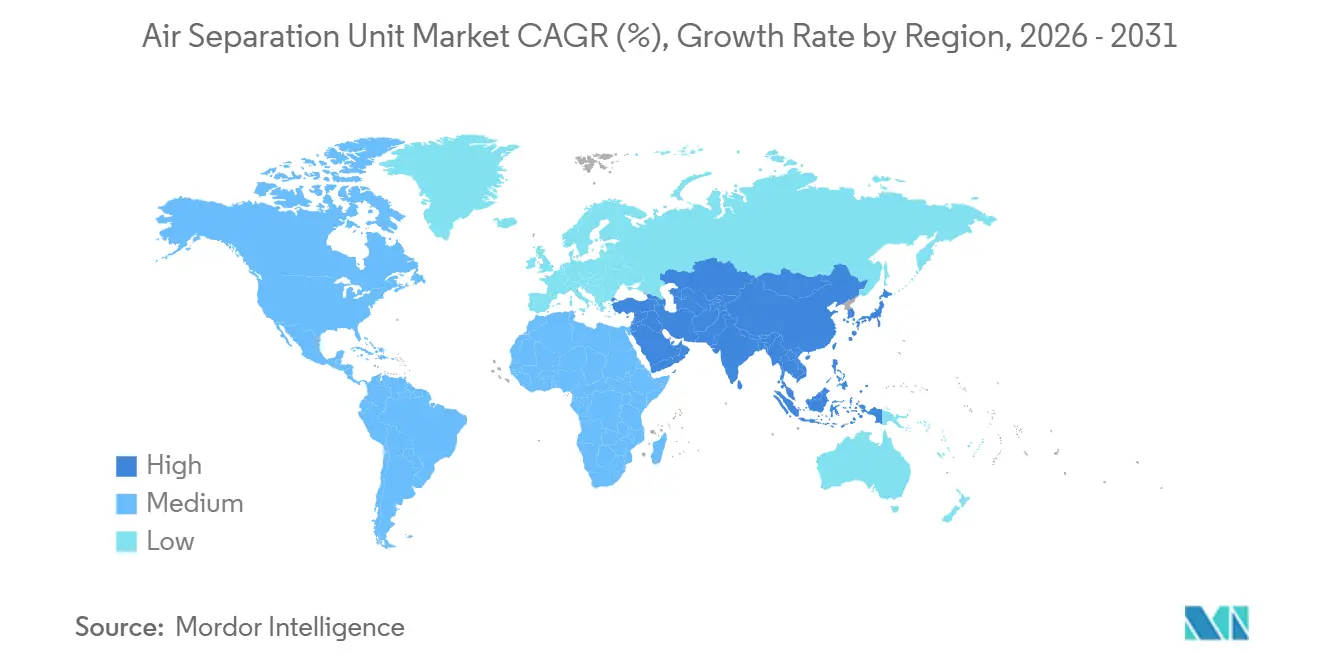
| Fastest Growing Market | Middle East and Africa |
| Largest Market | Asia-Pacific |
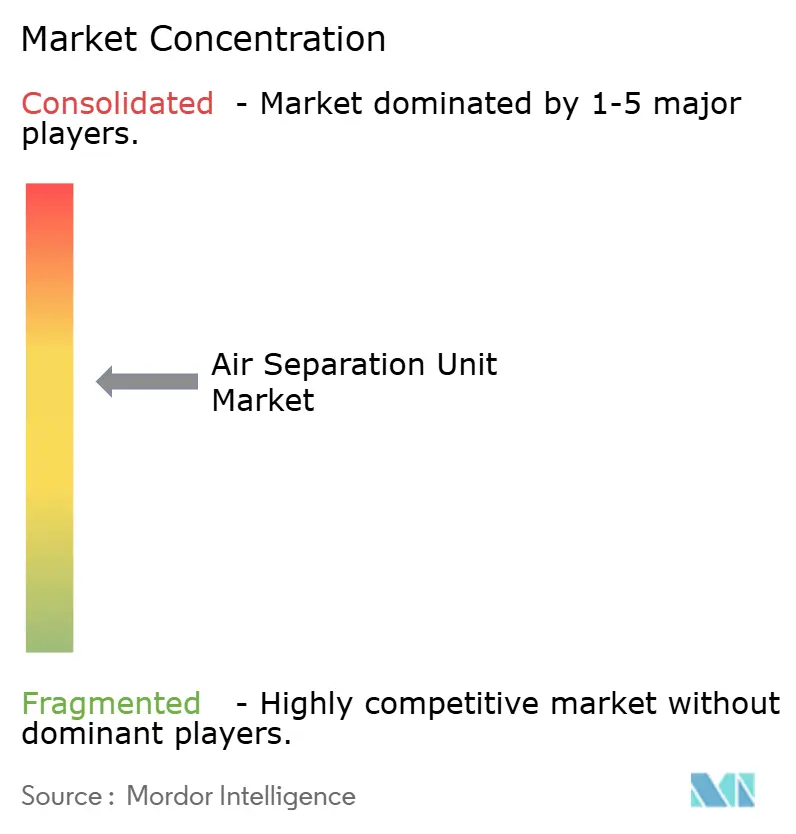
| Market Concentration | Medium |
Major Players *Disclaimer: Major Players sorted in no particular order Image © Mordor Intelligence. Reuse requires attribution under CC BY 4.0. | |
Air Separation Unit Market Analysis by Mordor Intelligence
The Air Separation Unit Market size is projected to expand from USD 5.93 billion in 2025 and USD 6.22 billion in 2026 to USD 8.08 billion by 2031, registering a CAGR of 5.36% between 2026 to 2031.
Rapid semiconductor-grade purity requirements, blue-hydrogen build-outs, and a modest rebound in steel output are steering demand away from mere volume growth toward specification-driven contracts. Ultra-high-purity nitrogen and argon have become non-negotiable inputs for 3-nanometer and smaller nodes, prompting chipmakers to co-locate dedicated units rather than rely on merchant supply. Oxy-fuel combustion pilots in cement and glass, together with LNG expansions that need continuous nitrogen purging, are widening the user base. Operators, however, must navigate electricity prices that account for 50-70% of operating expense and an emerging regulatory premium on carbon footprints, especially in Europe, where the emissions price exceeds EUR 80 per tonne.
Key Report Takeaways
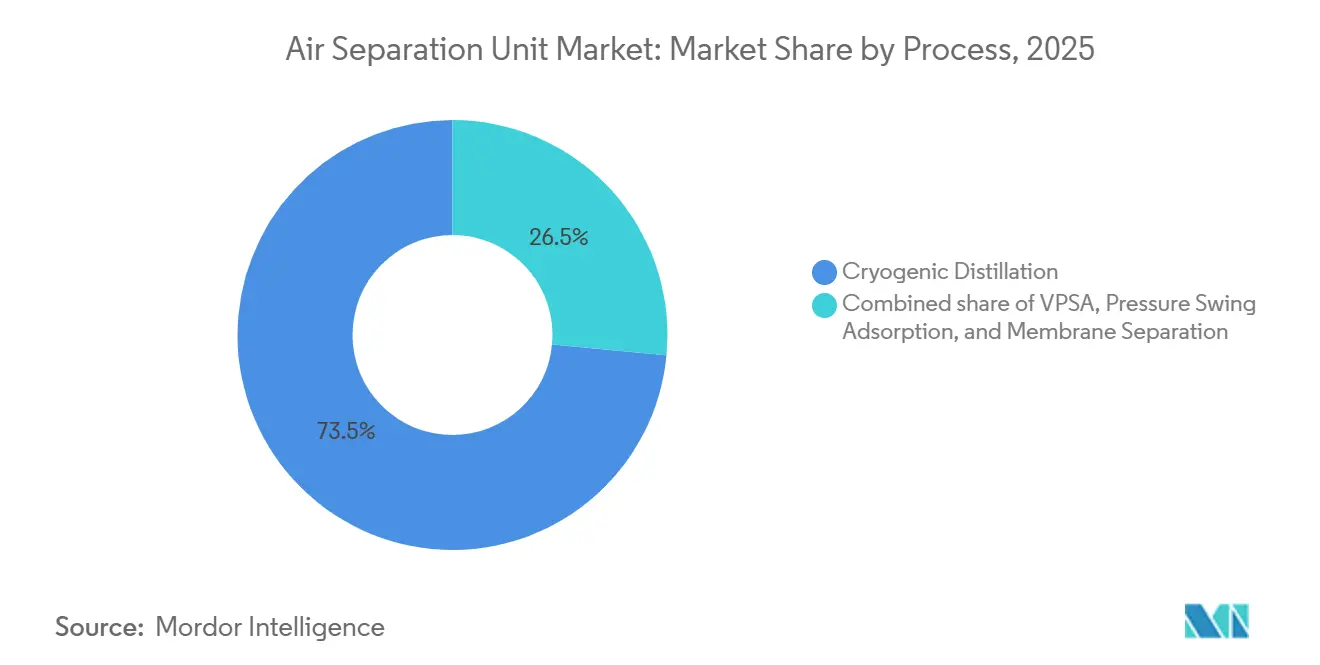
- By process, cryogenic distillation led with 73.5% revenue in 2025, while vacuum pressure swing adsorption is advancing at an 8.9% CAGR to 2031.
- By gas, nitrogen commanded 43.3% of the air separation unit market share in 2025, whereas oxygen is forecast to expand at a 7.5% CAGR through 2031.
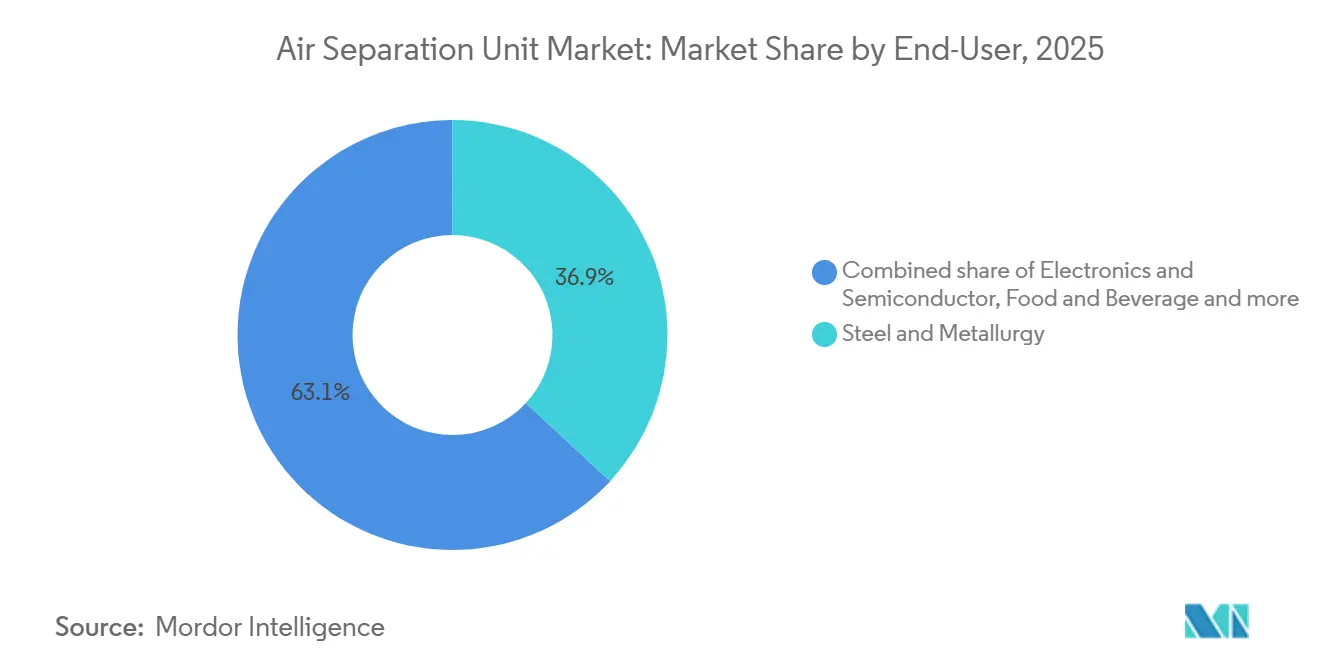
- By end-user, steel and metallurgy held 36.9% of demand in 2025, but electronics and semiconductor applications are projected to grow at an 8.2% CAGR to 2031.
- By geography, Asia Pacific controlled 43.1% of the value in 2025, while the Middle East and Africa region is set to record the fastest 6.6% CAGR during the outlook period.
- Linde, Air Liquide, and Air Products together controlled close to 60% of new installations above 1,000 tonnes per day in 2025, underscoring a moderately concentrated supplier landscape.
Note: Market size and forecast figures in this report are generated using Mordor Intelligence’s proprietary estimation framework, updated with the latest available data and insights as of January 2026.
Global Air Separation Unit Market Trends and Insights
Drivers Impact Analysis*
| Driver | (~) % Impact on CAGR Forecast | Geographic Relevance | Impact Timeline |
|---|---|---|---|
| Surging semiconductor-grade gas demand | +1.8% | Taiwan, South Korea, Japan; spill-over to Arizona and Ohio in the U.S. | Medium term (2-4 years) |
| Capacity additions in steel & chemicals | +1.2% | China, India, ASEAN, Saudi Arabia, UAE | Short term (≤ 2 years) |
| Post-COVID structural rise in medical O₂ use | +0.7% | Global, concentrated in South Asia and Sub-Saharan Africa | Long term (≥ 4 years) |
| LNG / blue-hydrogen build-out needs N₂ & O₂ | +1.4% | Saudi Arabia, UAE, Qatar, U.S. Gulf Coast | Long term (≥ 4 years) |
| Renewable-powered ASUs & LAES integration | +0.5% | United Kingdom, Germany, California, Texas | Long term (≥ 4 years) |
| Modular on-site mini-ASUs for remote industry | +0.6% | Australia, Chile, Peru, South Africa | Medium term (2-4 years) |
| Source: Mordor Intelligence | |||


Surging Semiconductor-Grade Gas Demand
Semiconductor fabrication plants consumed 1.2 million tonnes of ultra-high-purity nitrogen and 180,000 tonnes of argon in 2025, and industry capacity is expanding 6-7% annually through 2027.[1]SEMI, “World Fab Forecast,” semi.org TSMC’s Arizona fabs require on-site units capable of 99.9999% argon purity to support extreme ultraviolet lithography, an oxygen-intolerant process that costs USD 150-200 million per tool.[2]Ministry of Steel, Government of India, “Steel Production Statistics 2024,” steel.gov.in Air Liquide earmarked EUR 7 billion for electronics-sector gas infrastructure through 2028, embedding dedicated plants at customer sites across Taiwan, South Korea, and the United States. Transitioning to gate-all-around architectures increases argon use per wafer by up to 20%, anchoring utilization rates even when consumer electronics cycles soften. Specification-driven contracts that carry 40-60% purity premiums are therefore insulating revenues from traditional volume swings.
Capacity Additions in Steel & Chemicals
India aims for 300 million tonnes of annual crude steel capacity by 2030, an ambition that adds 25-30 million tonnes of oxygen demand each year. JSW Steel’s 2,200 tonne-per-day cryogenic unit in Karnataka comes online in mid-2026 under a 20-year supply agreement. In China, electric-arc conversions are sustaining oxygen demand as mills employ lancing techniques to raise scrap melt rates. The chemicals sector mirrors this momentum; ExxonMobil and Air Liquide’s Baytown complex added a 9,000 tonne-per-day plant in 2024 to feed hydrogen and cracking units. Saudi Aramco’s refining expansion promises a further 12,000-15,000 tonnes-per-day of oxygen by 2027, amplifying long-term off-take certainty.
Post-COVID Structural Rise in Medical O₂ Use
The pandemic revealed a 70% oxygen shortfall in low- and middle-income countries. India’s 162,000 PSA generators, installed between 2021 and 2024, created a 300,000 tonne annual base that previously depended on cylinders.[3]World Health Organization, “Oxygen Access and Availability Report 2025,” who.int Nigeria’s USD 120 million National Oxygen Action Plan mandates on-site units at tertiary hospitals by 2027, adding 20,000 tonnes per year. On-site generation cuts supply costs by up to 60% where transport logistics are fragile. ISO 13485 revisions now treat hospital oxygen generators as regulated medical devices, accelerating permanent capex allocations and locking in steady demand for modular vacuum PSA and small cryogenic systems.
LNG / Blue-Hydrogen Build-Out Needs N₂ & O₂
Autothermal reforming consumes 0.9 tonnes of oxygen per tonne of hydrogen, making air separation a pillar of the global 10 million tonne blue-hydrogen pipeline under Europe’s REPowerEU plan.[4]International Energy Agency, “Hydrogen Report 2025,” iea.org Linde and OCI’s USD 1.8 billion blue-ammonia project in Texas features a 4,500 tonne-per-day unit slated for Q4 2027 start-up. Air Products’ NEOM complex in Saudi Arabia will absorb 1.08 million tonnes of oxygen annually once operational in 2026. On the LNG side, each 5 million tonne liquefaction train requires up to 200,000 tonnes of nitrogen yearly for inerting and cooling; QatarEnergy’s North Field build-out alone triggers another 1.5-2 million tonnes of nitrogen demand, equating to multiple mid-scale plants.
Restraints Impact Analysis*
| Restraint | (~) % Impact on CAGR Forecast | Geographic Relevance | Impact Timeline |
|---|---|---|---|
| High capex & energy intensity of cryogenic ASUs | -1.1% | Regions with electricity > USD 0.12/kWh | Short term (≤ 2 years) |
| Electricity-price volatility risk | -0.8% | Germany, United Kingdom, Japan, Australia | Medium term (2-4 years) |
| Tightening carbon-footprint regulation | -0.6% | European Union, California, emerging rules in China | Long term (≥ 4 years) |
| Supply bottlenecks in brazed Al heat exchangers | -0.4% | Asia Pacific and North America assembly backlogs | Medium term (2-4 years) |
| Source: Mordor Intelligence | |||
High Capex & Energy Intensity of Cryogenic ASUs
A typical 2,000 tonne-per-day facility costs USD 250-300 million, with 40-45% tied to brazed aluminum cold-box hardware. Electricity needs of 0.4-0.6 kWh per normal cubic meter of oxygen yield USD 12-18 million in annual power costs at industrial tariffs of USD 0.08-0.10/kWh. Regions such as Germany and Japan, where tariffs edge above USD 0.14/kWh, require 15-20 year take-or-pay commitments to achieve project bankability. Modular VPSA systems reduce upfront investment by 20-30% but cap purity at 90-93%, limiting deployment to processes with looser specifications. Project lead times of 24-30 months elevate execution risk; Air Liquide reported three large projects slipping 6-12 months in 2024 due to welding and instrumentation labor shortages.
Electricity-Price Volatility Risk
European wholesale electricity averaged EUR 80-100 per megawatt-hour in 2025, double 2019-2020 levels, eroding margins by 15-20 points for operators without hedged supply. Co-location with renewables offers relief; Highview Power’s 50-megawatt liquid-air storage plant in Manchester produces gases during wind-driven off-peak periods, then releases stored energy at peak prices, trimming net power cost by 25-30%. Such arbitrage models need liquid day-ahead markets, limiting applicability to liberalized grids in Europe, Australia, and select U.S. states. In regulated markets like China and India, static tariffs saddle operators with full exposure to price jumps, constraining investment appetite.
*Our forecasts treat driver/restraint impacts as directional, not additive. The impact forecasts reflect baseline growth, mix effects, and variable interactions.
Segment Analysis
By Process: Cryogenic Dominance Anchors Base Load
Cryogenic distillation accounted for 73.5% of the 2025 value, reinforcing the air separation unit market as a backbone supplier to integrated steel and petrochemical sites. The air separation unit market size for cryogenic systems is projected to rise at a 5.1% CAGR, supported by multiproduct output that matches complex off-take profiles. Cryogenic plants above 2,000 tonnes per day serve integrated complexes where oxygen, nitrogen, and argon volumes justify scale economies. Co-located rare-gas recovery units capitalize on high neon and xenon prices, adding USD 30-40 million in annual revenue streams for operators in South Korea and Taiwan. Structured-packing columns patented by Air Products cut energy draw by 10-15%, enhancing competitiveness against modular technologies.
Vacuum pressure swing adsorption is expanding at an 8.9% CAGR, overtaking the market average by 3.5 points. Containerized VPSA skids of 50-200 tonnes per day appeal to mining sites in Western Australia and Chile’s Atacama Desert, where grid electricity is scarce, and diesel premium pricing surpasses USD 0.25/kWh. Linde’s modular line offers 0.3-0.4 kWh per normal cubic meter of oxygen, a 25-35% efficiency gain at sub-500-tonne scales. Membrane separation, less than 5% of 2025 revenue, serves offshore platforms where footprint is crucial. Honeywell’s UOP Polybed PSA delivered 99.9% nitrogen at 40 bar for a Qatar Petroleum gas-treatment train, eliminating downstream compressors and cutting installed cost by 20-25%.


By Gas: Oxygen Acceleration Reflects Energy Transition
Nitrogen retained 43.3% revenue in 2025, yet oxygen is on a faster 7.5% CAGR to 2031 as blue-hydrogen, oxy-fuel cement, and glass pilots multiply. The air separation unit market size for oxygen alone could reach USD 3 billion by 2031 if planned hydrogen capacity materializes. Each tonne of blue hydrogen needs 0.9 tonnes of oxygen, and with 100 million tonnes of hydrogen targeted globally by 2030, oxygen demand may reach 90 million tonnes per year. Argon, at roughly 8-10% of value, is growing 6.5% on stainless-steel process shifts to argon-oxygen decarburization furnaces, which cut chromium losses and raise yields. Rare gases captured 6% of revenue despite an under-2% volume share; neon scarcity since the 2024 Ukrainian supply disruption spurred new purification trains in Japan, South Korea, and Taiwan, improving regional self-sufficiency.
By End-User: Electronics Overtakes Steel’s Growth Trajectory
Steel and metallurgy accounted for 36.9% of 2025 sales but expanded at a modest 4.1% CAGR as blast-furnace capex slowed. Electronics and semiconductor gas off-take grows 8.2% annually, reflecting 40-60% price premiums for 99.9999% purity. The air separation unit market share for electronics could top 15% by 2031 as mega-fabs in Arizona, Ohio, and Gujarat ramp to full capacity. Chemicals and petrochemicals, 18-20% of demand, advance at 5.5% by adopting oxygen-enriched reforming that lifts hydrogen yield 8-12%. Healthcare demand, still only 6-8% of volume, logged double-digit growth in 2024-2025 and will remain elevated as WHO guidelines favor on-site generation for facilities exceeding 50 beds.
Geography Analysis
Asia Pacific captured 43.1% of the 2025 value, supported by China’s 1.02 billion tonnes of steel and India’s USD 10 billion semiconductor incentive that reimburses 30-40% of gas-infrastructure capex. Regional specialists like Yingde Gases and Sichuan Air Separation shorten delivery cycles to 12-18 months, squeezing global majors on mid-scale projects. North America held roughly 22% of revenue and grew 5.8%, anchored by the CHIPS and Science Act’s USD 52.7 billion subsidy pool that finances integrated gas systems at TSMC and Intel sites. ExxonMobil and Air Liquide’s Baytown plant illustrates refinery integration synergies that cut merchant-gas purchases by 95%.
Europe, 18-20% of demand, advances 4.2% as high power tariffs and EUR 80-90 carbon pricing pressure margins, yet REPowerEU’s 10 million-tonne domestic hydrogen target underpins new capacity. The Middle East and Africa achieve the fastest 6.6% CAGR. Air Products’ USD 8.4 billion NEOM complex alone needs 15 large cryogenic units, while ADNOC’s Ruwais upgrade added 3,500 tonnes-per-day demand in 2024. South America contributes 4-5% of value and grows 5% on Brazilian steel modernization and Chilean VPSA deployments. Australia and New Zealand, a modest 3-4% slice, expand 6% as LNG projects increase nitrogen requirements for pipeline inerting.

Competitive Landscape
The supplier roster is moderately consolidated. Linde, Air Liquide, and Air Products together controlled just under 60% of new installations above 1,000 tonnes per day in 2025. Each emphasizes long-term, on-site contracts that deliver 90-95% utilization; Air Liquide’s EUR 7 billion electronics program underscores the trend. Linde’s 2024 equity stake in a Taiwanese distributor tightens last-mile purity control, where a single contamination event could idle USD 10-15 billion fabs. Air Products’ structured-packing technology slices energy draw to 0.38-0.42 kWh/Nm³ O₂, translating to USD 2-3 million annual savings for a 2,000 tonne-per-day site.
Regional challengers are exploiting cycle-time differentials. Yingde Gases in China and INOX Air Products in India win 12-18 month delivery awards for mid-scale units, while Messer leverages proximity in Central Europe. Modular VPSA specialists such as Universal Industrial Gases shipped 40-plus containerized systems in 2024-2025, cutting installed cost by 30-40% and finding niches in remote mining. Supply-chain bottlenecks in brazed aluminum heat exchangers persist; Hangzhou Hangyang’s new vacuum-brazing furnace aims to trim Asia-Pacific lead times from 16 to 12 months by 2027.
White-space opportunities cluster around renewable-powered plants. Highview Power’s Manchester project marries cryogenic separation with liquid-air storage, capturing GBP 30-40/MWh spreads and offering an exportable template now replicated at 300 megawatts of pipeline capacity.
Air Separation Unit Industry Leaders
Linde AG
Messer Group GmbH
Air Liquide SA
Air Products and Chemicals, Inc.
Nippon Sanso Holdings (Taiyo Nippon Sanso)
- *Disclaimer: Major Players sorted in no particular order

Recent Industry Developments
- February 2025: Air Liquide reported a record EUR 4.5 billion investment backlog, including new ASUs for Mitsubishi Materials in Japan and multiple electronics contracts.
- February 2025: Linde announced 59 small on-site project wins in 2024, adding 64 ECOVAR® plants across electronics and decarbonization sites.
- December 2024: PKU Pioneer secured its first US export order for PSA-CO purification technology, serving a 100,000 t/year dimethyl carbonate line.
- October 2024: Linde began operations at Indonesia’s largest ASU, a USD 120 million oxygen-nitrogen plant for PT Freeport’s smelter.


Global Air Separation Unit Market Report Scope
Air separation units (ASU) are the devices used to extract gases, like nitrogen, oxygen, argon, etc., from the atmosphere through cryogenic or non-cryogenic distillation.
The air separation unit market is segmented by process, gas, end user, and geography. By process, the market is segmented into cryogenic distillation, pressure swing adsorption, vacuum PSA, and membrane separation. By gas, the market is segmented by gas into nitrogen, oxygen, argon, and rare gases. By end user, the market is segmented as the chemical industry, the oil and gas industry, and other end users. The report also covers the market size and forecasts for the air separation unit market across major regions. The report offers the market size in value terms in USD for all the abovementioned segments.
By Process
| Cryogenic Distillation |
| Pressure Swing Adsorption (PSA) |
| Vacuum PSA (VPSA) |
| Membrane Separation |
By Gas
| Nitrogen |
| Oxygen |
| Argon |
| Rare Gases (Ne, Kr, Xe) |
By End-User
| Steel and Metallurgy |
| Chemicals and Petrochemicals |
| Oil and Gas and Refining |
| Healthcare and Medical |
| Electronics and Semiconductor |
| Food and Beverage |
| Energy and Power Generation |
| Others |
By Geography
| North America | United States |
| Canada | |
| Mexico | |
| Europe | Germany |
| United Kingdom | |
| France | |
| Italy | |
| Spain | |
| NORDIC Countries | |
| Russia | |
| Rest of Europe | |
| Asia-Pacific | China |
| India | |
| Japan | |
| South Korea | |
| ASEAN Countries | |
| Australia and New Zealand | |
| Rest of Asia-Pacific | |
| South America | Brazil |
| Argentina | |
| Colombia | |
| Rest of South America | |
| Middle East and Africa | Saudi Arabia |
| United Arab Emirates | |
| South Africa | |
| Egypt | |
| Rest of Middle East and Africa |
| By Process | Cryogenic Distillation | |
| Pressure Swing Adsorption (PSA) | ||
| Vacuum PSA (VPSA) | ||
| Membrane Separation | ||
| By Gas | Nitrogen | |
| Oxygen | ||
| Argon | ||
| Rare Gases (Ne, Kr, Xe) | ||
| By End-User | Steel and Metallurgy | |
| Chemicals and Petrochemicals | ||
| Oil and Gas and Refining | ||
| Healthcare and Medical | ||
| Electronics and Semiconductor | ||
| Food and Beverage | ||
| Energy and Power Generation | ||
| Others | ||
| By Geography | North America | United States |
| Canada | ||
| Mexico | ||
| Europe | Germany | |
| United Kingdom | ||
| France | ||
| Italy | ||
| Spain | ||
| NORDIC Countries | ||
| Russia | ||
| Rest of Europe | ||
| Asia-Pacific | China | |
| India | ||
| Japan | ||
| South Korea | ||
| ASEAN Countries | ||
| Australia and New Zealand | ||
| Rest of Asia-Pacific | ||
| South America | Brazil | |
| Argentina | ||
| Colombia | ||
| Rest of South America | ||
| Middle East and Africa | Saudi Arabia | |
| United Arab Emirates | ||
| South Africa | ||
| Egypt | ||
| Rest of Middle East and Africa | ||


Key Questions Answered in the Report
What is the projected value of the air separation unit market by 2031?
The air separation unit market is expected to reach USD 8.08 billion by 2031.
Which end-user sector is expanding the fastest?
Electronics and semiconductor plants are growing at an 8.2% CAGR through 2031, the quickest among all sectors.
How large is cryogenic distillation within overall demand?
Cryogenic distillation captured 73.5% of 2025 revenue and remains the dominant process technology.
Why are semiconductor fabs building on-site gas plants?
Advanced nodes need 99.9999% purity argon and nitrogen, and dedicated on-site units eliminate contamination and trucking risks.
Which region will post the highest growth rate to 2031?
The Middle East and Africa region is set to record the fastest 6.6% CAGR, primarily due to large-scale hydrogen projects.
How do electricity costs affect project feasibility?
Power accounts for up to 70% of operating expense in cryogenic plants, so tariffs above USD 0.12/kWh require long-term take-or-pay contracts to secure financing.
Page last updated on:


