Dining Tables Market Size and Share
Market Overview
| Study Period | 2020 - 2031 |
|---|---|
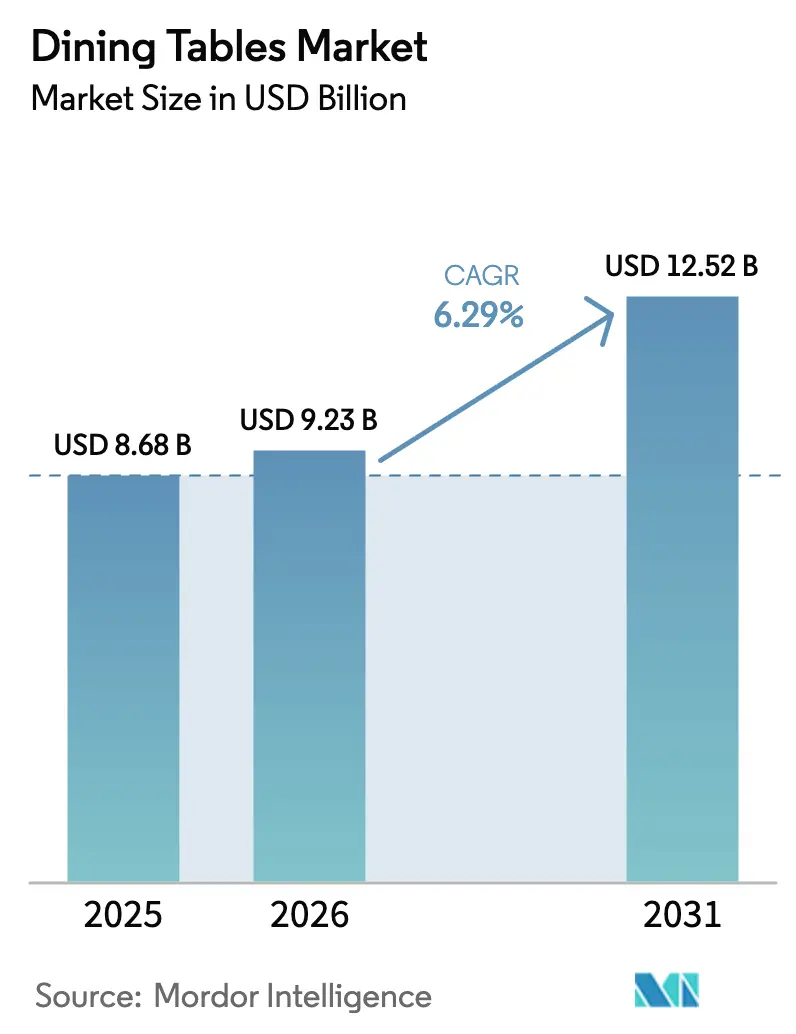
| Market Size (2026) | USD 9.23 Billion |
| Market Size (2031) | USD 12.52 Billion |
| Growth Rate (2026 - 2031) | 6.29% CAGR |
| Fastest Growing Market | Asia Pacific |
| Largest Market | Asia Pacific |
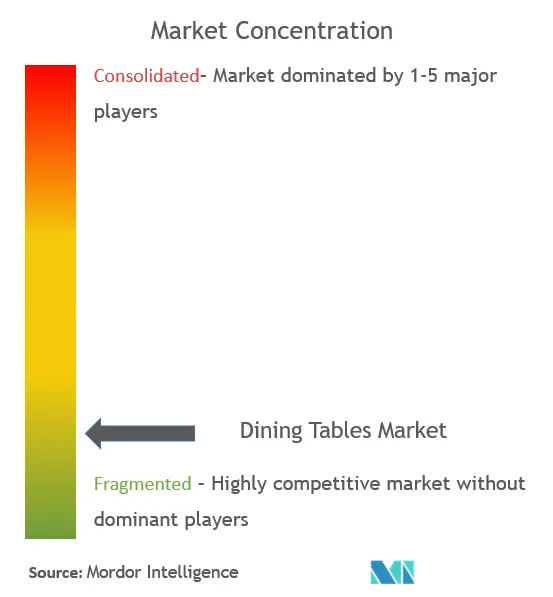
| Market Concentration | Low |
Major Players *Disclaimer: Major Players sorted in no particular order Image © Mordor Intelligence. Reuse requires attribution under CC BY 4.0. | |
Dining Tables Market Analysis by Mordor Intelligence
The dining table market size was valued at USD 8.68 billion in 2025 and estimated to grow from USD 9.23 billion in 2026 to reach USD 12.52 billion by 2031, at a CAGR of 6.29% during the forecast period (2026-2031). Robust demand for premium, multifunctional pieces and sustained home-improvement spending keep the dining table market on an upward path even as raw-material and freight inflation persists. Rapid urbanization in Asia-Pacific and expanding online retail access worldwide are enabling both volume growth and product mix upgrades. Meanwhile, sustainability credentials—particularly certified wood and low-VOC finishes—have shifted from niche differentiators to mainstream purchase criteria. Manufacturers are also capitalizing on 3D configuration and AR visualization tools that shorten consideration cycles and lift conversion, especially in secondary and tertiary cities.
Key Report Takeaways
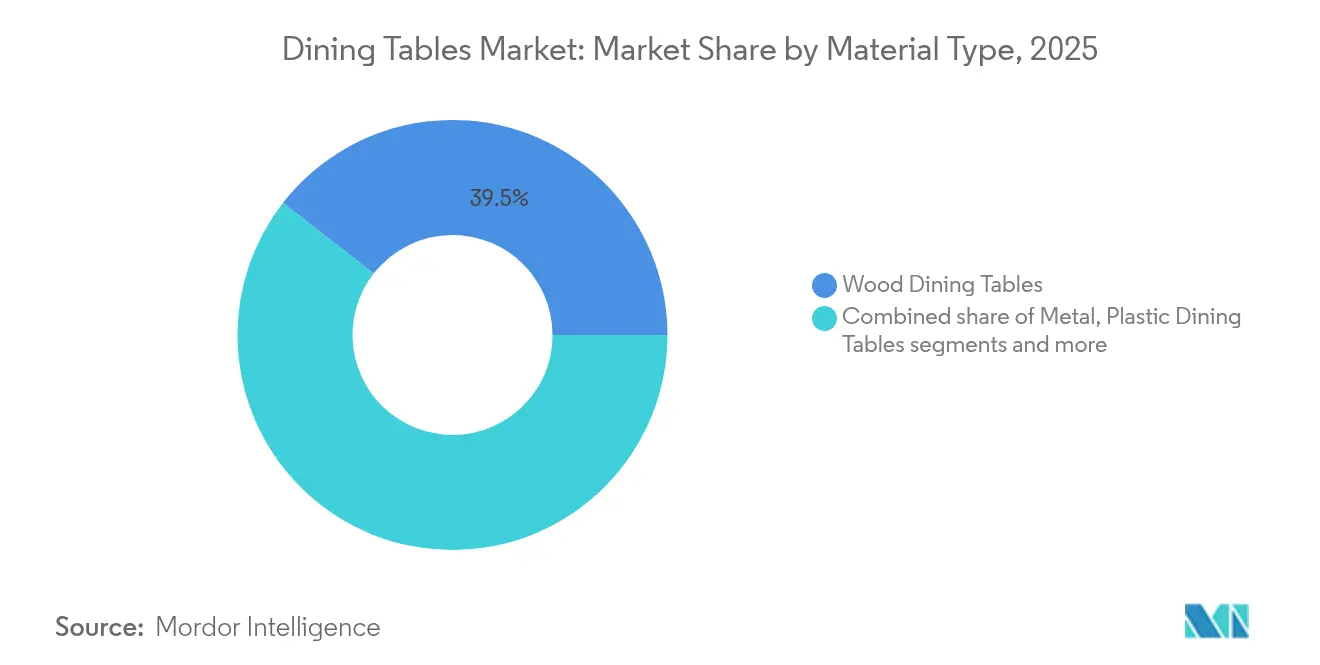
- By material type, wood maintained 39.45% of the dining table market share in 2025, while metal tables are projected to expand at a 6.44% CAGR through 2031.
- By shape, rectangular designs led with 44.20% revenue share in 2025; oval tables are advancing at a 6.72% CAGR to 2031.
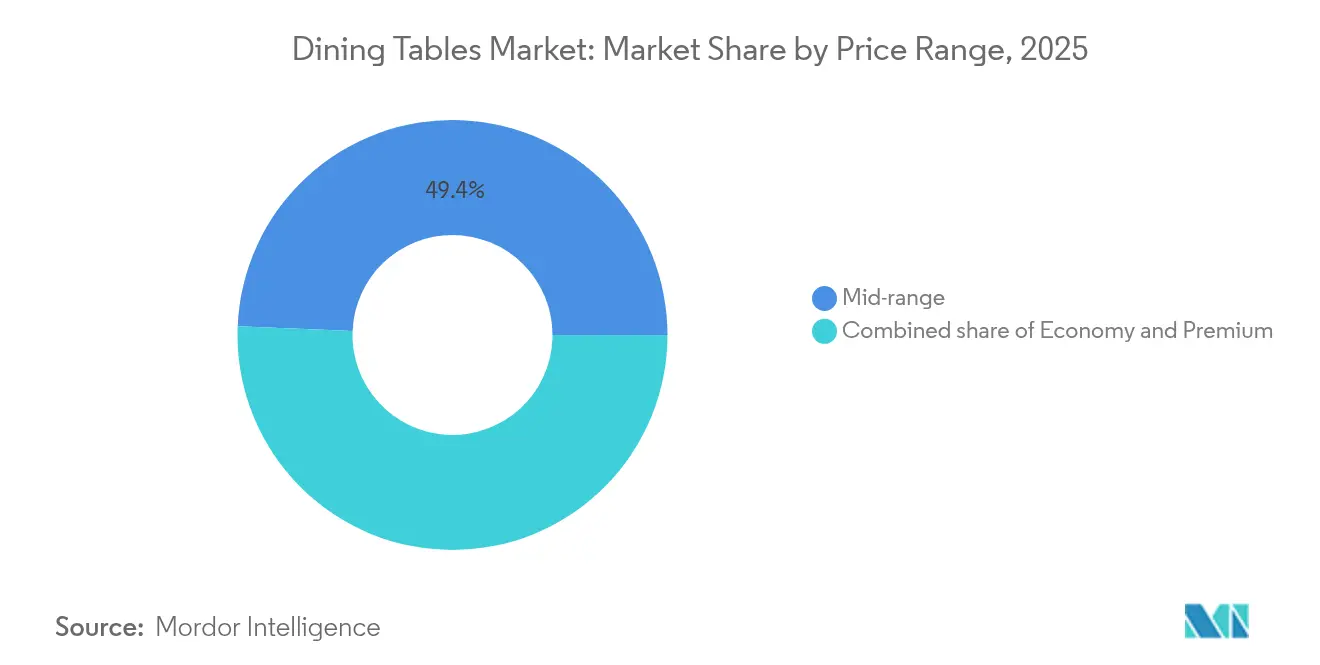
- By price range, the mid-range segment accounted for 49.35% of the dining table market size in 2025, whereas the premium tier is growing at a 7.01% CAGR.
- By distribution channel, specialty furniture stores held a 34.55% share in 2025, but online sales are forecast to rise at a 7.38% CAGR.
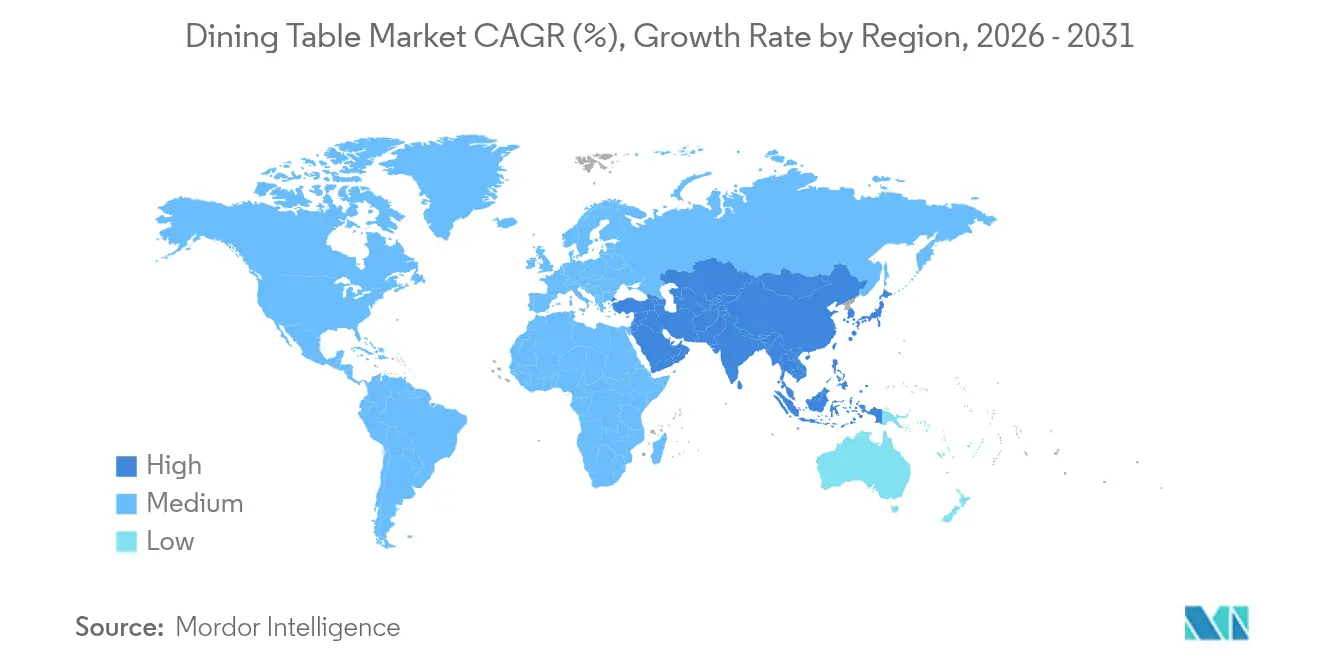
- By geography, Asia-Pacific captured 42.60% of the dining table market share in 2025 and is expected to sustain the fastest regional CAGR of 6.86% to 2031.
Note: Market size and forecast figures in this report are generated using Mordor Intelligence’s proprietary estimation framework, updated with the latest available data and insights as of 2026.
Global Dining Tables Market Trends and Insights
Drivers Impact Analysis*
| Driver | (~) % Impact on CAGR Forecast | Geographic Relevance | Impact Timeline |
|---|---|---|---|
| Shrinking urban living spaces are boosting demand for compact, extendable tables | +1.8% | Asia-Pacific, Europe | Medium term (2-4 years) |
| Online furniture retail penetration is accelerating market access | +1.5% | North America, Europe | Short term (≤ 2 years) |
| Rising preference for certified sustainable wood and low-VOC finishes | +1.2% | Europe, North America | Medium term (2-4 years) |
| Surge in home-improvement spending energizing residential dining purchases | +1.0% | North America, Asia-Pacific | Short term (≤ 2 years) |
| Mass customization and 3D configurators are elevating average selling prices | +0.7% | North America, Europe | Medium term (2-4 years) |
| Source: Mordor Intelligence | |||
Urban Living Spaces Shrinking Globally Driving Demand for Compact Extendable Dining Tables
The global trend toward urbanization is creating a structural shift in dining table preferences, with space optimization becoming a critical purchase criterion for urban consumers. Shoppers now search for dining pieces that fold, slide, or butterfly open only when more seats are needed, turning the extendable category into one of the fastest-moving segments. The smart designs that win combine smooth, one-person mechanisms with hidden leaves and under-top storage, so a two-seat setting can quickly host a party of eight without wobble or visual bulk. Adoption is most acute in Tokyo, Singapore, and Hong Kong, where shrinking floor areas amplify the value of furniture that transforms from daily to entertaining modes seamlessly.
Accelerating online furniture retail penetration across continents enhances market access
Online furniture shopping has come a long way. Shoppers can now spin a dining table in 3-D, drop it into a live AR view of their room, and see exactly how much space it leaves to walk around. These tools take the guesswork out of a big-ticket purchase, so return rates fall and confidence rises. Retailers that add AI on top go a step further, recommending pieces that match the buyer’s room size and style without endless scrolling. IKEA, Wayfair, and a growing list of peers already rely on this mix of 3-D visuals and AI suggestions, and it shows in higher conversion and happier customers. The payoff for shoppers is a broader choice: even those in small towns now have access to designs that once sat only in big-city showrooms.
Surge in home-improvement spending is fueling residential dining furniture
After the pandemic, households discovered the dining table doubles as a desk, classroom, and game station, and spending patterns still reflect that change. Homeowners are pouring money into makeovers, and dining rooms are cashing in on the trend. When people gut a kitchen or upgrade a bath, they often round out the project with a new table, chairs, or a sideboard that ties the look together. For instance, as of February 2025, United States furniture and home-furnishing retailers booked a 4% year-on-year sales lift, underlining steady investment in domestic comfort. Budgets earmarked for the dining area now sit well above pre-pandemic levels, reflecting how this space has morphed into a hybrid hub for meals, homework, and video calls.
Mass customization & 3D configurators globally elevating average selling prices
Digital product configurators enable buyers to select finishes, leg styles, and dimensions on demand, raising perceived value and enabling brands to command higher margins without commensurate inventory risk. The strongest uptake is evident in North America and Europe, where bespoke options are becoming mainstream within mid-to-premium price tiers.
Restraints Impact Analysis*
| Restraints | (~) % Impact on CAGR Forecast | Geographic Relevance | Impact Timeline |
|---|---|---|---|
| Volatile timber, steel, and freight costs are compressing manufacturer margins | -0.9% | Asia-Pacific, North America | Short term (≤ 2 years) |
| The growing popularity of kitchen islands & breakfast counters is reducing the need for separate tables | -0.7% | North America, Europe | Medium term (2-4 years) |
| A Fragmented, unorganized manufacturing base is intensifying price competition | -0.5% | Asia-Pacific, South America | Long term (≥ 4 years) |
| Source: Mordor Intelligence | |||
Volatility in timber, steel & freight costs is compressing global manufacturer margins
Timber prices swung up by 35% while steel moved by 28% during 2024, eroding profitability for lean-inventory producers. Although retail furniture prices fell 2.9% between October 2022 and October 2023, the Bureau of Labor Statistics shows 2025 household-furnishing price indices holding steady, indicating that many producers are absorbing volatility rather than passing it through.[1]Bureau of Labor Statistics, “Consumer Price Index – April 2025,” bls.gov This cost pressure accelerates investment in digital manufacturing and supply-chain optimization.
Highly fragmented, unorganized manufacturing base intensifying price competition worldwide
The prevalence of small-scale workshops—especially in Asia-Pacific and parts of Latin America—creates an oversupply of economy-priced tables, pressuring mid-tier brands to differentiate through design, sustainability, or service.
*Our forecasts treat driver/restraint impacts as directional, not additive. The impact forecasts reflect baseline growth, mix effects, and variable interactions.
Segment Analysis
By Material Type: Sustainability reshaping traditional preferences
Wood retained leadership with a 39.45% share of the dining table market in 2025, confirming its timeless appeal and compatibility with eco-labelling programs. Metal tables, buoyed by aluminum’s lightweight recyclability, are projected to lead growth at 6.44% CAGR, helping expand the dining table market size for contemporary urban consumers. Hybrid concepts blending wood and metal or stone address demand for visual interest and material authenticity. Innovations such as sand-cast aluminum legs paired with oak tops illustrate how durability and design can coexist while meeting rising sustainability expectations.
Material choices now reflect a wider sustainability calculus encompassing sourcing, production energy, and end-of-life recyclability. Manufacturers highlight FSC-certified lumber, recycled steel alloys, and waterborne finishes to secure a share in premium segments. The trend favors local sourcing to cut transport emissions, a strategy adopted by Chromcraft Revington Douglas to align operational efficiencies with environmental commitments. The dining table market continues to evolve toward materials that balance aesthetics, longevity, and ecological integrity, ensuring competitive relevance through 2031.


By Shape: Oval tables rising as space-efficiency champions
Rectangular products captured 44.20% of the dining table market share in 2025, yet oval tables are on track for the quickest expansion at 6.72% CAGR through 2031. Their corner-free geometry improves traffic flow in tight apartments, enhancing social interaction while matching rectangular seating capacity. Extendable variants such as Castlery’s Dillon, which expands from 74.8 to 110.2 inches, exemplify this shape’s adaptability to both daily meals and larger gatherings.
Round and square formats retain dedicated followings where intimacy or geometric symmetry is preferred. Innovations in transformation mechanisms permit more free-form designs, feeding consumer appetite for distinctive furniture statements. Oval and round profiles will keep gaining traction as lifestyles gravitate toward casual, multipurpose spaces.
By Price Range: The Premium segment defying economic headwinds
The mid-range commanded 49.35% of the dining table market size in 2025, but premium products will post the highest 7.01% CAGR to 2031. Affluent customers favor natural stone, porcelain stoneware, and sculptural wood bases that elevate décor while signaling status. Ceramic and teak root tables illustrate how artisanship and rare materials underpin luxury demand.
Direct-to-consumer brands now unlock “accessible luxury” by eliminating traditional retail mark-ups, satisfying aspirational buyers seeking bespoke finishes and verified sustainability attributes. Meanwhile, the economy tier remains relevant for first-time purchasers, though it faces the sharpest competition from flat-pack imports and unorganized local makers.
By Distribution Channel: Digital transformation reshaping purchase journeys
Specialty furniture stores secured 34.55% of sales in 2025, valued for tactile assurance and design consultation. Yet online platforms will deliver the fastest 7.38% CAGR, reshaping the path to purchase with immersive 3D visualization that places virtual tables into buyers’ rooms, shrinking the consideration phase and lowering return rates.
Home centers preserve a meaningful share by bundling furniture with broader home-improvement lines. Pop-up showrooms and maker-direct channels enrich omnichannel ecosystems, as evidenced by IKEA’s pop-up showcase at Fulton Market that pairs experiential retail with its expanding e-commerce footprint. Successful brands harmonize physical and digital touchpoints to capture research-online, purchase-offline behaviors endemic to high-involvement categories.
Geography Analysis
Asia-Pacific dominated with 42.60% of global revenue in 2025 and will keep the highest 6.86% CAGR, powered by urban apartment proliferation and rising disposable incomes. Chinese furniture sales climbed 11.7% in early 2025, confirming the region’s momentum. India is accelerating via omnichannel expansions by Godrej Interio and Wooden Street, while Southeast Asian cities—Singapore and Jakarta among them—amplify demand for compact, extendable pieces that resolve urban density challenges.
North America ranks second, buoyed by resilient consumer spending and an entrenched home-renovation culture. Stable 2025 CPI readings for household furnishings underscore pricing discipline amid input volatility. Multifunctional tables that toggle between dining and remote-work modes are particularly salient in U.S. suburbs, where flexible living spaces gained permanence post-pandemic.
Europe exhibits slower topline growth yet commands price premiums anchored in sustainability and design authority. Markets such as Germany and the UK increasingly reward verifiable eco-labels, encouraging domestic manufacturers to emphasize circular-economy credentials. The UK’s vibrant online furniture scene—propelled by retailers like John Lewis—confirms e-commerce’s central role in future sales expansion.
South America and the Middle East & Africa remain smaller but growing. Brazil leverages abundant native woods, while UAE and Saudi Arabia fuel premium sales tied to rising expat and tourist influxes.

Competitive Landscape
The dining table market is moderately fragmented. IKEA leads through vertically integrated scale and omnichannel reach, opening new stores even amid macro headwinds while rolling out circular-economy initiatives that elevate brand equity. Ashley Furniture anchors North American share via breadth and hybrid retail models, whereas Poliform and Ligne Roset dominate the premium end through Italian and French design heritage.
Customization, sustainability, and digital engagement now eclipse pure price competition. Castlery, a direct-to-consumer entrant, gained global visibility in 2025 for extendable tables that solve urban space constraints and meet mid-premium styling preferences. Technology is becoming a frontline differentiator: 3D and AR tools are migrating from novelty to necessity, forcing laggards to invest or cede share.
White-space opportunities emerge in eco-certified mid-price offerings, smart-furniture integration for connected homes, and region-specific designs. Scale leaders exploit supply-chain leverage to counter raw-material volatility, while niche artisans command premiums through craftsmanship narratives. Competitive dynamics will keep evolving as consumer priorities tilt toward personalization, ethical sourcing, and multipurpose functionality.
Dining Tables Industry Leaders
IKEA
Ashley Furniture Industries, Inc.
Yihua Lifestyle Technology Co. Ltd.
Dorel Industries Inc. (Dorel Home)
Sauder Woodworking Co.
- *Disclaimer: Major Players sorted in no particular order

Recent Industry Developments
- May 2025: IKEA opened multiple new stores worldwide, reinforcing its omnichannel growth thesis despite wider retail softness
- March 2025: Costco posted USD 62.53 billion in Q2 2025 net sales, up 9.1%, with furniture among the strongest performers
- March 2025: Castlery released a 2025-2030 sustainability roadmap aiming to divert 60% of furniture waste from landfills by 2026


Research Methodology Framework and Report Scope
Market Definitions and Key Coverage
Our study defines the dining tables market as the sale value of all newly manufactured tables whose primary purpose is to serve meals within households or commercial dining spaces, irrespective of material, shape, price tier, or distribution channel.
Accessories, second-hand items, outdoor-only furniture, and bundled dining room sets that cannot be cost-split at table level are excluded from the sizing scope.
Segmentation Overview
- By Material Type
- Wood Dining Tables
- Metal Dining Tables
- Plastic Dining Tables
- Others (Stone,Glass, Plastic & Composite, etc.)
- By Shape
- Rectangular
- Round
- Square
- Oval
- Others (Extendable, Freeform)
- By Price Range
- Economy
- Mid-range
- Premium
- By Distribution Channel
- Home Centers
- Specialty Furniture Stores
- Online
- Other Distribution Channels
- By Geography
- North America
- Canada
- United States
- Mexico
- South America
- Brazil
- Peru
- Chile
- Argentina
- Rest of South America
- Europe
- United Kingdom
- Germany
- France
- Spain
- Italy
- BENELUX (Belgium, Netherlands, and Luxembourg)
- NORDICS (Denmark, Finland, Iceland, Norway, and Sweden)
- Rest of Europe
- Asia-Pacific
- India
- China
- Japan
- Australia
- South Korea
- South East Asia (Singapore, Malaysia, Thailand, Indonesia, Vietnam, and Philippines)
- Rest of Asia-Pacific
- Middle East And Africa
- United Arab of Emirates
- Saudi Arabia
- South Africa
- Nigeria
- Rest of Middle East And Africa
- North America
Detailed Research Methodology and Data Validation
Primary Research
Multiple structured discussions and email surveys with furniture makers, specialty retailers, online marketplace category heads, and procurement managers across North America, Europe, and Asia-Pacific validate shipment volumes, average selling prices, emerging material mixes, and online penetration levels that secondary data only hint at. Follow-up calls are scheduled whenever early findings diverge beyond an internal variance band.
Desk Research
We begin with published datasets that anchor demand and supply: monthly US Census furniture retail sales, Eurostat production indices, UN Comtrade trade codes for wood and metal tables, and housing completion statistics from bodies such as HUD and China's National Bureau of Statistics.
Company 10-Ks, retailer investor decks, and national trade association briefs (for example, the American Home Furnishings Alliance) supply price movement signals and segment shares.
Subscription platforms within Mordor Intelligence, Dow Jones Factiva for deal flows, and D&B Hoovers for manufacturer revenues round out baseline evidence.
The sources cited above illustrate, not exhaust, the breadth of secondary inputs our analysts draw upon.
Market-Sizing & Forecasting
We frame a top-down demand pool that starts with country-level household counts, new housing completions, and restaurant outlet numbers, which are then multiplied by furniture ownership or replacement rates gleaned from our interviews.
Supplier roll-ups and sampled ASP-times-unit checks provide a bottom-up reasonableness screen before totals are finalized.
Key market fingerprints, online furniture sales ratio, wood-to-metal mix shifts, average replacement cycle, and disposable income per household feed a multivariate regression that projects value through 2030 under base, upside, and downside scenarios.
Data gaps, for instance, opaque craft workshops, are bridged using regional proxies scaled by income differentials and validated with local experts.
Data Validation & Update Cycle
Outputs pass three layers of analyst review, variance tests against independent furniture and timber price series, and peer sign-off.
Reports refresh annually, with interim updates triggered by material events such as tariff swings or raw-material shocks. A final data sweep occurs immediately before client delivery.
Why Mordor's Dining Tables Market Baseline Remains the Dependable Standard
Published figures often differ because firms choose distinct product baskets, channels, or currency bases.
Our disciplined scope setting, yearly refresh, and two-way reconciliation with industry voices place Mordor Intelligence at the center of dependable decision support.
Benchmark comparison
| Market Size | Anonymized source | Primary gap driver |
|---|---|---|
| USD 8.68 B (2025) | Mordor Intelligence | - |
| USD 8.22 B (2024) | Global Consultancy A | Excludes metal and plastic tables; Europe skewed base year mix |
| USD 7.58 B (2024) | Research Firm B | Omits commercial/contract channel; infers value from broad furniture ratios |
| USD 15.00 B (2025) | Trade Journal C | Bundles chairs, sideboards, and full dining sets, inflating totals |
The comparison shows that differences stem mainly from scope breadth and input quality, while our analysts keep variables transparent and update cadence tight, giving buyers a balanced baseline they can trace and replicate with confidence.


Key Questions Answered in the Report
What is the current size of the dining table market?
The dining table market size is USD 9.23 billion in 2026.
How fast is the dining table market expected to grow?
The market is forecast to expand at a 6.29% CAGR, reaching USD 12.52 billion by 2031.
Which region leads the dining table market?
Asia-Pacific holds 42.60% of global revenue and is projected to grow the fastest at 6.86% CAGR.
Which material segment is growing quickest?
Metal dining tables are set to post a 6.44% CAGR from 2026 to 2031 due to durability and modern aesthetics.
How is online retail influencing dining table sales?
E-commerce channels are increasing at a 7.38% CAGR, aided by 3D visualization and AR tools that lower return rates.
Why are extendable dining tables gaining popularity?
Shrinking urban living spaces make multifunctional, space-efficient designs appealing, propelling extendable tables to a 6.05% CAGR through 2031.
Page last updated on:


