
Dimethyl Terephthalate (DMT) Market Size and Share
Market Overview
| Study Period | 2021 - 2031 |
|---|---|
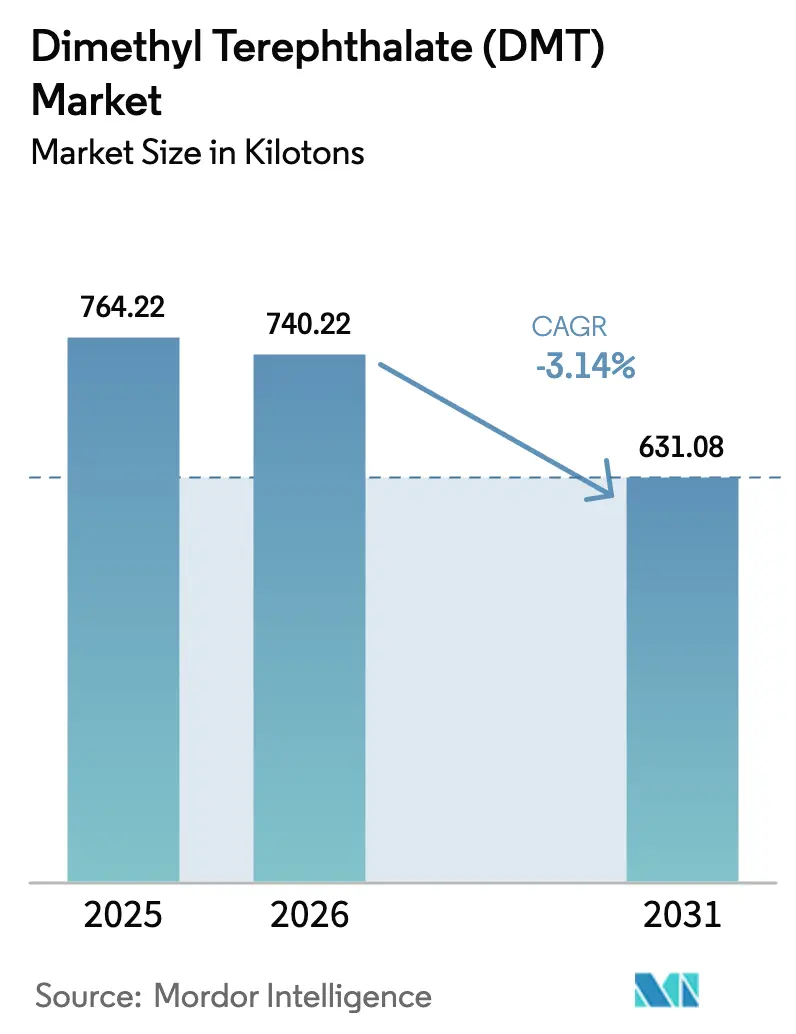
| Market Volume (2026) | 740.22 kilotons |
| Market Volume (2031) | 631.08 kilotons |
| Growth Rate (2026 - 2031) | -3.14 % |
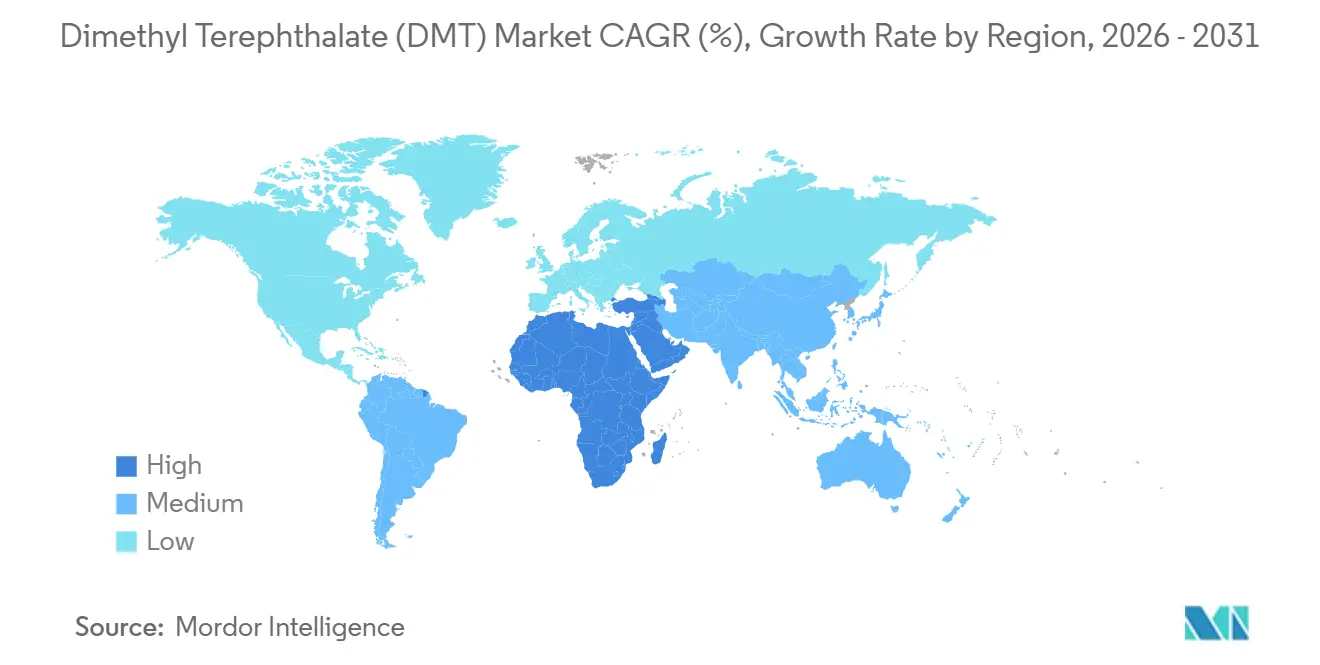
| Fastest Growing Market | Middle East and Africa |
| Largest Market | Asia Pacific |
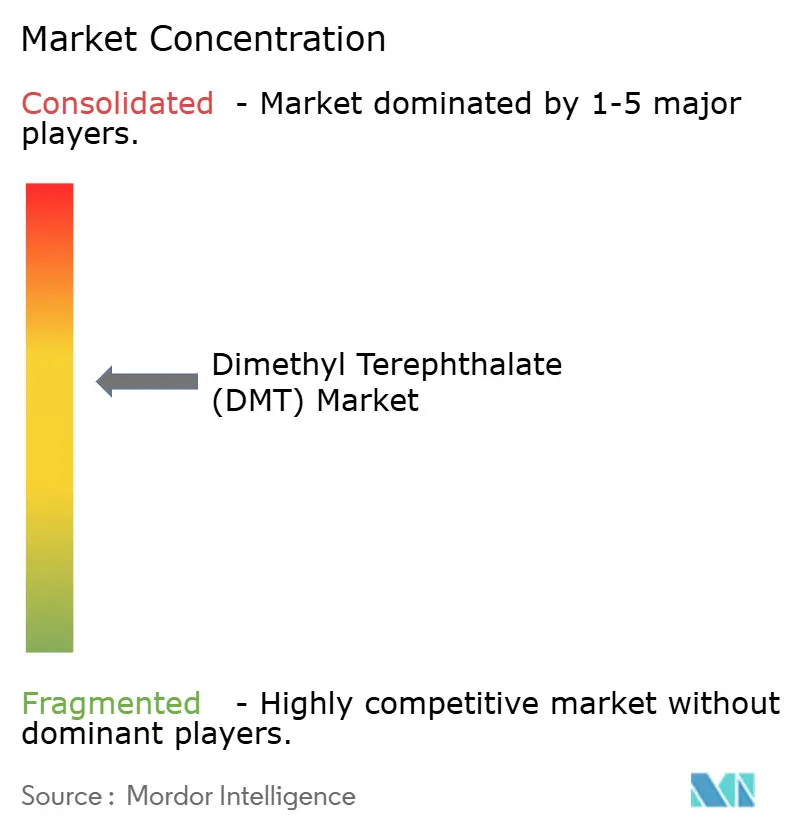
| Market Concentration | Medium |
Major Players *Disclaimer: Major Players sorted in no particular order Image © Mordor Intelligence. Reuse requires attribution under CC BY 4.0. | |
Dimethyl Terephthalate (DMT) Market Analysis by Mordor Intelligence
The Dimethyl Terephthalate Market size is expected to decline from 764.22 kilotons in 2025 to 740.22 kilotons in 2026 and is forecast to reach 631.08 kilotons by 2031 at -3.14% CAGR over 2026-2031. High operating costs in Europe, the commissioning of mega-scale PTA units in China, and volatile methanol prices continue to erode demand, yet chemical-recycling investments and niche copolymer applications keep a floor under volume loss. Asia-Pacific remains the largest demand center, North America pivots toward circular DMT via methanolysis, and Europe searches for competitiveness through low-carbon energy and possible CBAM protection. Competitive intensity is moderate as legacy plants close, integrated polyester chains consolidate, and innovators channel capital into recycled or bio-attributed intermediates. As a result, the dimethyl terephthalate market navigates a dual narrative of structural decline in virgin demand and selective resilience in circular value chains.
Key Report Takeaways
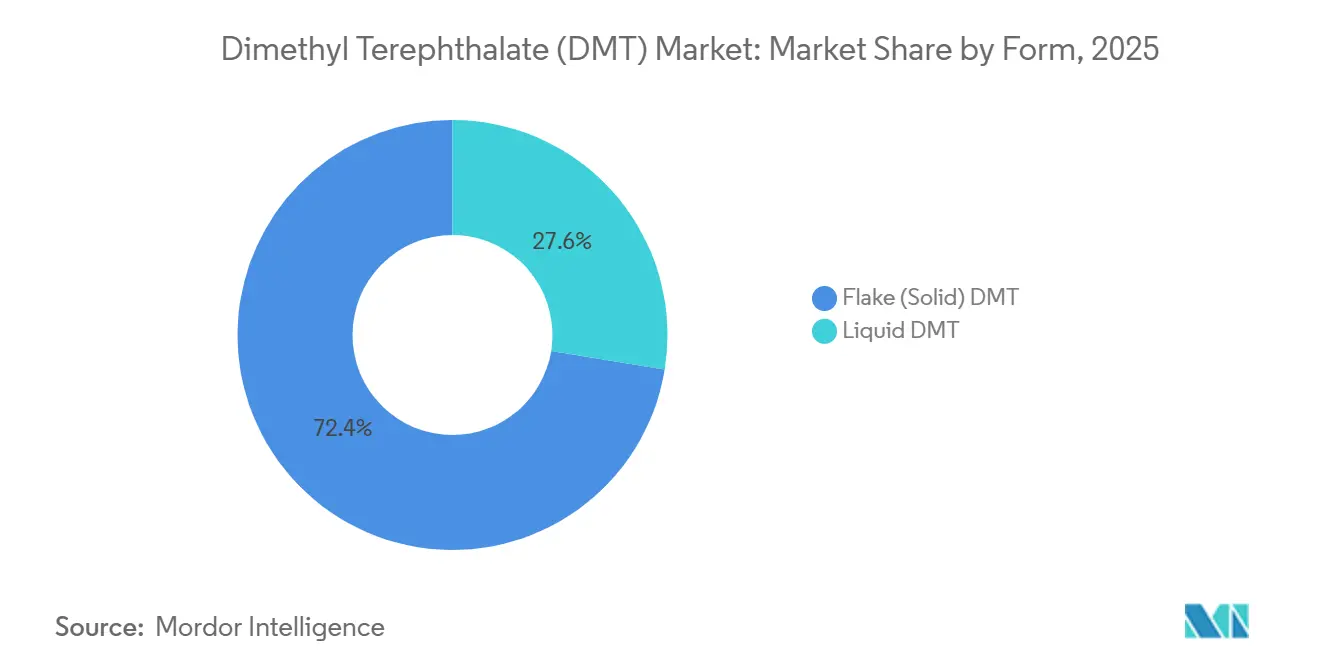
- By form, flake solid captured 72.44% of dimethyl terephthalate market share in 2025 and is contracting at a –2.43% CAGR through 2031.
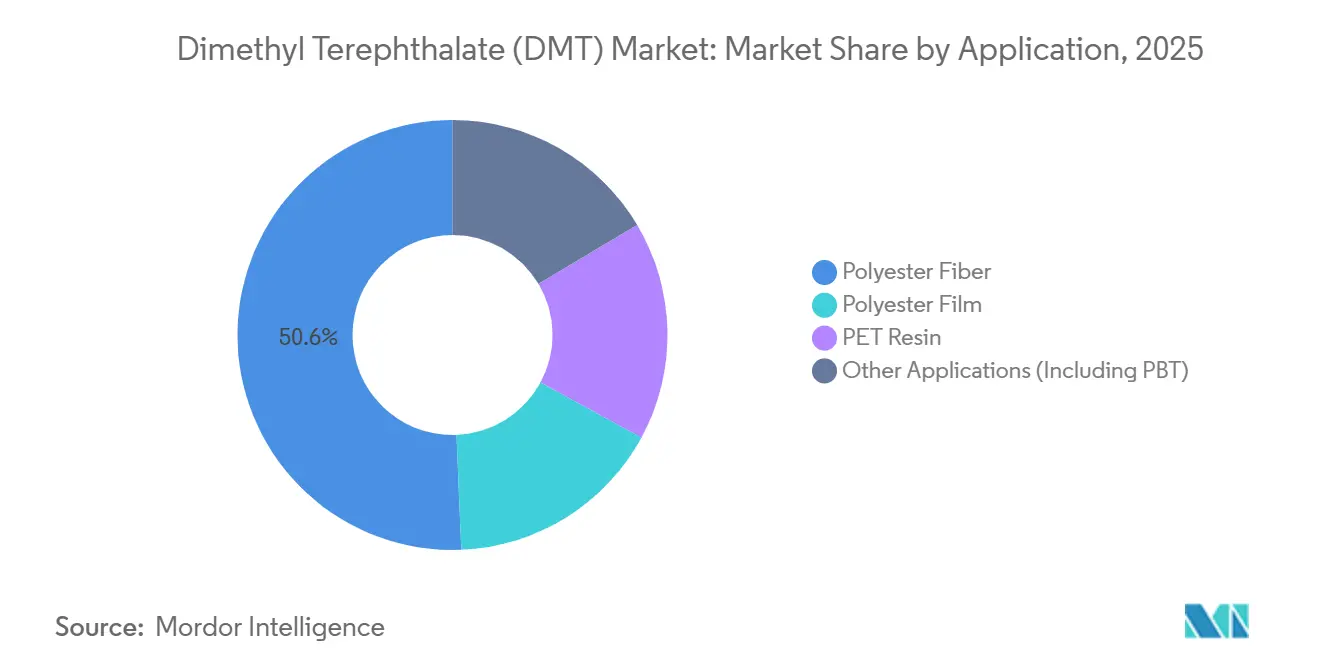
- By application, polyester fiber held 50.65% of the dimethyl terephthalate market size in 2025, while PET resin records the least negative CAGR at -1.95% through 2031.
- By geography, Asia-Pacific retained 51.85% revenue share of the dimethyl terephthalate market in 2025; the Middle East and Africa represents the least negative regional trajectory at –1.72% CAGR to 2031.
Note: Market size and forecast figures in this report are generated using Mordor Intelligence’s proprietary estimation framework, updated with the latest available data and insights as of January 2026.
Market Trends and Insights
Drivers Impact Analysis of Dimethyl Terephthalate (DMT) Market*
| Driver | (~) % Impact on CAGR Forecast | Geographic Relevance | Impact Timeline |
|---|---|---|---|
| PET and PBT Demand Resurgence | +0.8% | Asia-Pacific, North America | Medium term (2-4 years) |
| Polyester-Fibre Consumption in Asia | +0.6% | Asia-Pacific (China, India, ASEAN) | Short term (≤ 2 years) |
| Packaging-Light-Weighting Initiatives | +0.4% | Global, with leadership in North America and EU | Medium term (2-4 years) |
| Chemical-Recycling Routes Supplying r-DMT | +0.5% | North America, Europe, spill-over to Asia-Pacific | Long term (≥ 4 years) |
| EU Carbon-Border-Pricing Favouring Local DMT | +0.3% | Europe, indirect effects on Asia-Pacific exports | Long term (≥ 4 years) |
| Source: Mordor Intelligence | |||
PET and PBT Demand Resurgence
PET packaging demand is stabilizing as brand owners adopt circular-content targets, while PBT gains volume in automotive connectors that require flame-retardant precision molding. Eastman’s partnership with Rumpke guarantees 100% of opaque and colored PET waste as feedstock for its Kingsport molecular-recycling unit, exemplifying how circular loops underpin PET stability. Incremental PET growth partially offsets resin intensity lost to lightweighting, preserving feedstock pull for DMT-based intermediates in specialty films. In tandem, PBT’s specification wins in electric-vehicle architectures create niche opportunities for DMT copolymer chemistry. Together, these trends add a modest 0.8 percentage-point uplift to the dimethyl terephthalate market CAGR.
Polyester-Fiber Consumption in Asia
China’s polyester plants ran at 90% utilization in May 2025 as apparel exports rebounded, while India and ASEAN nations ramped spinning capacity to capture near-shoring orders. Smaller trans-esterification units in these regions still rely on DMT because retrofit capital for PTA direct-esterification is scarce. Nevertheless, headline PTA mega-projects under construction in Jiangsu, Zhejiang, and Fujian will widen the cost gap, steadily siphoning feedstock away from DMT. The dichotomy between high-volume PTA fiber and DMT’s foothold in smaller mills results in a 0.6 percentage-point CAGR cushion that is unlikely to reverse the long-run decline.
Packaging Lightweighting Initiatives
Global brand owners cut average PET bottle weight and boost recycled content, a move that trims absolute resin demand yet raises quality specifications. Molecular-recycling platforms that revert post-consumer PET to monomers supply virgin-grade polymer meeting food-contact standards, sustaining demand for r-DMT intermediates. Eastman’s Normandy facility secured offtake covering 80% of Phase 1 capacity before mechanical completion, validating market appetite for circular feedstock. Lightweighting therefore shifts the revenue mix towards value-added recycled DMT rather than virgin tonnage, delivering a 0.4 percentage-point positive impact on the dimethyl terephthalate market trajectory.
Chemical-Recycling Routes Supplying r-DMT
Methanolysis converts waste polyester to dimethyl terephthalate and ethylene glycol, enabling closed-loop packaging solutions. The Kingsport plant, designed for 110 000 t per year, is forecast to add USD 75 million incremental EBITDA in 2024, and Eastman is negotiating U.S. DOE support for a similarly sized Longview unit. Teijin Frontier’s BHET catalyst offers an energy-efficient alternative, broadening geographic adoption potential. As collection networks mature, recycled DMT could displace a portion of virgin feedstock, lifting the long-term dimethyl terephthalate market growth curve by 0.5 percentage points.
Restraints Impact Analysis of Dimethyl Terephthalate (DMT) Market*
| Restraint | (~) % Impact on CAGR Forecast | Geographic Relevance | Impact Timeline |
|---|---|---|---|
| Cost Advantage of PTA Over DMT | -2.1% | Global, most pronounced in Asia-Pacific | Short term (≤ 2 years) |
| Volatile P-Xylene and Methanol Pricing | -1.3% | Global, acute in Asia-Pacific and North America | Short term (≤ 2 years) |
| Tightened Methanol VOC Regulations | -0.6% | North America, Europe, emerging in China | Medium term (2-4 years) |
| Source: Mordor Intelligence | |||
Cost Advantage of PTA Over DMT
Single-train PTA plants exceeding 3 million t per year deliver unbeatable unit costs, pushing DMT routes to the margin. Sinopec’s Jiangsu complex exemplifies this scale economy, while Teijin realized JPY 17.5 billion operating-income gains after mothballing internal DMT capacity. The relentless PTA cost edge removes 2.1 percentage points from the dimethyl terephthalate market CAGR despite recycled-content tailwinds.
Tightened Methanol VOC Regulations
U.S. EPA rule 40 CFR 60.112c mandates vapor-recovery systems for methanol storage, requiring multi-million-dollar retrofits. Similar policies appear in the EU Industrial Emissions Directive updates and select Chinese provinces. Compliance costs penalize smaller esterification units, encouraging consolidation into larger, emission-controlled assets. These upgrades impose a -0.6 percentage-point drag on the dimethyl terephthalate market outlook.[1]United States Environmental Protection Agency, “National Emission Standards for Storage Vessels,” epa.gov .
*Our forecasts treat driver/restraint impacts as directional, not additive. The impact forecasts reflect baseline growth, mix effects, and variable interactions.
Dimethyl Terephthalate (DMT) Market Segment Analysis
By Form:
Solid Flake Maintains Logistics AdvantageSolid-flake product commanded 72.44% of dimethyl terephthalate market share in 2025 and is projected to shrink at a -2.43% CAGR through 2031, outperforming liquid grades. Lower vapor pressure minimizes VOC losses, and flake moves conveniently in railcars and FIBC bulk bags, reinforcing its role in smaller polyester mills that lack molten-feed systems. Liquid DMT, in contrast, incurs higher freight and safety costs, limiting uptake to integrated complexes where direct piping eliminates packaging steps. As recycled DMT capacity ramps, crystallization loops inherently yield solid output, further anchoring flake’s predominance. However, even flake volumes ultimately contract alongside PTA substitution, leaving the segment to stabilize only if methanolysis achieves scale by 2028. In that scenario, the dimethyl terephthalate market size for solid flake could plateau near 450 kilotons.
Liquid grades face steeper declines because new PTA lines eradicate adjacent molten-feed demand. Regulatory scrutiny of hot-melt storage tanks raises capex hurdles, while logistics providers seek to retire aging heated-tank fleets. Producers with dual-form capability increasingly tilt output toward flake for spot sales, relegating liquid DMT to captive polymerization back-integration. Given these dynamics, liquid’s share is expected to fall by 2031, cementing flake as the default trans-esterification feed even in a shrinking dimethyl terephthalate market.



By Application:
Fiber Still Leads, Resin Decline ModeratesPolyester fiber accounted for 50.65% of the dimethyl terephthalate market in 2025, yet the segment will continue to lose ground as high-volume Chinese spinning lines favor PTA direct esterification. Smaller mills in India, Vietnam, and Pakistan, lacking retrofit capital, preserve residual DMT demand but cannot offset attrition at scale. PET resin, conversely, contracts at the slowest pace, posting a -1.95% CAGR, aided by brand commitments to circular packaging. Molecular-recycling plants using methanolysis route DMT back into bottle-grade polymer, slowing virgin-feed erosion.
Specialty polyester film and polybutylene terephthalate capture smaller volume yet present differentiated growth profiles. Film demand erodes due to polypropylene competition in flexible packaging, while PBT benefits from electrification and miniaturization trends in vehicles and consumer electronics. Although PBT adds incremental tonnage, the absolute base remains modest, limiting material impact on total dimethyl terephthalate market momentum. Ultimately, application diversification slows but does not arrest the overall contraction trajectory.
Geography Analysis
APAC Dimethyl Terephthalate (DMT) Market
Asia-Pacific retained 51.85% of dimethyl terephthalate market share in 2025, driven by entrenched polyester fiber clusters across China, India, and Southeast Asia. Mega PTA build-outs along China’s east coast are displacing DMT feed, yet pockets of trans-esterification persist where mills operate legacy lines or consume recycled flake from domestic methanolysis pilots. India shows resilience as mid-scale players defer capital-intensive PTA retrofits, keeping an addressable DMT pool alive. Emerging recycling projects in Indonesia and Thailand could also regenerate local demand, although timelines beyond 2028 remain tentative. Collectively, these factors deliver the highest absolute volume but contribute materially to the dimethyl terephthalate market decline.
North America Dimethyl Terephthalate (DMT) Market
North America hosts limited virgin DMT capacity but has become the epicenter of chemical recycling, anchored by Eastman’s Kingsport and planned Longview sites. These plants convert mixed-color PET waste into r-DMT, supplying food-contact resin and specialty copolymers. Methanol supply, however, remains tight after recurring outages along the Gulf Coast, exposing operators to feedstock spikes. Canada and Mexico rely on imports, primarily from the United States and occasional Asia-Pacific spot cargoes, with logistics costs influencing arbitrage decisions.
Europe Dimethyl Terephthalate (DMT) Market
Europe experienced the sharpest structural retreat after Indorama announced intentions to shutter its Rotterdam PTA-PET complex. Oxxynova’s German DMT plant closure in 2022 further depleted regional output. Yet Europe also pioneers regulatory levers that may eventually shield local DMT segments. The prospective CBAM expansion to organic chemicals, together with anti-dumping duties on Chinese PET, could grant residual producers a niche competitive window. Eastman’s Normandy project leverages renewable electricity and proximity to feedstock suppliers, embodying a model where European dimethyl terephthalate market participants can still thrive by combining green energy, circular feed, and specialty grades.
MEA and South America Dimethyl Terephthalate (DMT) Market
South America and the Middle East and Africa remain small but strategically important. Middle East PTA additions, supported by low-cost feedstock, generate modest DMT pull for specialty polyester copolymers. Africa’s nascent packaging sector imports bottle-grade resin from Gulf suppliers, occasionally sourcing DMT for local PBT compounding. Brazil, Argentina, and neighboring markets in South America lack domestic DMT assets; they depend on Asia-Pacific shipments, leaving volumes sensitive to freight swings and currency depreciation.

Regulatory Landscape
Dimethyl terephthalate (DMT, CAS 120-61-6) is governed primarily through chemical registration and product-stewardship frameworks tied to downstream polyester and packaging use. In the EU, DMT is registered under REACH via the European Chemicals Agency (ECHA), which frames requirements for hazard data, safe-use communication, and supply-chain compliance for importers and manufacturers handling DMT in intermediate and downstream applications.
Trade and handling rules also shape cost and logistics. In the United States, DMT is listed under the 2026 Harmonized Tariff Schedule (HTS 2917.37.00.00) with a general duty rate of 6.5% (with preferential rates for certain FTA partners), influencing sourcing decisions for import-reliant buyers. For transport and storage, molten DMT is classified as a dangerous good (UN 3256, Class 3, Packing Group III) under regimes such as ADR/RID/IMDG, which raises requirements for heated tanks, labeling, and carrier selection. In packaging-linked end uses, DMT is included in the FDA inventory of food contact substances (21 CFR context), supporting use in compliant PET value chains where monomer purity and traceability are critical.
Value Chain Analysis
The DMT value chain starts with upstream aromatics and alcohol inputs, mainly p-xylene (PX) and methanol, followed by oxidation and esterification to produce DMT, commonly via established industrial routes such as the Witten-Hercules process. Cost and availability of PX and methanol stay pivotal because DMT economics compete directly with the PTA route in bulk polyester, limiting standalone DMT to niches where trans-esterification legacy assets or higher-purity monomer requirements still matter.
Midstream, DMT is marketed as solid flake or liquid (molten) and distributed by bag, railcar, or heated bulk logistics depending on form and distance. Downstream, demand concentrates in polyester fiber, PET resin, polyester film, and other applications including PBT, with a growing circular sub-chain via methanolysis that converts post-consumer PET back into r-DMT and ethylene glycol. Trade flows point to an internationally traded market with a specialty lean, with 2024 global DMT trade at about USD 132 million and exporting hubs including South Korea, Germany, and the UAE, supporting import-based procurement in regions without competitive virgin capacity.
Competitive Landscape
Market concentration is moderate, with fewer than 10 producers controlling a majority of capacity, yet the roster is shrinking. Teijin exited internal DMT output in 2015 and reallocated capital toward PTA procurement, unlocking significant cost savings[2]Teijin Limited, “Polyester chain consolidation yields cost savings,” teijin.com . Indorama’s Rotterdam withdrawal highlights rationalization in high-cost regions, while Oxxynova’s German shutdown underscores limited standalone competitiveness. Asian conglomerates such as Sinopec have largely pivoted to PTA megaprojects, leaving only niche or captive DMT operations in place.
Eastman spearheads a recycling-centric strategy, committing more than USD 2.25 billion to three molecular-recycling lines that collectively exceed 400 000 t per year of capacity. These plants will generate r-DMT and BHET for circular polymers, targeting premium customers willing to pay for low-carbon content. Several Japanese and South Korean conglomerates explore similar depolymerization, though most remain at pilot scale.
Smaller Indian and ASEAN companies sustain regional presence by serving polyester mills that still run trans-esterification units. Their survival hinges on flexible feedstock procurement, low overheads, and selective upgrades to meet tightening VOC rules. Niche European suppliers focus on pharmaceutical-grade and high-purity DMT, leveraging stringent quality norms and short supply chains. Across the board, integration into downstream polyester or upstream methanol offers a defensive moat, as standalone merchant producers face margin compression and stricter environmental compliance.
Dimethyl Terephthalate (DMT) Industry Leaders
Eastman Chemical Company
SASA
OXXYNOVA GmbH
SK chemicals
Mogilevkhimvolokno
- *Disclaimer: Major Players sorted in no particular order
Dimethyl Terephthalate (DMT) Market Companies Covered in this Report
- Aadhunik Industries
- Capot Chemical Co., Ltd.
- Eastman Chemical Company
- Fiber Intermediate Products Company
- Jinan MTL Chemical Co., Ltd.
- Loop Industries
- Mogilevkhimvolokno
- Nanjing Ningshengyang Chemical Co., Ltd.
- Nova International
- OXXYNOVA GmbH
- Reliance Industries Limited
- Sarna Chemicals
- SASA
- SK chemicals
- Teijin Limited
- Yangzhou Juhechang Technology Co., Ltd

Market Opportunities and Future Outlook
The clearest whitespace in the DMT market centers on circular and high-purity positioning rather than direct substitution against PTA. Chemical-recycling routes that regenerate r-DMT (through methanolysis of waste PET) provide a route to monomer-grade feedstock suited to food-contact and specialty polymer specifications, which aligns with brand-owner recycled-content commitments and helps buyers secure traceable circular inputs. This is reflected in announced r-DMT supply-chain commitments, including Loop Industries offtake activity for 100% recycled DMT tied to a planned Infinite Loop India facility that targets automotive and specialty polymer applications.
On cost and competitiveness, opportunities focus on improving unit economics and meeting tighter handling and emissions constraints. Process upgrades that reduce purification energy, including melt crystallization technologies highlighted by DODGEN, support production of higher-purity DMT grades while reducing the operating penalty versus legacy distillation-heavy approaches. Regional price dispersion also supports localized supply strategies and contract structures in higher-cost markets, as spot indications cited in June 2026 showed wide separations between China, the United States, and Europe, driving buyers to redesign supply chains around logistics, tariffs, and molten-handling compliance burdens.
Recent Industry Developments in Dimethyl Terephthalate (DMT) Market
- June 2026: Regional spot indications for industrial DMT highlighted a wide price gap across major markets, with much higher levels cited in Europe than in China and the United States. This dispersion reinforced the importance of trade terms, logistics, and compliance costs in procurement decisions, and it sharpened the incentive for buyers to qualify alternative sources such as recycled-mononer supply where available.
- September 2025: Loop Industries announced an offtake agreement with Taro Plast S.p.A. to supply 100% recycled dimethyl terephthalate (Loop DMT) from its planned Infinite Loop India facility. The agreement linked recycled monomer output to automotive and specialty polymer use cases, strengthening the commercial case for r-DMT pathways that compete on circularity and purity rather than bulk cost.
- March 2024: Loop Industries and Ester Industries Ltd. announced a joint venture to establish an Infinite Loop manufacturing facility in India to produce recycled DMT using depolymerization technology. The move positioned India as a potential r-DMT production base and added momentum to methanolysis-led circular value chains that can supply monomer-grade feedstock from post-consumer PET.


Dimethyl Terephthalate (DMT) Market Report Scope and Research Methodology
Market Definition and Coverage
For this methodology, the market covers dimethyl terephthalate (DMT) sold as a chemical intermediate and tracked in physical volume, covering flake (solid) and liquid forms that move into polyester-related applications.
Scope exclusions: This sizing excludes downstream finished polyester and PET products and any value added beyond DMT production and sales.
Segments Covered in This Report
- By Form
- Flake (Solid) DMT
- Liquid DMT
- By Application
- Polyester Fiber
- Polyester Film
- PET Resin
- Other Applications (Including PBT)
- By Geography
- Asia-Pacific
- China
- India
- Japan
- South Korea
- ASEAN Countries
- Rest of Asia-Pacific
- North America
- United States
- Canada
- Mexico
- Europe
- Germany
- United Kingdom
- France
- Italy
- NORDIC Countries
- Rest of Europe
- South America
- Brazil
- Argentina
- Rest of South America
- Middle East and Africa
- Saudi Arabia
- South Africa
- Rest of Middle-East and Africa
- Asia-Pacific
Data Sources, Market Sizing, and Validation
Desk Research
Desk research is used to set the basic market boundaries and to anchor the demand pool in real world production and trade signals. We rely on public sources such as UN Comtrade for DMT and related chemical trade flows, USGS style minerals and materials statistics where relevant to feedstocks, and government customs releases that show import and export trends by region.
We also reviewed technical publications and standards bodies, plus open patent databases to understand process shifts that can change DMT routes versus purified terephthalic acid. Company annual reports, investor presentations, and reputed press were used to map capacity announcements, shutdowns, and utilization comments, which then guided the assumptions used in the model. Where needed, we used paid subscriptions for company financials and intelligence, news and financials, and shipment level import and export databases to cross-check volumes and timing. These sources are illustrative only, and many other public references were used for validation and clarification during the study.
Primary Interviews and Surveys
Primary work was used to test what desk research cannot always show clearly, especially DMT route choices, plant operating rates, and where end users are still specifying DMT versus switching to PTA based polyester routes. We spoke with a mix of producers, traders, and polyester value chain participants across APAC, EMEA, and the Americas so that regional supply dynamics and consumption pockets were not missed, and then we adjusted assumptions only when multiple inputs pointed in the same direction.
Distribution of primary research fieldwork respondents
| Company type | Respondent position | Region |
|---|---|---|
| Top tier: 29% | CXOs: 18% | APAC: 46% |
| Mid tier: 53% | Functional/Unit leaders: 37% | EMEA: 30% |
| Smaller Players: 18% | Managers: 45% | Americas: 24% |
Market-Sizing & Forecasting
The core sizing is built using a top-down approach where production and trade data reconstruct the available DMT supply by region, which is then balanced against application demand signals. After that, we check the results using selective bottom-up approximations, such as sampled producer capacity roll ups, channel checks, and volume-by-application splits shared by industry participants, so the totals do not drift away from what the market can physically deliver.
Key inputs in the model include DMT operating rates and effective capacity, regional net trade position, substitution pressure from PTA based polyester routes, methanol price volatility as it affects DMT economics, and polyester fiber and film output trends that act as pull indicators. For forecasting, we used scenario analysis supported by expert consensus, because the market direction depends heavily on plant closures, restarts, and route selection decisions rather than smooth trend growth. Where direct volume data was missing for smaller countries, gaps were handled through proxy trade flows and region level consumption shares, which were then re-checked in interviews before finalizing.
Data Validation & Update Cycle
Outputs are validated through multiple checks so that unusual jumps are explained before sign off. We compare model results against independent signals such as announced capacity changes, net import and export swings, and application side indicators, and then we re-check any variance that looks inconsistent with known plant events.
A multi step internal review is followed, and respondents are re-contacted when a key assumption changes materially or when desk research reveals a new event that can move volumes. Reports are refreshed annually, with interim updates for major developments, and a final pre-delivery review is done so clients receive the most current view.
Mordor Intelligence's Dimethyl Terephthalate Dmt Market Estimate Compared With Other Published Estimates
Published market sizes for DMT do not always line up because the unit of measurement and the included boundaries can differ from one publisher to the next. Some sources express the market in revenue, while others focus on shipped or consumed volume, which changes what gets counted and how pricing assumptions influence the total.
The table shows a clear spread between volume-based sizing and revenue-based sizing, and in Mordor Intelligence's model the market is stated in kilotons, which avoids mixing in price swings from methanol and contract pricing cycles that can inflate or compress USD totals in the same year.
Benchmark comparison
| Source | Market Size | Gaps in Research Methodology |
|---|---|---|
| Mordor Intelligence | USD 764.22 M (2025) | |
| Trade Publisher A | USD 1008.70 M (2025) | This estimate is published in revenue terms, so changes in regional contract prices and currency conversion timing can move the total even if physical volume is flat or declining. |
| Industry Research Portal B | USD 1500.00 M (2024) | This figure is value-based and uses a different base year, and it likely applies broader application and pricing assumptions that are not anchored to a volume balance across regions. |
From the comparison, the main takeaway is that volume-led sizing and value-led sizing answer slightly different questions, so the totals can diverge even for the same product. By tying the model to capacity, trade flows, and application pull indicators, the final number stays traceable to observable drivers and can be repeated when inputs update.


Key Questions Answered in the Report
What is the projected global volume for dimethyl terephthalate in 2031?
The dimethyl terephthalate market size is forecast to reach 631.08 kilotons by 2031.
Which application segment is contracting the slowest?
PET resin shows the least negative trajectory at a -1.95% CAGR through 2031 as circular-packaging programs backstop demand.
Why is solid flake preferred over liquid grades?
Flake offers lower vapor pressure, simpler bulk logistics, and better compatibility with downstream polymerization, sustaining a 72.44% share in 2025.
How will EU carbon-border pricing affect producers?
A CBAM extension to organic chemicals would impose levies on high-carbon imports, potentially improving the cost position of European DMT made with renewable energy.
Page last updated on:


 Your data is secure and never sold or shared.


